29 CHAPTER III RESEARCH METHOD
In this part, the study described about research methodology that used in
conducting the research. It purpose to answer the problem of the study. This
chapter consist of: Research design, population and sample, setting of the study,
research instrument, time and place, data collecting procedures, and data analysis
procedures.
A. Research Design
The study used Pre-Experimental design. The design of this study was
experimental design because the researcher wants to measure the effect of techer
feedback technique in the teaching writing recount text.
This study used quantitative approach. A quantitative approach was one in
which the investigatory primarily uses postpositive claim for developing
knowledge (i.e., cause and effect thinking, reduction to specific variables and
hypotheses and question, use of measurement and observation, and the test of
theories) employs strategies of inquiry such as experiment and survey and collect
data on predetermined instrument that yield statistics data.11
According to Ary, “quantitative research was inquiry employing operational definitions to generate numeric data to answer predetermined hypotheses or
11
Donald Ary,et al , Introduction to Research in Education Third Edition, New York : 1985, p.260
11
John W. Creswell, Research Design Qualitative,Quantitative,and Mixed Second Edition,
questions”.12
It was used quantitative approach because quantitative is the data
that of all number using statistic data.
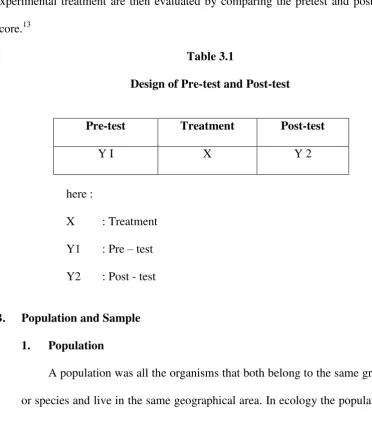
The study was the one-group pretest-posttest design usually involves three
steps : (1) administering a pretest measuring the dependent variable; (2) applying
the experimental treatment X to the subjects; (3) administering a posttest, again
measuring the dependent variable. Differences attributed to aplication of the
experimental treatment are then evaluated by comparing the pretest and posttest
score.13
Table 3.1
Design of Pre-test and Post-test
here :
X : Treatment
Y1 : Pre – test Y2 : Post - test
B. Population and Sample 1. Population
A population was all the organisms that both belong to the same group
or species and live in the same geographical area. In ecology the population
12
Donald Ary, Introduction to Research in Education Eight, United State : Wadsworth (Engange Learning, 2010) p.648.
13Ibid,
p. 303
Pre-test Treatment Post-test
of a certain species in a certain area was estimated used the Lincoln Index.
The area that is used to define a sexual population is such that inter-breeding
was possible between any pair within the area and more probable than
cross-breeding with individuals from other areas. Normally cross-breeding was
substantially more common with in the area than across the border.
According to Arikunto, population was the whole of research subject,
if someone wants to research all of the elements in research area her study
was called population research on census study. 14
In this research, population was tenth-year students of SMAN 1
Katingan Tengah. The Population of the study was tenth grade students in
the academic years 2016/2017 of SMAN 1 Katingan Tengah which
consisted of 34 students. Since there was only one group of class of tenth
grade, so obiviously it was be taken as the population research.
2. Sample
Sample was a part of population. According to Ary, “ Sample was a group selected from population for observation in a study.15 For the sample,
the researcher takes a class to be the sample. This study use purposive
sampling for it. In this study, become sample are all the Students of tenth
grade.
14
Suharsimi Arikunto,procedure penelitian: suatu pendekatan praktek. Jakarta: PT.Rineka Cipta,2000, P. 108
15
The study chooses this class as the object of his research because the
duration of English Learning in this class is longer than others class. The
study hope this research is going to be finished earlier.
C. Setting of The Study
This study was be taken from the tenth grade of the students at
SMA-N 1 Katingan Tengah which is located on A.Yani street.
The study choosed this school as the object of his study for some
reasons. First, this school has become a favorite school of other senior high
schools in Kasongan regency. The favorite school means that the school
becomes an example to be followed by other Senior High Schools at the
same level in the aspects of teaching and learning process, teachers’ profile, teaching facilities, school’s achievements and school management and
administration as well as its quality. Second, this school was located near the
highway so it easy to reach. Third, considering that the English teacher of
this school had implemented the group work before. So, it makes the study
easy to conduct his classroom observation. Fourth, this school has many
good students.
D. Research Instrument
The data needed for this study was be gathered by test
1. Test Type
Test was measurement tool that very important for education
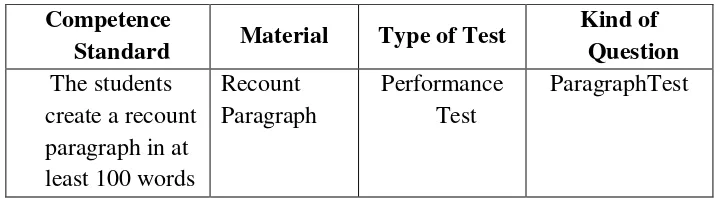
research.16 This study was used writing test about recount paragraph
16
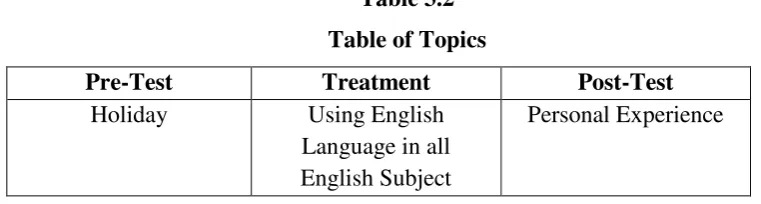
writing with different topic. Like the table for pre-test, treatement, and
post-test, they are:
Table 3.2 Table of Topics
Pre-Test Treatment Post-Test
Holiday Using English
Language in all English Subject
Personal Experience
The study was collected the data from pretest and posttest. From
them was found the effect of the teacher feedback technique in recount
text in writing. Pretest was be given in first before treatment. The last test
was posttest. It aims to compare the pretest scores to the posttest scores. In
the treatment the study was teach in recount paragraph with teacher
feedback technique for found the effect to the student’s score.
2. Documentation
Documentation was one way to support the data with directly from
the place of research, activity, photos that the relevant research and data.
The study in this research was collected some information data classes,
the students’ name list, syllabus, and score of students. All those data was
E. Instruments Validity
Standard Material Type of Test
Kind of
English of the first semester at SMA-N 1 Katingan Tengah, with following:
1) Recount text test instruction on the test.
2) Scoring system for evaluation the paragraph.
3) Writing recount text for the kind of test.
4) The language of items was English.
5) The test was suitable on the syllabus.
17
H. Douglas Brown, Teaching by Principles: An Interactive Approach to Language Pedagogy, San Frasisco: Longman, 2000, p. 388.
18Ibid,
3. Construct Validity
Construct validity was the theoretical construct in the language
learning and teaching which is operational the entity being received.19 In this
study, the test item following the purpose of syllabus that aim at developing
the students knowledge and skill in writing with various types of paragraph
developments: recount text.
To measure the validity of the instrument, the study was used the
formulating of product moment by Pearson as follows:20
𝐫𝐱𝐲= 𝐍∑𝐗𝐘 −
(∑𝐗)(∑𝐘)
{𝐍∑𝐗2−(∑𝐗)𝟐}{𝐍∑𝐘𝟐− ∑𝐘 𝟐}
Where:
𝐫𝐱𝐲 : Total coefficient of correlation
∑𝐗 : Total value of score X
∑𝐘 : Total value of score Y
𝐍∑𝐘 : Multiplication result between score X and Y
𝐍 : Number of Students
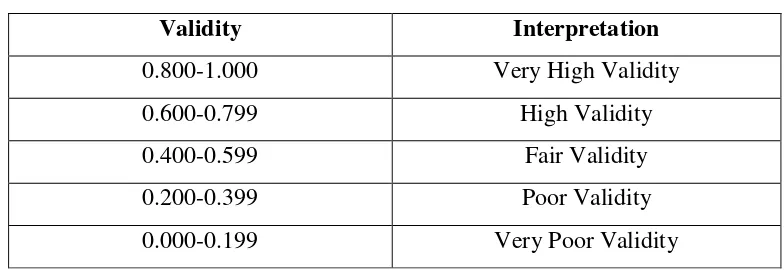
To know the level of validity of instrument, the value was interpreted based
on the quality of validity as follows:
t-test > t-table= Valid
t-test < t-table= Not Valid
19Ibid,
p. 389.
20
Table 3.4 Criteria of Validity
Validity Interpretation
0.800-1.000 Very High Validity
0.600-0.799 High Validity
0.400-0.599 Fair Validity
0.200-0.399 Poor Validity
0.000-0.199 Very Poor Validity
F. Instruments Reliability
Reliability refers to the consistence of score.21 In this study, the study
was employ on two raters. They are the study self and teacher of writing class.
The coefficient and interpretation of inter rater reliability according to
Djiwandono as show in table 3.5:22
Table 3.5
Inter-rater coefficients Correlation Interpretation Correlation Coefficient Interpretation
0.90 to 1.00 or -0.90 to -1.00 Very High or Negative Correlation
0.70 to 0.89 or -0.70 to -0.89 High Positive or Negative Correlation
0.50 to 0.69 or -0.50 to -0.69 Moderate Positive or Negative
Correlation
0.30 to 0.49 or -0.30 to -0.49 Low Positive or negative correlation
0.00 to 0.29 or -0.00 to -0.29 Little if any Correlation
21Ibid,
p. 386.
22Ibid,
G. Time and Place of The Study
The study was conduct in two months. The experiment was does to the
sample in four times of meeting, first meetings for the pre-test, two meetings for
the treatment and last meeting for post-test. There are four meetings for the
treatment. The study taken four meetings in order to take the data briefly. In
addition, the school has their own system in learning as implement in curriculum
or syllabus. The study avoid the miscommunication between researcher and it
school. Next, many experts recommend for treatment in experimental research at
leats done on four meetings.
H. Data Collection Procedures
To get the data that was need in the study , there are few of ways to does it,
they are :
1. Preparation
a) The study chooses the place of the study.
b) The study gives information for the instance that related to show
this study.
c) The study was given the pre-test to the students.
2. Implementation
The study given the treatment by used teacher feedback strategy in
teaching recount text
3. Conclusion
a) The study given the test to the students.
c) The study puts the data to the table had been prepare.
I. Data Analysis Procedure
In order to analyze the data, the study was does some way procedures:
1. Collecting the score of the student work sheet result. With the table:
Code of Students Experimental Class
Y X
SUM (∑)
Where:
Y : Pretest
X : Posttest
2. Tabulating the data into the distribution of frequency of the score table,
then founnd out the mean of students’ score, standard deviation, and standard error of variable by used the formulas bellow:
a. Mean
M =
𝐹𝑋𝑁
Where:
M = Mean
F = Frequency
= The sum of
X= The scores
b. Measuring the sum of standard deviation.
𝑆𝐷
=
𝑖
∑D2𝑁
−
Where:
SD = Standard deviation
∑ 𝐷 = The square deviation sum of experimental group
N = The total number of respondents
c. Measuring the standard error.23
SEM = SD 𝑁−1 Where:
SEM = Standard error of the mean
SD = Standard deviation
N = Number of case
1 = Bilangan konstan
3. The study used normality test. It used normality of the data found the
normal distribution or not.
4. The study used homogeneity test. It used relatively to found the same
variant or not.
5. Then the study applied all of them into t-test formula. That purpose to was
there is effect or teacher feedback in writing or not. The formula was:24
6. The last, the study was calculate degree of freedom (d.f) by used formula:
to = MD SE MD
Where:
MD = Mean of Different
SEMD = Standard error of the mean
23
Anas Sudijono, Pengantar Statistik Pendidikan, Jakarta: Rjawali Press, 2012, p.282.
24
to = T Test
By the criteria:
If ttest ≥ ttable, Ha is accepted and Ho is rejected If ttest ≤ ttable, Ha is rejected and Ho is accepted
7. The last, the study calculate degree of freedom (d.f) by using formula:
df = N-1
After getting t-count, then the study compared with it to t-table of
certain significant level. If the t-count is higher than t-table, it means that
there is positive effect of Teacher Feedback in teaching writing. The point
was writer hypothesis is accepted. In contrary, the count is lower than
t-table, the writer is not accepted.
8. In addition, the writer used SPSS 18 program to compare the data.