Recieved: April 2016; Accepted: May 2016
Abstract
Regional Development encompasses many aspect of economic, social, and environmental attributes.
In the context of developing country, the decision to fulfill these attributes are often hindered by lack
of clear development scenarios and constraints. This study is an attempt to capture the complexity of decision makers for regional development scenarios using imprecise decision modeling (IDM) by incorporating imprecise information and uncertainties. A series of social, economic and environmental criteria based on agreement from multi stakeholders dialogues were developed along with four policy development scenarios, and 13 indicators of economics, social and environment aspects were assessed. Data were analyzed using expected value theory and selection of the best policy senario was analyzed by means of delta method. Results from such a modeling provides variety of decision alternatives based on probabilities and risk assessment associated with achieving policy objectives.
Keywords: Regional development, imprecise decision modeling, risk and imprecise information JEL: 021, R11
1. Introduction
Regional Development is not only pursuing economic growth but also embracing other aspects such as social and economic dimensions. Therefore, regional development should adopt the principle of sustainable development. As stated in Elliott (2006) and Dasgupta (2007),
sustainable development, must fulfill the need of current generation without sacrificing the
need of future generation and without damaging the environment. It is acknowledged that the principle of sustainable development has now shifted not only in terms of national context but also regional development context as well, known as sustainable regional development (SRD) framework (Giaoutzi and Nijkamp, 1993). In this regard, as Haughton and Counsell (2004) argue that achieving sustainable development in
the regional contex is not only urgent to ensure that regional development meet sustainability principles but also timely.
In the context of sustainable development, the three pillars of development i.e economic, social, and environment often can not simultaneously be achieved due to various constraints and the complexity of measuring indicators of these pillars. In addition, lack of clear vision of pursuing desirable yet achievable goals of regional development complicates the achievement of sustainable development. Decision makers are often faced with many different policy alternatives each with different criteria. Choosing among the best alternatives are also complicated by imprecise information on the importance of criteria and alternatives being chosen. As a result, pursuing policy objective
Correspondence E-mail: [email protected]
Graduate School of Rural Planning and Development Bogor Agricultural University, Jl. Kamper Wing 10 level 4 Kampus IPB Darmaga Bogor 1660 Indonesia
Novita Erlinda, Akhmad Fauzi, Slamet Sutomo, Eka Intan Kumala Putri
might impose risk and uncertaintis which might not be anticipated by policy makers.
Such a situation is faced by decision makers in Jambi Province. The Province is one of the provinces in Indonesia that face the development trade off between economic, social, and environments. With existing vision of “JAMBI EMAS” stands for Jambi Ekonomi Maju dan Sejahtera or Advanced economic growth and social welfare, the province is aiming to have higher economic growth of 8% while at the same time reducing poverty and providing jobs. Nevertheless, achieving those goals is not on easy task due to various constraint both from internal and external factors. This paper attemps to address such a challenge using Imprecise Decision Modelling or IDM developed by Danielson et al. (2003a) and Idefeldt and Danielson (2006). The analysis of Jambi’s IDM was based on development scenarios set out from a multi-stake holder dialoge. This paper is the first to provide a platform for decision maker with various policy options based on the best available information yet imprecise weighted scenarios.
Jambi Province is located in the Sumatera Island of Indonesia and lies in a volcanic ring
of fire of Bukit Barisan. The total area of the
Province is 53.3 thousand km2 comprising of nine regencies and two cities, and home to 3.3 million
inhabitant. A significant portion of Jambi
area is a conservation area of Kerinci Sablat and three other forested nation parks covering an area almost 600 thousand ha. These conservation areas are vital to provide ecosystem services ranging from water services, biodiversity, recreational as well as carbon storage. For these reasons, the Jambi conservation areas are designated as National Strategic Area.
Regional development in Jambi is facing challenges not only due to the trade off betwen conservation and economic development, but also due to the fact that there is competition from the neigborhod provinces such as South Sumatera, Bengkulu, and Riau which share the same natural comodities in the market such as Palm oil, rubber
and other forest products. In order to have better competitive advantage, the provincial goverment has set out the midterm regional development of Jambi during 2010 – 2015 which has strong vision on economic development security and prosperity which is stated in “JAMBI EMAS” (literaly means Gold Jambi, but Emas is actually acronym for higher economic growth, security, equity and prosperity in Bahasa Indonesia).
To pursue Jambi Emas vision, the provincial
government established five development
priorities. These are expansion of regional infrastructure and energy, education and socio-cultural, establishing community economics, investment and tourism, food security and better management of natural resources and environment, and the last one is good governance.
Jambi Emas in essence is not merely economic paradigm but also sosially inclusive and environmentaly sustainable development. Nevertheless, the implementation of such sustainable development goals is a big challenge. For example a study by Fauzi and Oxtavianus (2014) found that in terms of sustainable development index during periode of 2009-2011, Jambi’s sustainable development index was still below average national index, indicating
that existing development has not fullfilled
sustainable development principles. In addition, implementing sustainable development has to be operational and the risk asosiated with achieving of those goals have to be taken into account. Such risks are often overlooked by policy makers, therefore analysis to assess the trade off faced by policy objectives and the risk that might arise are needed.
2. Methods
This study was carried out in Jambi Province (Figure 1) and was developed based on a Multi Criteria Analysis (MCA). Sutter (2003),
classifies MCA based on two broad categories i.e
recognized i.e value measurement model and outrangking models. Several Value Measurement Models are quite popular such as Analytical Hirarchy Prosess (AHP) and Delta Method. While among outrangking models, technique of
outrangking analysis such as TOPSIS (Technique Ordering Preference Similarity Ideal Situation), PROMETHEE and NAIADE are among the popular ones.
This study used Delta model based on imprecise probabilities of setting the targets. IDM was developed based on the nature of information available to decision makers which is mostly vague and imprecise. The vagueness and imprecision of information might arise due to lack of systematic data or might be due to the dynamic of policy targets set out by policy makers as well as inconsistencies and complexitis in making decision for a long term frame work. Such a situation is most likely occur in developing
countries which make it difficult to get the best
data, while lack of human resource capacity make
it difficult to have reliable information.
The analysis of Imprecise Decision Model was carried out by DesideIT software developed by Danielson et al. (2003a). It is based on expected value theory, sometimes expressed in monetery value of the following
( )
criteria. The variablev
ij represents the value of ith indicator and jth alternative, whilep
ij represents the probability of ith indicator andj
th alternatives respectively. As stated previosly, IDM is based on MCA value measurement model whereby the best alternatives is chosen by the delta method. The Delta Method is written as(
)
(
)
ij
EV A
iEV A
jδ
=
−
(2)
which is simply the defference betwen the expect-ed value of two alternatives.
Once we obtained the delta value, the DecideIT evaluates the relative strenght among alternatives to assess the best alternatives. The relative strength of these alternatives denotes by
( )
( )
( )
max
ij ijmin / 2
ijrel
δ
=
δ
+
δ
=
max
( )
δ
ij−
max
( )
δ
ji
/ 2
(3)
Figure 1. Map of Jambi Province
Jambi Provincial Spasial Planning, 2
From those formulation, DecideIT will determine the best alternative based on the expected value derived from the model. In addition to provide the differences among alternatives, DecideIT also provides several decision aid that can be useful for decision making. Among these
are risk profille and Security Threshold. The Risk Profile is defined by
( )
expected value of outcomex
i. The securitythreshold is defined as
(
)
the maximum probability of abstainingr
or less (Idefeldt, 2007). The total ranking of the alternative chosen by the model is calculated based on the following formula( )
1( )
Even though IDM is quite popular in
business and financial area (Danielson et al.
2003b; Danielson, 2004), few application related to sustainable development assessment have been condected. Some of these include Mihai et al. (2005) on choosing sutainable mining policy in Rumania, and Kivunike et al. (2015) on sustainable health care provision in Uganda. This study is therefore,
is the first one to implement IDM technique to
sustainable regional development context.
To implement the model in regional development planning of Jambi Province, four alternatives of development scenarios along with economic, social, and environment indicators were developed. The four alternatives are Business as usual, or named BAU (alternative 1), Increase
local competitiveness known as PDS (alternative 2), the use of local resources or coded MSDL (alternative 3), and development based on non-extractive activites, known as ENE (alternative 4). The DecideIT software threats those policy options or alteratives simply as alternative 1, alternative 2, alternative 3, and alternative 4, respectively. The selection of those alternatives and their associated criteria were based on agrement from multi-stake holder Focus Group Discussion attended by goverment representativs agencies, NGOs, University, communities as well as private sectors. Appendix 1 describes the criteria and indicators used for the study.
The indicators chosen above are indicators that have been established in the long term development plan of Jambi during 2010-2015 (RPJMD). Therefore, in order to be consistent with regional planning, those indicators and their values stated in RPJMD were used as a baseline for analysis. Appendix 2 provides detail of unit measurement for each indicator.
As can be seen from Appendix 2, each indicator has different unit of meassurement. In order from IDM to be operational, those meassurement have to be normalized using normalisation technigue by the formula
2 alternative j. Once the units have been normalized, the comparison among alternative can be caried out using index number from 0 to1]
3. Results And Discussions
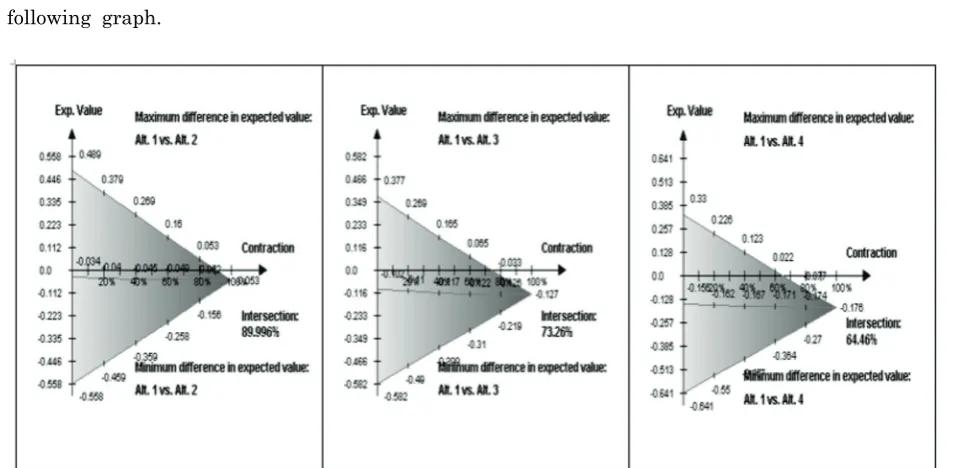
The expected value of pairwise comparision between two alternatives are presented in the
following graph.
Figure 2 Expected value alt 1 vs alternative 2, Expected value alternative 1 vs alternative 3, and expected value alternative 1 vs alternative 4
Figure 2 depicts the comparison of alternative 1 versus other alternatives i.e, alternative 2, alternative 3, and alternative 4. As can be seen from Figure 3, the larger the area the better the alternative compared with other alternatives. For example, when comparing alternative 1 (BAU) and alternative 2 (Competitiveness) the shaded triangle area of alternative 2 is larger than the shaded area of alternative 1. This means that alternative 2 is preferred than alternative 1 (BAU). Similarly, when comparing alternative 3 versus alternative 1, the area of alternative 3 is larther than alternative 1, which indicates that alternative 3 (local resources) is more preferred than alternative 1 (BAU). If we compare alternative 4 with alternative 1, it also indicates that alternative 4 is more preferred than alternative 1.
Figure 2 provides comparison in terms of maximum and minimum differences betwen two alternatives. For example, when we compare alternative 1 (BAU) and alternative 2 (PDS), if
the best things happen, the difference is positive 0.489 point, while if the worst things occur, the difference is negative -0.558. Those numbers correspond to normalized unit of criteria being used as described in Appendix 2.
Figure 3 presents comparison of alternative 2 versus alternative 3 and alternative 4. As can be seen Figure 4 alternative 3 is preferred to alternative 2, similarly alternative 4 is also better comparred with alternative 2 as shown in the larger shaded area. Figure 4 also indicates that alternative 4 (ENE) is better than alternative 3 as the area of alternative 4 is bigger than alternative 3.
data is close to its actual value. As can be seen form the graph alternative 4 dominated other alternatives while alternative 1 (i.e., business as
usual) is less prefereble alternative among four scenarios of regional development.
Figure 3 Expected value alternative 2 vs alternative 3, Expected value alternative 2 vs alternative 4, and expected value alternative 3 vs alternative 4
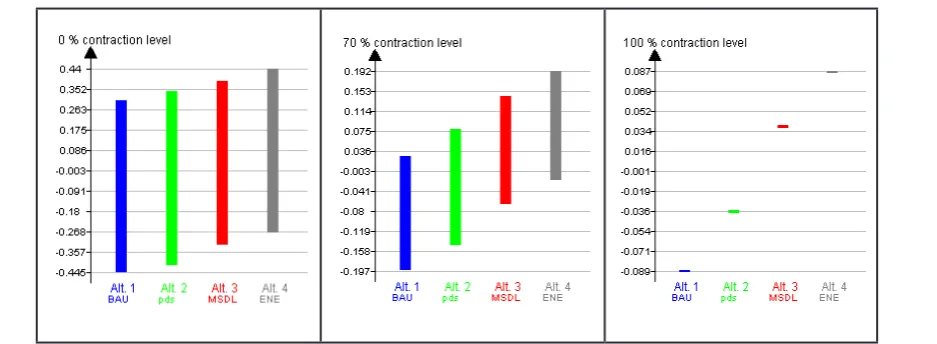
Figure 4 Cardinal ranking contraction level of 75% and 50%
As in any modelling scenarios, the model is relatively sensitive to any uncertainties resulting from setting the target by the decision makers. To address such an issue a sensitivity analysis using Tornado Diagram was carried out. Tornado
Figure 5 Tornado Diagram
As can be seen from Tornado Diagram (Figure 6), the red color indicates that the expected
values is influenced in a negative way while the
green bar show a positive way. For example while
criteria E5 (economic indicator for alternative 2)
influenced positive way to the overcome at 0.051, it also influences in a negative way to the outcome
at -0.021 point.
As stated earlier in the method section, one of the advantages of using IDM is the ability to assess the risk associated with each policy alternatives. Figure 6 presents cumulative probability risk associated with each alternative. It shows how the risk of choosing the alternative
compared with others. As can be seen from figure
7 alternative 3 and alternative 4 show lower probability risk compared with alternative 1 and alternative 2. This indicates that choosing alternative 3 or alternative 4 will incur less cost to regional development than alternative 1 and alteanative 2.
In the context of regional development, it is often important to asess the security threshold. This is due to the fact that the objective of development, especially in the medium and long term is subject to uncertainty. In the Imprecise Decision Model such a scenario can be handled through setting sensitivity threshold. Security thresholds describes an evaluation among informations by setting a minimum level of target with certaint probability. Figure 8 describe the result of security threshold by setting minimum value of 0.2 with probability of 10%, 25%, and 50%.
Figure 7 scurity threshold 10-50%
As can be seen from Figure 7, alternative
3 and alternative 4 fit in to specific risk profile
while alternative 1 is at risk to be selected at contraction level up to 70%. Alternative 2 is it
also as risk even if it fullfills the thresholds at
lowercontraction level.
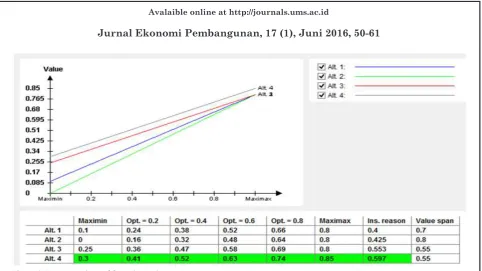
In addition to security threshold sensitivity analysis of the model can also be performed by analysis of extreme values. The extreme value for each alternative is tested according to the following rules.
- Maximin: Choose the alternative that gives the best results if the worse possible out-come occur.
- Maximax: Choose the alternative that gives the best results if the best possible outcome occur.
- Pessimism-Optimism Index : Mixed of max-imax and maximin.
- Value Span: Choose alternative where the consequence with maximin value span of that alternative is lower.
- Principle of Insufficient Reason: Choose the
alternative such that the averege most lekely point value is maximized.
Result of the assessment based an extreme values
Figure 8 Extreme values of four alternatives
As can be seen from Figure 8, the upper part
of the graph indicates the worst scenarios of worst
consequence (0) and the best consequence (0.85)
among alternatives, while the value in the lower part of the graph indicates the weighted averge
between the best and the worst consequences of
the alternative. Also the box indicate that under maximin and index of pessimism–optimism 0.2
to 0,8 as well maximax and insufficient reason,
alternative 4 is the best alernative to be selected compared with others.
It is often found that decision makers are interested in the relationship between alternatives and the order of preference that can be chosen. In this regard, DecideIT provides preference order feature that rank the most preference consequences to the least preference consequences. Figure 10 describes preference order among criteria and alternatives.
Figure 10 Preference order among criteria and alternatives
From Figure 10 it can be inferred that criteria number 18 at alternative 2, criteria number 14 at alternative 2, and criteria 5 of alternative 1 are the least preference consequences. Figure 10 also indicats the interaction among criteria in relation to preference order.
Indifference Interval: 5.0%
Alt. 4
Alt. 3
Alt. 2
Alt. 1
Figure 11 Ordinal ranking at indiffrrence interval 5%
As can be seen from Figure 11 , alternative 4 is better than alternative 3, and both dominating alternatif 2 and alternatif 1.
4. Policy Implications
Several policy implications can be drawn from this study. First, using IDM policy makers will be able to assess the risk association with the policy options being chosen. In addition, IDM will provide policy platform which most likely provide a better outcome for regional economic development. In this study, policy optioin based on non extractive use of natural resources and
using local resources more efficiently would
provide more sustainable development outcome for regional development in Jambi. The non-extractive use of natural resources is part of what so-called Green Economy paradigm. Several programs can be derived from this non-extractive use such as developing eco-tourism, encouraging creative economy and encouraging the use of ecosystem services. An economic instrument such as payment for environmental services (PES) can be used to encourage economic exchange of ecosystem services such as water services, carbon trade or tourism. The provincial government might encourage disctrict level governments (Kabupaten/Kota) to engage in PES scheme such
as the use of water resources between upstream area of Kerinci Seblat and downstream areas. In order this scheme to be operational, the by law or regional regulations (known as PERDA) need to be issued by provincial government.
Second, the study also indicate that encouraging local resources would be second best option for regional development. Therefore, the regional economy can be boosted by encouraging more small and medium enterprises to actively participate in the economy. Such an involvement of small and medum enterprisess need to be
supported by financial sectors and should directed
toward nature based economy and non-extractive eactivities such as eco-tourism, cultural festivals and other supporting activities which encourage the use of local resources.
Third, this study would also provide for regional develoment platform using policy options offer from this study. Since there are risks invoved in pursuing high economic growth agendas, the regional government should follow its spatial planning and not to adjusted very often to accommodate economic expansions. The spatial planning should be uses as a benchmar toward pursuing green economy while at the same time protecting the natural resources and its ecosystem services which is vital for the economic development itself.
5. Conclusion
Achieving sustainable development which includes social, economic, and environment criteria is indeed a challenging issue. In the contex of developing country such an issue is often exacerbated by lack of resources and information to address complex issue associated with pursuing goal of sustainable development. This paper have shown that with aid of a proper tool and a multi-stake holder dialogue, scenarios of sustainable development can be assessed. In addition, the risk and uncertainties associated with the
benefits and cost of development are taken into
lesson learned can be drawn from this study to be applied to other regional development contexts both in developed and developing countries. One of the key factors derived from this model is that determining alternative development scenarios along with their relevant indicators play a key role in developing measurable and achievable development goals. This study also draws lesson learned that setting ambitious target by decision makers should be matched against alternative development scenarios so that such as a target could be evaluated and at the same time policy maker would have a broads view of pursuing development agendas.
6. References
Danielson, M, Ekenberg, L., Johansson, J, and Larsson, M. (2003a). “The DecideIT Decision Tool”, Proceedings of ISIPTA’03, Bernard,
J-M, Seidenfelf, T, and Zaffalon, M. (eds),
204-217, Carleton Scientific.
Danielson, M, Ekenberg, L., Johansson, J, and Larsson, M. (2003b). “Decision Evaluation of Three Flood Management Strategies”, Department of Informatics/ ESI Orebro University SE-701 82 Örebro, SWEDEN, and Department of Information Technology Mid Sweden University SE-851 70 Sundsvall, SWEDEN.
Danielson, M. (2004). “Handling Imperfect User Statements in Real-Life Decision Analysis”. DECIDE Research Group, Department of Informatics/ESI Orebro University, SE-701 82 ¨ Orebro, Sweden.
Dasgupta, P. (2007). Measuring Sustainable Development: Theory and Application. Asian
Development Review, Vol(24) Number 1. 1-10
Elliott, J.A. (2006). An Instriduction to Sustainable Development. Third Edition. Routledge, Oxon. UK.
Fauzi, A, and Oxtavianus, A.( 2014). “The Measurement of Sustainable Development in Indonesia”. Jurnal Ekonomi Pembangunan
Vol 15, Nomor 1, 68-83, Juni 2014.
Giaoutzi, M, and P. Nijkamp. (1993). “Decision Support Model for Regional Sustainable Development”. Avebury, UK.
Haughton, G. and D. Counsell. (2004). “Regions and sustainable development: Regional Planning matters”. The Geographical
Journal, Vol 170(2), 135-145.
Idefeldt, J, and Danielson M. (2006). “Multi-Criteria Decision Analysis Software for Uncertainand Imprecise Information”. Stockholm University & Royal Institute of Technology Forum 100, SE-164 40 Kista, Sweden.
Idefeldt, J. (2007). ”An Applied Approach to Numerically Imprecise Decision Making”. Thesis for the degree of Doctor in Computer Science Department of Information Technology and Media Mid Sweden University, Sweden.
Kivunike, F.N, Ekenberg, L, Danielson,M, and Tusubira, F, F. (2015). “Using a Structured Approach to Evaluate ICT4D: Healtcare Delivery in Uganda”. The Electronic Journal of Information Systems in Developing Countries
Mihai, A, Marincea, A, and Ekenberg, L. (2015). “A Multicriteria Decision-Making Analysis of the Ro
ș
ia Montană Gold Mining Project”,Research undertaken by MRC–Median Research Centre, Bucharest, Romania
eGovlab, Department of Computer and
Appendix
Appendix 1. Structure of the model
![Figure 1. Map of Jambi Province[source: Jambi Provincial Spasial Planning, 2013-2033]](https://thumb-ap.123doks.com/thumbv2/123dok/3587377.1452696/3.595.55.532.123.387/figure-jambi-province-source-jambi-provincial-spasial-planning.webp)