© The Author 2014. Published by Oxford University Press on behalf of the American Association for Public Opinion Research. All rights reserved. For permissions, please e-mail: [email protected]
COGNITIVE STYLE AND THE SURVEY RESPONSE
THOMAS J. LEEPER*
Abstract According to democratic theory, citizens should have a set of well-defined, valenced opinions. Yet evidence suggests that indi-viduals vary in chronic evaluative tendencies, with some processing information in an online fashion, spontaneously becoming opinionated about whatever they encounter and recalling summary evaluations eas-ily. Individuals lower in evaluative tendencies do not form attitudes in this fashion and instead must construct and report attitudes based upon recalled considerations. The implications of these individual differ-ences for survey practice are largely unexamined. The present research shows, across multiple surveys and question formats, that individuals low in need to evaluate (NE) offer greater numbers of non-informative responses to opinion questions than those higher in NE, an effect not attributable to interest, knowledge, or lack of cognitive effort. And when they do supply answers to opinion questions, low-NE individuals report attitudes less extreme than individuals higher in NE. The results suggest that opinion surveys may systematically misrepresent the variability of citizens’ beliefs and the extremity of aggregate public opinion by rel-egating some of those low in NE to non-informative response options.
How and why citizens seem to lack opinions on major issues, including those that are contentious and politicized, has puzzled public opinion researchers for decades (see, for example, Converse [1964]; Neuman [1986]). Most of the answers to these questions have related to lack of sophistication or a deficit of interest, either in the survey interview or in politics generally. A lack of well-defined, valenced opinions violates the core expectation that democratic theory holds for citizens (Dahl 1971). Yet discussion typically ignores the fact
Thomas J. Leeper is a postdoctoral researcher in the Department of Political Science and Government at Aarhus University, Aarhus, Denmark. The author wishes to thank the POQ editors and anonymous reviewers for their helpful feedback on earlier drafts of this paper. Replication data and code for this article can be found at the Harvard IQSS Dataverse: http://thedata.harvard. edu/dvn/dv/leeper (DOI:10.7910/DVN/V9ROA). *Address correspondence to Thomas J. Leeper, Department of Political Science and Government, Aarhus University, Bartholins Alle 7, 8000 Aarhus C, Denmark; e-mail: [email protected].
doi:10.1093/poq/nfu042 Advance Access publication October 31, 2014
at Jordan University of Science and Technology on July 26, 2016
http://poq.oxfordjournals.org/
that some individuals are predisposed to form opinions “online” while others do not readily form such evaluations. Evidence suggests that evaluative indi-viduals update opinions automatically when processing new information and express those evaluations easily (Lodge, McGraw, and Stroh 1989; Druckman
and Lupia 2000). Individuals lower in evaluative tendencies instead tend to
store information without creating a running-tally opinion, and must construct opinions based upon recalled considerations. What effect does this have on survey responses? In particular, how does cognitive style impact response pat-terns on opinion questions?
The obvious expectation is that evaluative individuals, being more prone to hold online opinions, should be more likely to supply valenced opinion responses and more extreme responses, while those who form memory-based opinions are more likely to supply non-informative responses. As such, opinions recorded in survey responses may reflect an unintended interaction between cognitive style and survey procedure. Yet surprisingly little attention has been paid to how cognitive style might shape survey responding (i.e., pat-terns of item response and nonresponse). This matters because public opinion research often denigrates those who fail to express valenced attitudes, when those individuals may simply lack the “online” attitude summaries necessary for quick survey responding. The present research shows that need to evalu-ate (NE) (Jarvis and Petty 1996), a standard measure of evaluative cognitive style, is a strong predictor of non-informative responses and the extremity of informative responses, independent of variations in political interest, political information, need for cognition, and other stable demographics. The paper concludes by discussing the implications of these findings for survey practice.
Evaluation and Attitudes
Surveys consistently suggest that some people have no opinion on politi-cal issues, even those that are high profile. Common interpretations of these responses have focused on a few factors: either non-informative responses reflect “nonattitudes” (Converse 1964; Norpoth and Lodge 1985) and the elec-torate’s political disinterest (see Neuman 1986), or they reflect survey satisfic-ing, where respondents are unengaged with the survey interview (Krosnick
1991; Krosnick, Narayan, and Smith 1996; Tourangeau, Rips, and Rasinski
2000). While political interest and satisficing explain some of the variation in survey responding, an unexamined possibility is that survey responding also reflects individual differences in cognitive style.
Research suggests that individuals vary on (at least) two dimensions of cog-nitive style: need for cognition (NC) (Cacioppo and Petty 1982) and need to evaluate (NE) (Jarvis and Petty 1996). NC measures individuals’ disposition to think about information in their environment. NE measures tendencies to eval-uate information. High-NE individuals engage “online” processing (Lodge,
McGraw, and Stroh 1989), storing readily accessible summary evaluations of
at Jordan University of Science and Technology on July 26, 2016
http://poq.oxfordjournals.org/
(political) objects in memory. Low-NE individuals tend to be memory-based processors, learning about their environment but not forming such summary evaluations. Despite the growing use of NE as a predictor of vote choice and candidate evaluation (Bizer et al. 2004; Holbrook 2006), as a moderator of framing effects (Chong and Druckman 2010; Druckman and Leeper 2012), and as a proxy for motivated reasoning (Nir 2011), the only published account linking NE and survey responding comes from a small student sample and shows that high-NE students are less likely to supply “don’t know” (DK) responses, but with no other effects on response patterns (see Jarvis and Petty 1996). Another unpublished paper, using the ANES 1998 Pilot Study, finds only minimal evidence for an effect of NE on DK responding (Bizer et al.
2000). Federico (2004) finds that NE and NC interact to affect attitude
extrem-ity but does not examine other response patterns.
How does NE affect responses to opinion questions? High-NE individuals can simply retrieve online opinion summaries from memory, while low-NE individuals tend to have no such summaries to retrieve, instead needing time to construct opinions anew. As such, we should expect higher NE to be associated with fewer non-informative responses to opinion questions. By contrast, low-NE individuals should be more prone to providing non-informative responses to opinion questions. The latter group may also be less extreme when they do respond, due to the short time they have to assemble opinions from stored considerations during the course of a survey interview. The remainder of this paper first tests for the expected relationship between NE and non-informative survey responses, then explores whether NE is related to opinion extremity.
Data and Methods
Data are drawn from the American National Election Studies (ANES) 2008– 2009 Online Panel and ANES 2000, 2004, and 2008 election surveys. This combination of data is used because the Online Panel and election surveys use two different response formats on opinion questions. The 2008–2009 ANES Online Panel measured opinions on eight different policies at each of two points in time.1 All questions were asked with identical wordings at both panel
waves, involved identical response options, and used a branching format. Respondents were asked to select among “favor,” “oppose,” and “neither favor nor oppose” response options. Afterward, those respondents selecting “favor”
1. Data are drawn for two waves of the panel (from a total of 21). The sample for Wave 1 (January 7–April 11, 2008) involved 1,623 respondents, and Wave 10 (October 2–November 3, 2008) involved 2,628 respondents from US households, recruited from a landline RDD frame, who completed the surveys online via the Internet or, for respondents without Internet access, a study-provided Internet device. AAPOR Contact Rate 1 for the entire panel was 35 percent, COOP1 was 74 percent, RR1 was 26 percent, and RR5 was 74 percent. Wave-specific RR1 response rates were 18 percent for Wave 1 and 16 percent for Wave 10, and RR3 response rates were 29 percent for Wave 1 and 26 percent for Wave 10.
at Jordan University of Science and Technology on July 26, 2016
http://poq.oxfordjournals.org/
or “oppose” expressed their degree of their support. Respondents who initially provided no answer or selected “neither favor nor oppose” were coded 1 as providing a non-informative response and 0 otherwise.2Supplemental
appen-dix 1 includes exact question wordings for each question for all of the surveys.
NE was measured with two questions (which have been standard on the ANES since 2000; Bizer et al. [2000]). The first reads “Some people have opinions about almost everything; other people have opinions about just some things; and still other people have very few opinions. What about you? Would you say you have opinions about almost everything, about many things, about some things, or about very few things?” The second reads “Compared to the average person, do you have fewer opinions about whether things are good or bad, about the same number of opinions, or more opinions?” and includes a follow-up asking whether the respondent has a lot [more/fewer] or just some-what [more/fewer] opinions. These two questions are averaged and rescaled to range from 0 to 1.3 The main analysis regresses the proportion of
non-inform-ative responses across questions on NE and a number of covariates.
The ANES surveys from 2000–20084 offered three standard opinion
ques-tions—about government spending, jobs, and aid to blacks—that use an unlabeled middle response category along with an explicit “haven’t thought about this much” option. No answer, a DK, or “haven’t thought about this much” were considered non-informative responses (and coded 1), while all other responses (including those providing a middle category response) were coded 0. NE was measured and coded in these surveys in the same way as in the online panel.5 To analyze the relationship between cognitive style and
2. Except in the case of extremely unusual, unimportant, or unfamiliar issues where one might be informed but undecided, “neither favor nor oppose” is semantically equivalent to offering a DK or “no opinion” response (Bishop 1987). Sturgis, Roberts, and Smith (2014) show that, once prompted, half or more of the middle-category respondents admit to choosing the non-informative category to avoid having to say “don’t know.” Supplemental appendix 3 contains counts and per-centages of each type of response. Because few respondents did not answer the question, the results are identical when only “neither favor nor oppose” responses are examined.
3. For the first NE question, three respondents provided no answer. For the second question, six respondents provided no answer. Consequently, missingness on the key independent variable should be relatively unproblematic. The mean and SD of the resulting scale were 0.58 (0.20). 4. The 2000 survey (n = 1,807) was collected through in-person and telephone interviews between September and December 2000. In-person respondents were drawn from an area probability sam-pling frame, and telephone respondents from a landline RDD frame. The overall response rate was 61.2 percent (pre-election) and 52.6 percent (post-election), with a reinterview rate of 86 per-cent. The 2004 sample (n = 1,211), was drawn via area probability sampling and used in-person interviewing. The response rate was 66.1 percent (pre-election) and 58.2 percent (post-election), with an 88.0 percent reinterview rate. The 2008 survey (n = 2,323) was an area probability sample with an RR1 of 59.5 percent (pre-election) and 53.9 percent (post-election), with a 90.5 percent reinterview rate. All surveys involved adult respondents in the United States.
5. In the 2000 survey, 4 respondents provided no answer to the first NE question and 31 provided no answer to the second question. In 2004, these numbers were 1 and 0, respectively. In 2008, the numbers were 2 and 17, respectively. Means and SDs were 0.56 (0.23) in 2000, 0.58 (0.21) in 2004, and 0.55 (0.22) in 2007.
at Jordan University of Science and Technology on July 26, 2016
http://poq.oxfordjournals.org/
non-informative responding, data from all years were pooled. Non-informative responding on each question was regressed on NE, several covariates, and year-fixed effects (with 2000 as baseline).
Effects of NE on Non-Informative Responding
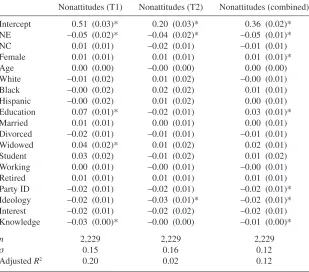
In the online panel, as many as 25 percent of respondents offered non-inform-ative responses (see supplemental appendix 3, tables 1–2). Controlling for potential confounds (e.g., low political interest or knowledge) and demograph-ics, the regression results in table 1 suggest that cognitive style has a consistent effect on individuals’ survey responses. In T1 and T2, NE has a consistent negative effect on non-informative responding (i.e., those higher in NE are less likely to offer non-informative responses). The pooled results in column 3
Table 1. Non-Informative Responding on Opinion Questions, ANES 2008–2009
Nonattitudes (T1) Nonattitudes (T2) Nonattitudes (combined)
Intercept 0.51 (0.03)* 0.20 (0.03)* 0.36 (0.02)*
NE –0.05 (0.02)* –0.04 (0.02)* –0.05 (0.01)*
NC 0.01 (0.01) –0.02 (0.01) –0.01 (0.01)
Female 0.01 (0.01) 0.01 (0.01) 0.01 (0.01)*
Age 0.00 (0.00) –0.00 (0.00) 0.00 (0.00)
White –0.01 (0.02) 0.01 (0.02) –0.00 (0.01)
Black –0.00 (0.02) 0.02 (0.02) 0.01 (0.01)
Hispanic –0.00 (0.02) 0.01 (0.02) 0.00 (0.01)
Education 0.07 (0.01)* –0.02 (0.01) 0.03 (0.01)*
Married 0.01 (0.01) 0.00 (0.01) 0.00 (0.01)
Divorced –0.02 (0.01) –0.01 (0.01) –0.01 (0.01)
Widowed 0.04 (0.02)* 0.01 (0.02) 0.02 (0.01)
Student 0.03 (0.02) –0.01 (0.02) 0.01 (0.02)
Working 0.00 (0.01) –0.00 (0.01) –0.00 (0.01)
Retired 0.01 (0.01) 0.01 (0.01) 0.01 (0.01)
Party ID –0.02 (0.01) –0.02 (0.01) –0.02 (0.01)*
Ideology –0.02 (0.01) –0.03 (0.01)* –0.02 (0.01)*
Interest –0.02 (0.01) –0.02 (0.02) –0.02 (0.01)
Knowledge –0.03 (0.00)* –0.00 (0.00) –0.01 (0.00)*
n 2,229
Note.—Cell entries are linear regression coefficients with associated standard errors in paren-theses. Data from American National Election Studies 2008–2009 Online Panel.
*p < 0.05, two-tailed test
at Jordan University of Science and Technology on July 26, 2016
http://poq.oxfordjournals.org/
again show a negative relationship between NE and non-informative respond-ing. No other variable consistently explains these responses.6
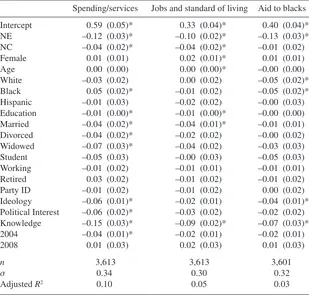
That NE but not NC is associated with non-informative responding suggests that such responses reflect deficits of evaluation, not deficits of cognitive effort or engagement on the part of respondents. This is further substantiated by the results of a nonequivalent outcome test (available in supplemental appendix 2), which examined whether NE affected DK responses to factual knowledge questions, not merely for opinion questions. These tests show, however, only modest differences in DK responses to factual questions attributable to NE. Their non-valenced attitude expressions seem to reflect something unique Table 2. Non-Informative Responding to Opinion Items, ANES 2000, 2004, 2008
Spending/services Jobs and standard of living Aid to blacks
Intercept 0.59 (0.05)* 0.33 (0.04)* 0.40 (0.04)*
NE –0.12 (0.03)* –0.10 (0.02)* –0.13 (0.03)*
NC –0.04 (0.02)* –0.04 (0.02)* –0.01 (0.02)
Female 0.01 (0.01) 0.02 (0.01)* 0.01 (0.01)
Age 0.00 (0.00) 0.00 (0.00)* –0.00 (0.00)
White –0.03 (0.02) 0.00 (0.02) –0.05 (0.02)*
Black 0.05 (0.02)* –0.01 (0.02) –0.05 (0.02)*
Hispanic –0.01 (0.03) –0.02 (0.02) –0.00 (0.03)
Education –0.01 (0.00)* –0.01 (0.00)* –0.00 (0.00)
Married –0.04 (0.02)* –0.04 (0.01)* –0.01 (0.01)
Divorced –0.04 (0.02)* –0.02 (0.02) –0.00 (0.02)
Widowed –0.07 (0.03)* –0.04 (0.02) –0.03 (0.03)
Student –0.05 (0.03) –0.00 (0.03) –0.05 (0.03)
Working –0.01 (0.02) –0.01 (0.01) –0.01 (0.01)
Retired 0.03 (0.02) –0.01 (0.02) –0.01 (0.02)
Party ID –0.01 (0.02) –0.01 (0.02) 0.00 (0.02)
Ideology –0.06 (0.01)* –0.02 (0.01) –0.04 (0.01)*
Political Interest –0.06 (0.02)* –0.03 (0.02) –0.02 (0.02)
Knowledge –0.15 (0.03)* –0.09 (0.02)* –0.07 (0.03)*
2004 –0.04 (0.01)* –0.02 (0.01) –0.02 (0.01)
2008 0.01 (0.03) 0.02 (0.03) 0.01 (0.03)
n 3,613
Note.—Cell entries are linear regression coefficients with standard errors in parentheses. Data from American National Election Studies 2000, 2004, and 2008 time-series studies.
*p < 0.05, two-tailed test
6. Additional robustness checks involved treating the responses to each survey question at both waves as a 16-wave panel and controlling for issue-fixed effects. The same results were found.
at Jordan University of Science and Technology on July 26, 2016
http://poq.oxfordjournals.org/
about how cognitive style interacts with opinion components of survey questionnaires.
On the ANES 2000, 2004, and 2008 surveys, fewer respondents offered non-informative responses to the selected opinion questions (see supplemental
appendix 3, table 3). Regressions of these responses on NE and other
fac-tors are shown in table 2. As is clear from the coefficients on NE, evaluative individuals were much less likely to provide a non-informative response on each of the three questions. While NC, political interest, and political knowl-edge sometimes shaped responding, these relationships were smaller and less consistent than the relationship between NE and non-informative responding. Thus, the results from the online panel are replicated, and the results here sug-gest that the effect of NE may vary across question formats.
Does NE Also Affect Opinion Extremity?
The results thus far suggest that NE strongly relates to whether a respondent provides a non-informative answer to opinion questions. One obvious follow-up question is whether NE also affects other types of survey responding, such as the extremity of reported attitudes. As NE measures underlying evaluative tendencies, it is plausible that NE is also related to the extremity of opinion self-reports because high-NE individuals are more likely to evaluate infor-mational stimuli consistent with their priors and thus develop more extreme positions over time (see, for example, Nir [2011]). Thus, we might expect that high NE is associated with more extreme responses.
To test for such a relationship, the extremity of attitude reports (from the same opinion questions already described) was regressed on the same set of covariates used in the previous analyses. On the 2000, 2004, and 2008 sur-veys, responses were “folded” so that middle-category responses were scored as 0 and the three response options on either side were coded 0.33, 0.67, and 1, respectively. For the online panel, the middle category (a non-informative option above) was excluded from the analysis and extremity of the remaining six response options were coded 0, 0.5, and 1, respectively. All “don’t know” and non-answers were removed from all data.
Supplemental appendix 4 reports the results for the online panel and the
time-series studies. In both cases, NE is associated with greater extremity of reported attitudes, among those reporting an attitude at all. In the online panel, high-NE respondents report attitudes about 9 percent more extreme than low-NE respondents (β = 0.09, SE = 0.01). For the three questions in the ANES 2000–2008 surveys, the analogous effects are 0.15 (SE = 0.03), 0.09 (0.01), and 0.13 (0.03). Indeed, NE stands out as the largest single predictor of atti-tude extremity in all cases.7
7. Additional analyses reported in supplemental appendix 4 further replicate these findings for the spending/services question used in the 1998 ANES Pilot Study.
at Jordan University of Science and Technology on July 26, 2016
http://poq.oxfordjournals.org/
Addressing Differences in Survey Responding
The results thus far suggest that those high in NE are more likely to offer opin-ionated responses, and when they do, those responses are more extreme than their low-NE peers. Low-NE individuals likely hold object-relevant beliefs in memory but simply lack the online summary necessary to quickly trans-late those beliefs into opinion responses, meaning that surveys systematically mask the views of many citizens. Different question wordings and response options might help reveal those beliefs; for example, removing explicit non-informative options may encourage low-NE respondents to provide a valenced response. But changes in response categories only affect response behavior on the margins, without addressing the underlying differences in psychology that make it difficult for low-NE individuals to formulate opinions. It is possible that if individuals are given time and explicit instructions to recall issue-rele-vant considerations from memory before attempting to formulate an attitudi-nal response, they may be less likely to provide a valenced attitude expression. To shed some light on that possibility, I turn to an experiment on survey responding from the 1987 ANES Pilot Study (Zaller and Feldman 1992;
Feldman and Zaller 1992).8 In one condition, respondents were asked to report
opinions on the three questions used on the ANES 2000–2008 surveys, as nor-mal. About one-quarter of the responses to these questions were DKs.9 In the
second “stop-and-think” condition, however, respondents were asked to first list considerations from memory, and then report their opinion. Only about 3 percent of responses in this condition were DKs.10 In each case, there is a
sub-stantial and statistically significant difference (p < 0.00). Though the survey lacks a measure of cognitive style, a comparison of these two conditions pro-vides a conservative test of how many more respondents choose informative response options under “stop-and-think” procedures.
Discussion
This paper has shown that those low in NE are more likely to say that they do not know or have no opinion about a political issue when asked during a survey interview. The reason for this is a lack of habitual evaluation of stimuli, a simple individual difference. Such responses mean that their voices—what-ever they may know, think, or believe about political issues—are hidden in the nonresponse categories of each question, discarded from aggregate estimates
8. The sample of 457 respondents was drawn from a knowledge-stratified sample of respondents to the 1986 ANES time-series survey, with a response rate of 72 percent. Telephone interviews were conducted between May and July 1987.
9. Percentages for each question were 29.0 percent (spending/services), 27.1 percent (standard of living), and 22.9 percent (aid to blacks).
10. Percentages for each question were 3.1 percent (spending/services), 2.6 percent (standard of living), and 3.0 percent (aid to blacks).
at Jordan University of Science and Technology on July 26, 2016
http://poq.oxfordjournals.org/
of public opinion. Evidence that NE is associated with more extreme responses raises additional questions about what public opinion estimates would be if low-NE individuals were not excluded in this way. Do they truly lack any issue-relevant beliefs? Or do their non-informative responses mask extreme or centrist beliefs? That high-NE individuals appear to have more extreme opinions means that aggregate opinion, including low-NE individuals, may be more centrist than it appears. Yet without giving low-NE individuals time and opportunity to formulate opinions in a memory-based fashion, we simply do not know. Invoking “stop-and-think” procedures may help create more inclu-sive estimates of public opinion, but more work is needed to ensure that the survey interview works equitably for all respondents.
Supplementary Data
Supplementary data are freely available online at http://poq.oxfordjournals.org/.
References
Bishop, George F. 1987. “Experiments with the Middle Response Alternative in Survey Questions.” Public Opinion Quarterly 51:220–32.
Bizer, George Y., Jon A. Krosnick, Allyson L. Holbrook, S. Christian Wheeler, Derek D. Rucker, and Richard E. Petty. 2004. “The Impact of Personality on Cognitive, Behavioral, and Affective Political Processes: The Effects of Need to Evaluate.” Journal of Personality 72:995–1027. Bizer, George Y., Jon A. Krosnick, Richard E. Petty, Derek D. Rucker, and S. C. Wheller. 2000.
“Need for Cognition and Need to Evaluate in the 1998 National Election Survey Pilot Study.” Technical Report, American National Election Studies Board of Overseers.
Cacioppo, John T., and Richard E. Petty. 1982. “The Need for Cognition.” Journal of Personality
and Social Psychology 42:116–31.
Chong, Dennis, and James N. Druckman. 2010. “Dynamic Public Opinion: Communication Effects over Time.” American Political Science Review 104:663–80.
Converse, Philip E. 1964. “The Nature of Belief Systems in Mass Publics.” In Ideology and
Discontent, edited by David Apter, 206–61. New York: Free Press.
Dahl, Robert A. 1971. Polyarchy. Chicago: University of Chicago Press.
Druckman, James N., and Arthur Lupia. 2000. “Preference Formation.” Annual Review of
Political Science 3:1–24.
Druckman, James N., and Thomas J. Leeper. 2012. “Learning More from Political Communication Experiments: Pretreatment and Its Effects.” American Journal of Political Science 56:875–96. Federico, Christopher M. 2004. “Predicting Attitude Extremity: The Interactive Effects of Schema Development and the Need to Evaluate and Their Mediation by Evaluative Integration.”
Personality & Social Psychology Bulletin 30:1281–94.
Feldman, Stanley, and John Zaller. 1992. “The Political Culture of Ambivalence: Ideological Responses to the Welfare State.” American Journal of Political Science 36:268–307. Holbrook, Thomas M. 2006. “Cognitive Style and Political Learning in the 2000 US Presidential
Campaign.” Political Research Quarterly 59:343–52.
Jarvis, W. Blair G., and Richard E. Petty. 1996. “The Need to Evaluate.” Journal of Personality
and Social Psychology 70:172–94.
Krosnick, Jon A. 1991. “Response Strategies for Coping with the Cognitive Demands of Attitude Measures in Surveys.” Applied Cognitive Psychology 5:213–36.
at Jordan University of Science and Technology on July 26, 2016
http://poq.oxfordjournals.org/
Krosnick, Jon A., Sowmya Narayan, and Wendy R. Smith. 1996. “Satisficing in Surveys: Initial Evidence.” In Advances in Survey Research, edited by Marc T. Braverman and Jana Kay Slater, 29–44. San Francisco: Jossey-Bass.
Lodge, Milton, Kathleen M. McGraw, and Patrick K. Stroh. 1989. “An Impression-Driven Model of Candidate Evaluation.” American Political Science Review 83:399–419.
Neuman, W. Russell. 1986. The Paradox of Mass Politics: Knowledge and Opinion in the
American Electorate. Cambridge, MA: Harvard University Press.
Nir, Lilach. 2011. “Motivated Reasoning and Public Opinion Perception.” Public Opinion
Quarterly 75:504–32.
Norpoth, Helmut, and Milton Lodge. 1985. “The Difference between Attitudes and Nonattitudes in the Mass Public: Just Measurements.” American Journal of Political Science 29:291–307. Sturgis, Patrick, Caroline Roberts, and Patten Smith. 2014. “Middle Alternatives Revisited: How
the Neither/Nor Response Acts as a Way of Saying ‘I Don’t Know.’” Sociological Research &
Methods 43:15–38.
Tourangeau, Roger, Lance J. Rips, and Kenneth A. Rasinski. 2000. The Psychology of Survey
Response. New York: Cambridge University Press.
Zaller, John, and Stanley Feldman. 1992. “A Simple Theory of the Survey Response: Answering Questions versus Revealing Preferences.” American Journal of Political Science 36:579–616.
at Jordan University of Science and Technology on July 26, 2016
http://poq.oxfordjournals.org/