JEJAK
Journal of Economics and Policy http://journal.unnes.ac.id/nju/index.php/jejak
Projection 0f Labor Needs and Productivity to Reduce
Unemployment
Lestari Agusalim1
1Faculty of Economics and Business, Trilogi University, Indonesia
Permalink/DOI:http://dx.doi.org/10.15294/jejak.v9i2.7631
Received: May 2016; Accepted: July 2016; Published: September 2016
Abstract
The purpose of this study is to estimate the amount of labor needs and productivity in Banten Province from 2016 until 2020. By estimating the needs and productivity of the labor, the government can use this information to create the appropriate policies in order to reduce the open unemployment rate (OUR) in Banten Province. According to BPS data in 2014, OUR of Banten Province was the highest among other provinces in Java and second highest in Indonesia after Maluku. This study used the quantitative method, which are the exponential and geometric methods to project the labor needs. Other than that, this study used the descriptive method to interpret the quantitative data. The result showed that (1) from 2016 until 2020 there will be an increasing condition of employment, (2) from 2010 until 2014, the highest labor productivity were from electricity, gas and water sector. However from 2016 – 2020, the highest labor productivity will be from financing, insurance, real estate, land, and business services. (3) The number of OUR is expected to decrease annually. Meanwhile OUR in 2016 which is 7.39 percent will decrease to 3.94 percent in 2020.
Keywords: projection, labor, unemployment
How to Cite: Agusalim, L. (2016). Projection 0f Labor Needs and Productivity to Reduce Unemployment. JEJAK: Jurnal Ekonomi Dan Kebijakan, 9(2), 297-310. doi:http://dx.doi.org/10.15294/jejak.v9i2.7631
© 2016 Semarang State University. All rights reserved
Corresponding author :
Address: Jl. TMP. Kalibata No. 1, Daerah Khusus Ibukota Jakarta 12760
E-mail: [email protected]
INTRODUCTION
The success of development in Banten Province especially in employment is determined by the availability of accurate information in estimating the number of Domestic Product (GRDP). Theoretically, when the ouput growth increase, the chance to increase the demand for labor and labor needs is also high.
Theoretically, demand is a relation between price and quantity. When we talk about a demand in a commodity, it is a relation between the price and the quantity of the commodity where the buyer is willing to pay for it. For the labor, demand is a relation between the wage level (perspective of an employer is the price of the labor) and the quality of the labor based on the employer request to be hired (being bought) (Bellante, 1990) considering the wage rate. It means that the labor needs is the number of labor that is required to produce a certain product in time without considering the wage factor (Suroto, 1992)
The demand for the labor by the employer is differentiated by the request of goods or service. People buy goods because it gives pleasure (utility) to the buyer. However the employer hires the employee to help producing goods or service to be sold to the consumer. In other word, the increasing
demand of labor by the employer depends on the demand of goods by people, which is called the derived demand (Simanjuntak, 1998)
The employer should determine the right combination (labor and goods/service) to get the maximum profit where additional income should be bigger than additional cost. The high number of labor is expected to increase the product, however, to increase it we should consider how much the profit we earn. Profit is the total earnings minus the total cost, so the profit earned by the additional casual worker is similar to the company income minus the income.
The demand for labor can be differentiated into two things based on the period:
First, a short run of labor demand. The function of the product shows the relation between the production input and the company output. With certain technology, the more the labor input and asset are, the bigger the output will be (Anata, 1990).
Second, a long run of labor demand. The differentiation in demand for labor is in a short term and a long term. In the long term, all the production input can chance. In the short term, the focus of discussion is the only input than can be changed.
the work offering determinant proxy. The labor supply can be differentiated into two things based on the time period:
First, a short run of labor supply. The number of the total labor provided by an economic matter depends on the number of population, the percentage of population who choose to join the labor force. From those three components, the total labor force offered depends on the market income (Arfida, 2003).
A short run means a certain period where there is no chance to make any adjustment and a number of situation that cannot be changed. The adjustments of working hour and on the labor force that will be discussed are the individuals in a region with a certain amount of size.
Second, a long run of labor supply. In the short term, an individual is assumed to not be able to change the human capital. Individual can only adjust their working hour. He is not able to improve the skills. In the long term, an individual can change the human capital. It is called investment in human capital. It is a sacrificing in the use of
market timing to improve a person’s certain skills. The sacrificing in the use of market timing means its willingness to decrease in the household production process. Investment in human capital can reduce the satisfaction of the present, although it is expected to increase the satisfaction in the future (Ananta, 1990).
The supply/demand of labor can be seen by calculating a projection in a population and labor force, such as Arithmetic Method, Geometric and Exponential. Those three methods are the simple method to create a planning in population and employment (Ananta, 1990
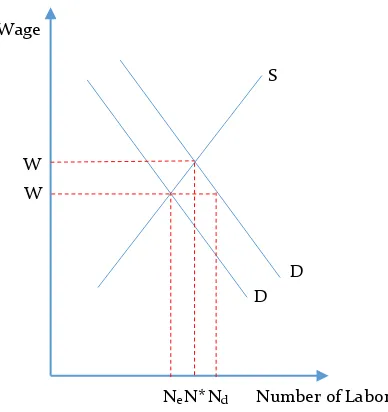
In the market labor, the demand for labor and the supply for labor determine the level of wage equilibrium and the usage of labor equilibrium. If D and S represent the starting demand and supply, the wage equilibrium level is We, and the total usage
of labor equilibrium is Ne that is determined
by the interaction of D and S. If the increasing of labor demand raise D, there will be an extra demand of labor Nd-Ne on
the level of labor usage N* (Bellante, 1990).
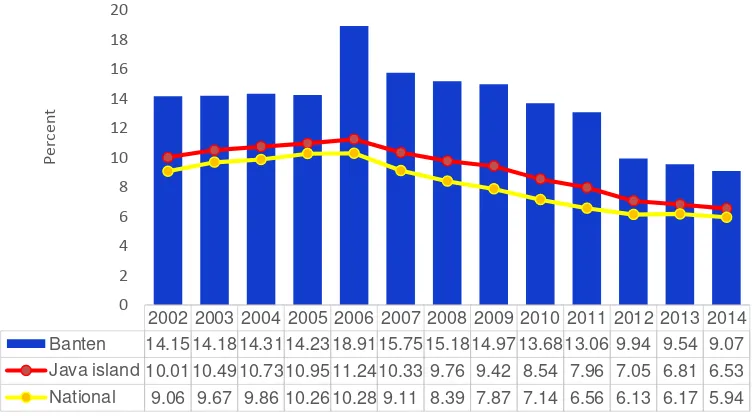
Figure 1. Open Unemployment Rate (OUR) in Banten Province, 2002-2014 Source: BPS-Statistics Indonesia, 2015 (data processed)
2002 2003 2004 2005 2006 2007 2008 2009 2010 2011 2012 2013 2014
Banten 14.15 14.18 14.31 14.23 18.91 15.75 15.18 14.97 13.68 13.06 9.94 9.54 9.07
Java island 10.01 10.49 10.73 10.95 11.24 10.33 9.76 9.42 8.54 7.96 7.05 6.81 6.53
National 9.06 9.67 9.86 10.26 10.28 9.11 8.39 7.87 7.14 6.56 6.13 6.17 5.94
0 2 4 6 8 10 12 14 16 18 20
Pe
r
ce
n
The movement of wage level raises the availability of labor, generally, the wage level should be higher to demolish the extra demand determined by the schedule of labor offering to the change of wage level by the household act and the company in which both are affected by the wage level (Bellante, 1990)
The theory above is useful to analyze the problem of employment in the province of Banten. As it is known, Banten Province is a new administration. It was established after the reformation era (2000). However, the labor issues in this province is quite serious, especially when we see it from the high number of unemployment and the level is increasing from time to time.
Unemployment is a problem that keeps haunting the developing and development country. The high level of unemployment not only will interfere the national stability but also the politic and economy stability. Every government in the world should try to decrease the unemployment.
According to the cause, there are several problems that considered as the cause of unemployment. According to Simanjuntak (1998) and et al., (2000) those are:
First, frictional unemployment. It happens because of the temporary difficulty in meeting the job seeker and job the habitat. And ot happens because the job seeker does not really know where the opportunity is and neither does the employer. This kind of employment is
temporary and the period for the unemployment can be cut by providing a complete work field information.
Second,structural unemployment. It happens because there is a structural change in economic. It causes the necessity to labor with certain level of skill. The effect of this situation causes the availability of the skills not suitable with the requirements. To solve it, we need an additional training program to suit the requirements. Generally, the period time to be solved is longer than the frictional unemployment.
Third, seasonal unemployment. It happens because of the seasonal exchange. As an example, we can take the farmers. Outside the planting season they become jobless until the next harvest season. In most cases, it does not get the spotlight.
In Banten Province, the condition of OUR in 2014 was 9.07% under Maluku Province with 10.51%. If we compare with OUR in the whole province in Java Island, during 2002-2014, Banten Province was on the highest position, as if we compare it with OUR nationally. The situation of OUR in Banten Province, Java Island, and the national OUR national during 2001-2014 can be seen on Figure 2. Regarding to this reality, the Banten Province administration needs to create a plan of labor for the future so OUR is decreasing rapidly, and no longer become an unsuited province.
Figure 2. Demand and Supply of Labor
There are several obstacles on the attempt to reduce the number of unemployment, both from internal and external. The internal factor comes from the employees who demand a lot of normative and non normative things, thus, it requires a guidance for the employees and the employer in order to create a conducive situation. The complicated regulations and the non conducive bureaucratic behavior for business world in national and regional level has become a problem in creating the expected job opportunity.
Meanwhile, the external factors that still become the problem in reducing the unemployment rate is the recent migration factor that enters Banten Province. The research was held by Azhar F, et al., (2013), which showed that there is a strong connection between the number of unemployment and the recent migration in here. The raising of unemployment rate in here since 2005-2010 was similar to the number of upcoming recent migration. The total unemployment in 2005 was 661,618 people, and during the same period the total of recent migration who entered Banten Province was 290,876 people. In 2010, the incoming data showed that the number of unemployment and the total of recent migration had risen by 726, 377 people and 465,080 people.
To understand the labor problems we need to collect the data about the condition of employment in this province. The data released by BPS in this province as seen on table 1, has given the image of situation of the employment for the past year. In August 2015 there were 5.34 millions of labor force. This number is quite similar with the same month in last year, just decreased by three thousands of people.
Table 1. Population Aged 15 Years and Over by Main Activity, 2014-2015
The Main Activity Unit 2014 2015
Feb Aug Feb Aug
Labor Force (000) people 5,479 5,338 5,697 5,335
Working (000) people 4,938 4,854 5,208 4,825
Unemployment (000) People 541 484 489 509
Not in Labor Force (000) people 2,764 3,024 2,771 3,236 Labor Force Participation Rate % 66.47 63.84 67.28 62.24
Open Unemployment Rate % 9.87 9.07 8.58 9.55
Less Than Normal Working Hours (000) People 939 991 964 886
Underemployment (000) People 306 389 280 313
Part Time Worker (000) people 633 602 684 573
Source: BPS-Statistics Indonesia, Banten Province, 2015
Number of Labor Wage
S
D D W
* W
The decreasing number of work force in August 2015 compared with the condition in Aug 2014 was followed by the decreasing industrial sector (24.84%) and trading, hotel and restaurant (24.66%). On the educational level view, the employment was dominated by the people with the low level of education, which are primary school (36.79%) and high school (18.58%). On the work status view, the number of workers who worked at the formal sector was 61.47%, meanwhile the number of workers who worked in the informal sector was 38.53% (BPS Banten Province, 2015).
Table 1 also shows that the number of unemployment was increasing 25 thousands of people to become 509 thousands of people in August 2015. The rising of OUR also can be seen from 9.07% (August 2014) to 9.55% in August 2015. The number of part timer (less than 35 hour/week) was decreasing August 2014 to August 2015.
The high level of unemployment is often associated with the low human capital. The lower of the human capital effects the high rate of the unemployment rate. The human capital theory was first introduced by Theodore W. Schultz in 1961. Schultz (1961) said that human is a form of capital as other matters, such as machine and technology. The human capital theory emphasizes that education, knowledge, health, and skills as a form of human capital.
In 1993, Becker (1993) developed the concept of Schultz idea, and said that human is not just a resource but also an investment
that generates the return and expense to develop the quality and quantity of human. The additional value within the human happens when the education and skills are useful for a company. Human capital is measured by the education and training.
Todaro (2000) said that human capital requirement to increase the productivity. Therefore, the education and health can be seen as a vital component in the development and growth, as an input for aggregating production function.
Mat et, al., (2015) investigated the relation between the human capital investment and the economic development in Sabah. The result showed that it had a positive trend. The human capital investment that emphasized the education, health and immigration could rapidly increase the economy through the labor productivity to pursuit the upper middle income nation in 2020. Tthe human capital investigation in education is able to raise the literacy level of additional education to increase the knowledge and skills.
matter to create the effective human resources planning because the purpose is not only to ensure that people work in a right place, at the right time, and in a right portion, but they are also ready to adapt in facing the different activity based on the demand for labor in the future. Therefore, the government needs to create a policy that suits the demand and supply for labor effectively to reach the development’s goals.
Based on the thoughts above, the purpose of this study are; (1) to estimate the job opportunity in Banten Province in 2016-2020, (2) to estimate the productivity of labor in Banten Province in 2016-2020, (3) to estimate OUR in Banten province in 2016-2020, and (4) to propose the following policies to reduce the unemployment rate in Banten Province.
RESEARCH METHODS
The data used in this paper is the secondary data that is collected from BPS Banten Province, Bappeda Banten Province, several literatures, the internet and other related department. The data consists of (1) GRDP of Banten Province (2) working-age population (PUK) (3) workforce (4) working population, and (5) open unemployment during 2010-2014. study is given by a simple shape of pictures, tabulation and graphic using SPSS V.23 software for Macbook, and Ms. Excel 2016 for macbook.
Analyzing the data uses two methodologies those are the exponential and geometric method. The exponential method is used to assume and predict the economic growth trend. This method is more appropriate because the GDP and GRDP data pattern at some province are following the exponential pattern. Meanwhile the geometric method is used to assumed and predict the population growth, working-age population, workforce participation rate, and workforce. In some employment research, most of the researchers use the geometric method to count the population projection, because to measure the population growth is followed by the geometric pattern.
The following is the exponential equations and geometric formulas to be used in this study:
P0 =The number of GRDP of Banten province
in the base year
R = Economic growth (indicator)
T = the time period between the base year and year t (in years)
E = cardinal number of the magnitude of the natural logarithm system is 2.7182818
P0 = The number of population/ labor force population’s needs using "Manpower Requirement Approach" is a method that estimates the employee’s needs to boost the certain economic growth. To estimate the needs of the working population or demand for labor uses the elasticity approach.
According to Simanjuntak (2001), the employment opportunity elasticity is the ratio of the rate of employment opportunity
N = The emount of employment opportunities Y = The emount of GRDP
i = The economic sector
The formula above can be used to calculate the growth of employment opportunity. According to Simanjuntak (2001), if the growth rate of employment opportunities is expressed by k and the PDRB growth rate is expressed as g, it can be formulated as follows:
𝑘 = 𝐸 𝑥 𝑔
Or the rate of employment opportunities growth (k) equals to the employment opportunity elasticity (E)
multiplied by the rate of GRDP growth (g). To determine the sectoral productivity:
𝑃𝑟𝑜𝑑𝑢𝑐𝑡𝑖𝑣𝑖𝑡𝑦 =𝐸𝑚𝑝𝑙𝑜𝑦𝑚𝑒𝑛𝑡 𝑂𝑝𝑝𝑜𝑟𝑡𝑢𝑛𝑖𝑡𝑦𝐺𝑅𝐷𝑃
The Labor force and the unemployment rate can be calculated using the following formula:
𝐿𝑎𝑏𝑜𝑟 𝐹𝑜𝑟𝑐𝑒 = 𝐿𝑎𝑏𝑜𝑟 + 𝑈𝑛𝑒𝑚𝑝𝑙𝑜𝑦𝑚𝑒𝑛𝑡 And the level of unemployment
𝑈𝑛𝑒𝑚𝑝𝑙𝑦𝑚𝑒𝑛𝑡 𝑅𝑎𝑡𝑒 study focuses on these two things.
in accordance with the demands of the working population.
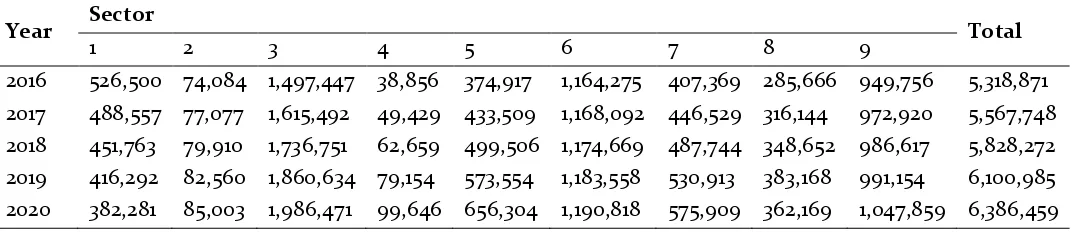
Calculating these projections of employee, it is assumed that the condition of the region in a state is permanent (ceteris paribus). It is estimated that the employment opportunity in 2016-2020 in Banten province will continue to increase, from 5,318,871 people in 2016, increasing into 6,386,459 people in 2020. The estimate shows that in 2016-2020 there were 1,067,589 additional employment opportunities, growing by 20.07% (see Table 2).
Based on each sector, the employment growth rate is on a positive trend in almost every sector, except for the agricultural. The agriculture, forestry, animal livestock, and fishery have decreased the employment opportunity by an average rate of -7.36 percent. The average growth rate in the minerals and mining is 3.86%, while in the
processing industry is 7.70%, and in the electricity, gas, and clean water is 26.99%. Meanwhile in the construction is 15.43%, and in the major industry, retail, restaurant, and hotel is 0.50%. Whereas in the transportation, warehousing, and communication is 9.43%, in the finance, insurance, property rental industry, land, and company services is 7.98%, in the social service, and individual is 2.86%.
The most accommodating sector for the labor force during 2016-2020 is the industrial sector, which is raised by 489,024 labor force. Proportionally, the industrial sector has become the most dominant sector during 2016-2020 with the proportion of 28.15% in 2016 and raise into 31.10% in 2020. it is quite enlightening, because in the future this sector is expected to be the major economic matter in Banten Province.
Table 2. The Projection Result of Employment Opportunity in Banten Province, 2016-2020
Year Sector Total
1 2 3 4 5 6 7 8 9
2016 526,500 74,084 1,497,447 38,856 374,917 1,164,275 407,369 285,666 949,756 5,318,871 2017 488,557 77,077 1,615,492 49,429 433,509 1,168,092 446,529 316,144 972,920 5,567,748 2018 451,763 79,910 1,736,751 62,659 499,506 1,174,669 487,744 348,652 986,617 5,828,272 2019 416,292 82,560 1,860,634 79,154 573,554 1,183,558 530,913 383,168 991,154 6,100,985 2020 382,281 85,003 1,986,471 99,646 656,304 1,190,818 575,909 362,169 1,047,859 6,386,459
Source: BPS-Statistics Indonesia, Banten Province, 2015 (data processed) Note:
1 Agriculture, forestry, livestock, and fisheries 2 Mining and quarrying
3 Manufacturing industry 4 Electricity, gas and water 5 Construction
6 Wholesale trade, retail trade, restaurants, and hotels 7 Transportation, warehousing, and communication
Labor Productivity
The labor productivity level is captured in the result of ratio between GRDP per labor. The productivity level is determined by the skills of the labor, the growing sector, and the number of worker. It is proven on the research by Rehman and Khalid (2013) about the impact of technical education towards the labor productivity showing that a high skill worker is able to increase the whole labor productivity, and so is the other side. It proves that the technical education helps in dealing with the low level of productivity because of the supply of the uneducated and unskilled workers.
Other than that, according to several literatures written by Kussriyanto (1993), Anoraga (1997), Umar (1999), Simanjuntak
(2001), Margono (2008) said that one of the influencial factor in the labor productivity is skill. Sari and Alfa (2014) said that productivity is highly affected by the human capital. Human capital is a qualitative dimension of human resources, such as skills and creativity, which will affect the ability of human productive. It is earned through the education, training and health. The analysis result shows that the human capital that involves the health and education is a significant factor to elaborate the variation of labor productivity.
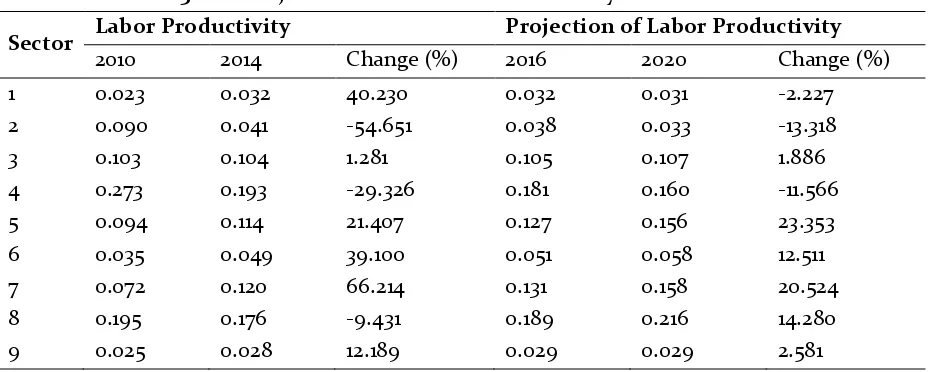
The labor productivity level during 2010-2014 and the projection of productivity level per sector in Banten Province during 2016-2020 can be seen in Table 3.
Table 3. The Projection Result of Labor Productivity in Banten Province
Sector Labor Productivity Projection of Labor Productivity
2010 2014 Change (%) 2016 2020 Change (%)
1 0.023 0.032 40.230 0.032 0.031 -2.227
2 0.090 0.041 -54.651 0.038 0.033 -13.318
3 0.103 0.104 1.281 0.105 0.107 1.886
4 0.273 0.193 -29.326 0.181 0.160 -11.566
5 0.094 0.114 21.407 0.127 0.156 23.353
6 0.035 0.049 39.100 0.051 0.058 12.511
7 0.072 0.120 66.214 0.131 0.158 20.524
8 0.195 0.176 -9.431 0.189 0.216 14.280
9 0.025 0.028 12.189 0.029 0.029 2.581
Source: BPS-Statistics Indonesia, Banten Province, 2015 (data processed) Note:
1 Agriculture, forestry, livestock, and fisheries 2 Mining and quarrying
3 Manufacturing industry 4 Electricity, gas and water 5 Construction
6 Wholesale trade, retail trade, restaurants, and hotels 7 Transportation, warehousing, and communication
During 2010-2014, from all the business field sectors, the highest productivity level is by electricity, gas, and clean water, but decreasing 29.32%, the lowest productivity level is by agriculture, forestry, animal livestock, and fishery, however during 2010-2014 increasing 40.23%. In the economy sector, the shipment, warehousing, and transport are on the highest productivity level by 66.1%.
From Table 3 it can be concluded that the highest productivity in 2016 to 2020 is on the financing, insurance, real estate, land, and business services, while the lowest productivity level is on the community, social, and personal services. According to the developing trend, in 2020 there will be a raise in the building sector by 23.53%, while the electricity, gas, and water are decreasing by 11.56%. The financing, insurance, real estate, land, and business services are increasing by 14.28%. The increasing in the financial sector is because the amount of labor in this sector is quite growing from the GRDP in the same factor.
In 2020 the community, social, and personal services show increasing productivity by 2.81%. The decreasing in productivity is also on the social services sector, social, and individuals, and also the minerals and mining by 2.27% and 13.31%.
To reach the optimal result in implementing the development programs both sectoral and regional, the crowd population in Banten Province can be used as a potential result for growing and developing the region development. Therefore, the supply for labor needs should be planned to eliminate the gap between the supply for labor and the small portion of job opportunity that is available.
Unemployment
The unemployment issue is a manifestation of the ineffective economic support, which is the job availability that has become the basic need for a society. Generally, it happens because of the rapid growing of population and the high level of labor force, while the job availability is still limited. In 2015 the working-age population and the labor force increased by 68,050 people and 44,586 people from the previous year with the rate of 0.80% and 0.83%. Meanwhile, the job opportunity raised by 29,988 people. As a matter of fact, during 2010-2014, the unemployment rate decreased every year (BPS, 2015).
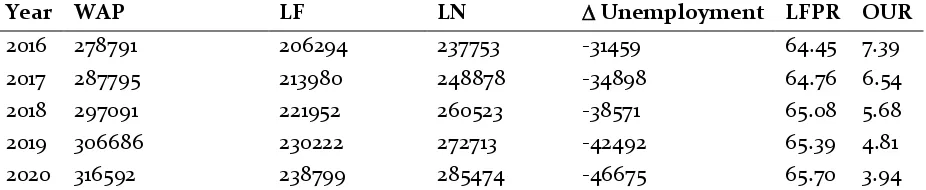
The OUR in Banten Province during 2016-2020, is estimated to keep decreasing. Table 4 shows that in 2016 the number of OUR is estimated by 424,353 people, decreasing 31.459 people from the previous year with OUR level of 7.39%. This number is estimated to be decreasing significantly in 2020, into 261.716 people, decreasing 46,675 people from the previous year with the unemployment level of 3.94%. If this projection is reached in 2020, then Banten Province is taking the significant increasing in developing the human resources so it can enter the labor market. It happens because the job availability rate is higher than the labor force rate. It is estimated that the labor force hiring during 2016-2020 is 4.43%, while the labor force rate is 3.38%.
manufacturing, major industry, retails, restaurant, and hotel, and the social services, social, and individuals.
On the labor view, the discussion will talk about elaborating the amount of labor, which is the number of people that are available, capable, and willing to work without considering the other factors such as population and its growth, distribution, education, etc. The growth of working-age population (WAP) is 3.23%. The growth rate of labor force is 3.37%. The growth of demand for labor (unhandled labor force) is 4.68%.
In 2020 the number of labor force is raising into 238,799 people with the labor force participation rate (LFPR) by 65.70%, the channeled labor force raise by 285,474 people and the unemployment decrease into 46,675 people. If we see it from the growth of WAP side, it is more rapid than the labor force, channeled labor and the job seekers.
Policy Recommendations
The expansion policy and the employment creation have to be made by the government to reduce the unemployment, through creating a conducive business climate. It needs to be developed in harmonious, cohesive, and supportive
condition to expanse and create the productive and remunerative job opportunities. Some of the programs are: (1) creating the job opportunity through investment. A research by Prasetyo (2008) stated that to accelerate the quality growth pace, it needs (1) supporting by the improvement of business and the investment climate, such as the investment of human capital, social capital, IT, infrastructure improvement, law enforcement and bureaucratization investment, (2) renewing the employment opportunity expansion through micro-credit, SME development, and human resource training, (3) providing the accurate job market by optimizing the online job opportunity, (4) developing the regional potential, competitive product and utilization of natural resources through the development of creative economic, (5) providing the basic infrastructure that sustains the business world, (6) cutting the bureaucracy in license procedure and business management by the principle of transparency and good governance, (7) improving the SME access to the productive resources, and (8) improving the quality of human resources based on the sector of the business.
Table 4. the result of projection of the Working-Age Population (WAP), Labor Force (LF), Labor Needs (LN), Labor Force Participation Rare (LFPR), and Open Unemployment Rate
(OUR), 2016-2020
Year WAP LF LN Unemployment LFPR OUR
2016 278791 206294 237753 -31459 64.45 7.39
2017 287795 213980 248878 -34898 64.76 6.54
2018 297091 221952 260523 -38571 65.08 5.68
2019 306686 230222 272713 -42492 65.39 4.81
2020 316592 238799 285474 -46675 65.70 3.94
CONCLUSION
Based on the study above it can be concluded that (1) it is estimated that the job opportunity in 2016-2020 in Banten Province will keep increasing from 5,318,871 people in 2016 to 6,386,459 people in 2020. That estimation shows that during 2016-2020 there is 1,067,589 additional job opportunities or it grows 20.07%. The most accommodating sectors are the processing industry and major industry, retail, restaurant, and hotel 0.50 %; (2) during 2010 – 2014 those who work at the electricity, gas, and clean water industry are the ones who have the highest labor productivity. However, during 2016-2020, those will work in the finance, insurance, and property rental industry, land, and company services; (3) the number of OUR in Banten Province during 2016-2020 is estimated will be decreasing into 261.716 people in 2020. The OUR in 2016 is 7.39% decreasing into 3.94% in 2020.
This study is expected to provide information about the employment condition in Banten Province in the future to those interested parties. Based on this study, it is important for the government and the related institutions to create a policy to reduce the OUR level in Banten Province. Through an effective policy, the unemployment rate is expected to decrease, and the prosperity of the society is expected to increase.
REFERENCES
Ananta. (1990). Ekonomi Sumber Daya Manusia. Jakarta. Fakultas Ekonomi Universitas Indonesia.
Anoraga, P. (1997). Manajemen Bisnis. Cet1. Jakarta. Rineka Cipta.
Anyadike, NO. (2013). Human Resource Planning And Employee Productivity In Nigeria Public
Organization. Global Journal of Human Resource Management, Vol. 1, No. 4, pp: 56-68.
Arfida. (2003). Ekonomi Sumber Daya Manusia. Jakarta. Ghalia Indonesia.
Azhar F, dkk. (2013). Pengaruh Pertumbuhan Penduduk dan Ketersediaan Tenaga Kerja Terhadap Jumlah Pengangguran Di Provinsi Banten. Fakultas Teknik Universitas Diponegoro.
Badan Pusat Statistik. (2015). Banten Dalam Angka. BPS Provinsi Banten. Banten
Becker, Gary S. (1993). Human Capital, A Theoretical and Empirical Analysis with Special Reference to Education. Third Edition. The University of Chicago Press.
Bellante, DMJ. (1990). “Ekonomi Ketenagakerjaan”. Jakarta. Fakultas Ekonomi Universitas Indonesia.
Kussriyanto, B. (1993). Meningkatkan Produktivitas Karyawan. Seri Manajemen No. 95. Jakarta. PT. Pustaka Binaman Pressindo
Margono. (2008). Pengaruh Motivasi, Efikasi Diri (self efficacy),Beban Kerja dan Keterampilan (skill) Menulis terhadap Produktifitas Buku Kerja Dosen. Jurnal Aplikasi Manajemen: Vol 6, 351-356.
Mat Na., Kasim Mansur., Roslina Mahmud. (2015). The Relationship between Human Capital Investment and Economic Development in Sabah. Malaysian Journal of Business and Economics, Vol. 2, No. 1, pp: 83-107.
Prasetyo, PE. (2008). The Quality Of Growth: Peran Teknologi dan Investasi Human Capital Sebagai Pemacu Pertumbuhan Ekonomi Berkualitas. JEJAK Journal of Economics and Policy, 1 (1): 1-15.
Rehman A., Khalid M. (2013). Impact of Technical Education on the Labor Productivity. International Journal of Economics, Finance and Management, Vol. 2, No. 7, pp: 462-471. Sari, E., Alfa Farah, A. (2014). Modal Manusia dan
Produktivitas. JEJAK Journal of Economics and Policy, 7 (1): 22-28 doi: 10.15294/jejak.v7i1.3840. Schultz, TW. (1961). Investment in Human Capital. The
American Economics Review, No. 51.
Simanjuntak., PJ. (2001). Pengantar Ekonomi Sumberdaya Manusia. Jakarta. Fakultas Ekonomi Universitas Indonesia.
Suroto. (1992). Strategi Pembangunan dan Perencanaan Kesempatan Kerja. Yogyakarta. Gadjah Mada University Press.
Susanti H, dkk, (2000). Indikator-Indikator Makroekonomi Ed. 2. Jakarta. Fakultas Ekonomi Universitas Indonesia.
Todaro, M.P., (2000). Pembangunan Ekonomi di Dunia Ketiga (H.Munandar, Trans. Edisi Ketujuh ed.). Jakarta: Erlangga.