Inter-State Internal Migration: State-level Wellbeing as a Cause Abstract
The relationship between subjective wellbeing and in-migration is explored in this paper. The wellbeing of a state is considered an incentive for in-migration to that state as the wellbeing in that state increases. A cross-sectional, multiple regression on the contiguous states in the United States was used to determine if there is any relationship. A significant and positive relationship was found between state-level subjective wellbeing and net in-migration when controlling for economic and non-economic variables typically associated with in-in-migration. The positive relationship indicates that as a state’s wellbeing increases its appeal as a destination for internal migrants increases as well. It is recommended for policymakers to focus on improving the subjective wellbeing of their state’s residents not only to retain and attract new residents, but as a general measure of successful administration. Future studies are needed to verify the link between a state’s wellbeing and in-migration to that state. This study serves as a first step in this literature.
Keywords:
Internal migration, Subjective wellbeing, Migration incentives, State-level wellbeing, State net in-migration Introduction
A distinction needs to be made between happiness or wellbeing, a more comprehensive and broader expression of happiness, and utility. Utility is measured by individual preferences (Frey & Stutzer 2000). In regards to happiness, utility is defined by average happiness and the length of life of people. Much like general happiness, utility is about making people happier with a focus on the choices that improve net happiness (Brϋlde 2010). The main difference between utility and general happiness is the inclusion of both pecuniary aspects such as income and non-pecuniary aspects such as job satisfaction (Easterlin 2003). Veenhoven (2000) labels the differences as objective and subjective wellbeing. Objective wellbeing is related to income and subjective wellbeing is related to one’s state of mind.
wellbeing scales as a measure of progress. Some countries have even adopted it as a measure of success for governmental policies such as Bhutan and its Gross National Happiness scale.
There are some challenges to measuring subjective wellbeing, however there have been some very comprehensive measures of it such as the Gallup-Healthways Wellbeing Index, which interviews at least 1000 random adult respondents across the fifty states and different congressional districts on a daily basis. It is one large index composed of six smaller indexes. These indexes measure life evaluation, emotional health, physical health, healthy behavior, work environment and basic access. The life evaluation index captures the evaluation of the respondents’ present life situation and the respondents anticipated life situation five years from the time of the survey. The emotional health index asks about the respondent’s thoughts about the day before on various indicators of emotional health such as whether they were treated with respect or if they were happy or sad. The physical health index gathers data on estimates on BMI, disease burdens, sick days used and physical pain amongst other factors. The healthy behavior index similarly captures the effects of health on the wellbeing of a person through responses on lifestyle habits such as smoking and eating right. The work environment index includes feelings and perceptions about the respondent’s work environment such as satisfaction with their work. The basic access index is concerned with satisfaction with the community, access to clean water, the feeling of safety and access to adequate levels of money for food and shelter as well as access to health insurance amongst other factors (Gallup-Healthways 2009).
It is not difficult to imagine how state-level policymaking in the United States can have an impact on most of the indexes covered in the Gallup-Healthways Wellbeing Index. Some states have committed to anti-smoking campaigns and encouraging their population to eat right. States also have power over access to medical care through state-level policy control over Medicaid and other forms of health insurance. State legislation can also impact the work environment both public and private through regulations that impact benefits, pay, etc. States also contribute significant funds to their local governments to improve public safety and clean water in addition to state-level efforts in these areas. In essence, states in the United States have a lot of control over those areas that have been considered critical to improving individual wellbeing so there can be some differences between states on individual wellbeing.
income or property for the most part and require a critical mass of population particularly those in the middle to upper income brackets to sustain services to the population. A loss in population, especially the middle class since the bulk of the population is in this class category, would signal a fiscal dilemma where the costs of service
provision rarely adjust to a declining population. This also signals a growing percentage of those who are poor who are unable to migrate and who require greater services. The problem becomes self-reinforcing when population loss fuels more population loss in which state decision-makers become more constrained in the choices available to them to address the problems.
Traditionally, government in the United States at all levels has assumed that the key to wellbeing is purely economic. In this regards, migration to one state or another would be based on the economic benefits received from the migration i.e. better net income per capita. In general, the literature on internal migration in the United States has focused on this cause, however it has also included non-pecuniary aspects as well (Cebula & Nair-Reichert 2012; Ashby 2007; Conway & Houtenville 2003; Reisinger 2003; Davanzo 1978; Treyz, Rickman, Hunt &
Greenwood 1993; Cebula 2005; Cebula 2002; Cebula 1975; Poston Jr., Zhang, Gotcher & Gu 2009; Newbold 1996; Cullen & Levitt 1999). Most of the literature focuses on utility-maximization as the primary motivator for a person to move from one place to the next. The assumption behind utility-maximization is the increase in income is the primary motivation for moving from one place to another. In this case, migration from one state to another would purely be because of an increase in income which would come from the move which would increase the utility of that person which would translate into more happiness. In this regard, happiness is based on improved job prospects and wage-earning potential.
The relationship between subjective wellbeing and internal migration decisions is currently unknown. It is assumed that individuals aim to improve their general wellbeing and at the same time compare their wellbeing with others. Further it is assumed that individuals pursue wellbeing to the extent that they are willing to relocate to be in an area that will maximize their wellbeing. These internal migration decisions could relocate them across town, across county lines or state lines. This study is a state-level analysis on subjective wellbeing as an incentive for internal migration decisions. It is assumed that as a state’s wellbeing increases it attracts others who migrate to that state.
This article combines two literary traditions, the literature on wellbeing and the literature on internal migration. As previously covered, much of the literature on internal migration attributes migration decision-making to economic factors such as income and employment and non-economic factors such as quality of life. Wellbeing as a cause for migration fits relatively well between the economic and non-economic factors as wellbeing is often measured by income and quality of life indexes. In this article wellbeing is considered a non-economic cause for migration. This paper is an exploratory study on an under-researched topic in the internal migration and
wellbeing/happiness literature.
The following section is a summary of the literature on the causes of internal migration in the United States as well as the definition of wellbeing and the potential relationship between migration and wellbeing. The next section is a description of the design used in this study including how the key variables were measured, the
timeframe, the selected model, diagnostics and methods of interpretation. The section that follows this is the results section which report on the regression statistics. Lastly, a discussion section is included to discuss the meaning of these results and the need for further research in this area and a conclusion section summarizes the findings and the discussion.
Literature Review
Pierson (1954 / 2011) outlined the mobility of the American people in which it has come to be one of the defining characteristics of American culture. In his essay he explained the many reasons why Americans move from one place to another. One of the reasons he cited is because, “movement means improvement” (Pierson 1954 / 2011, 97). Even in the 1950s he pointed out that because the United States has developed into a society where information flows freely between people informed decisions on the best place for them can be made while people have the freedom to migrate there.
The free access of information on potential destinations for migrating people is crucial in economic and non-economic rationales for migration. In the United States today information on potential destinations throughout the country is readily available in the age of big data. Along with big data many have attempted to condense this information into readily understood indexes like the Gallup-Healthways Wellbeing Index. Another example is the Freedom in the 50 States Index which considers overall freedom, not just economic freedom (Ruger & Sorens 2011).
The decrease in the prevalence of economic factors could be in response to an increasing homogeneity between locations on these factors. Rhode and Strumpf (2003) found in their study of the differences in taxation between cities and counties over a 140 year period ending in 1990 that the level of heterogeneity between them has decreased substantially. These are differences between cities and counties which are more apt to be different across the country than between states.
An increase in homogeneity also could have been accompanied by a cultural shift in which shared norms and beliefs have led potential migrants to consider the information reaching them from the web or from networks differently either because of that information or because of their own shift in preferences (Boswell 2008). Slowly, there has been a realization that migration for non-economic reasons is starting to play a larger role such as when Ruger and Sorens (2011) conclude in their study of the effects of overall freedom and net internal migration, “the most plausible interpretation is that Americans in general are indeed attracted to freedom for its own sake, not just for the economic benefits” (18).
This leads to the discussion on how the reported subjective wellbeing of a state’s residents may induce others to migrate to that state. In the Gallup-Healthways measure there are questions on life satisfaction, emotional happiness, health and healthy behaviors, and contentment with one’s work and community. In this survey there is a comprehensive view of happiness/wellbeing that includes both short-term and long-term happiness. This survey is also primarily focused on non-pecuniary causes of happiness.
The impetus to migrate to a place for any reason does not mean that a person or family will relocate there. As uncovered in the migration literature there are a large number of reasons for relocating to a place and there are impediments to migration such as the cost in migrating. Migrants themselves may also be a self-selected group of people in which any discussion of migration is confined to a discussion of individuals who possess a certain characteristic that leads them to migrate more than others. Besides these issues, it cannot be ignored that within migration theory people, whether self-selected or not, will chose a location because it offers an improvement over the current location. The bulk of this research has rested on economic improvement, but at the core is the belief in utility-maximization and the accompanying happiness. The beliefs on happiness have shifted widely to non-pecuniary causes so has the beliefs on the causes of migration. It is not a leap within this framework to propose that people will choose to migrate to a place that will maximize their wellbeing. The Gallup-Healthways indicators on wellbeing simply report on what many may be aware of through their information networks. The life in a particular state may be perceived as good. Possibly it was a tv show, a friend who visited or is living there, a story in the news, or the Gallup measure itself that motivated people to relocate there.
One study by Nowok, van Ham, Findlay and Gayle (2013) asked if migration brings higher levels of subjective wellbeing. The authors note that, “from a theoretical perspective, incorporating subjective wellbeing in an explanation of migration decision-making can still be encompassed within a utility-maximizing framework” (Nowok et.al. 2013, 987). They assumed that by migrating there is a perceived increase in quality of life and happiness. The authors looked at before and after migration subjective wellbeing scores to determine if there were any substantial increases in actual subjective wellbeing from the move across communities in the United Kingdom.
Nowok et.al. (2013) found that migrants were actually less happy than non-migrants in which their unhappiness increased the more times they migrated. They found that the happiest migrants were those aged 23 to 40 and added that, “the higher subjective wellbeing of migrants at the most mobile ages, which drives the happiness of the whole population, suggest a positive impact of changing place of residence, at least in the short term” (Nowok et.al. 2013, 993). Further, the authors found that job related moves lead to happier people while the longer the distance the happier the people also. It also appears that migration plans tend to boost happiness prior to the move, but after the move it stagnates.
wellbeing score amongst its residents. It is assumed that a state with a higher subjective wellbeing amongst its residents will attract others who are seeking to maximize their wellbeing. The comparison theory of happiness applies the most to this study. The comparison theory applies because residents in one state with a lower subjective wellbeing will compare themselves with other residents in other states who have a higher subjective wellbeing. Those with higher wellbeing will represent how life should be and create incentives for those outside that state to relocate there. As noted by Nowok et.al. (2013), the very idea of relocating increases the happiness of the migrants even before migration. It is assumed that this happiness increases substantially when considering relocation to a state with a higher wellbeing. Further it is assumed that people wish to capitalize on this happiness by relocating to these places.
States have an incentive to increase net in-migration because of the relationship between population and economic development and state government fiscal stability. A miserable state will only increase out-migration and deter in-migration. It is no coincidence that the State of West Virginia, for example, has one of the largest levels of out-migration and at the same time has the lowest scores on the Gallup-Healthways Wellbeing Index. Many of the cities in West Virginia are shrinking cities and not coincidently they are also fiscally-stressed. The relationship between population and governmental fiscal health has been established in the literature for a long time (Bradbury, Downs & Small 1982; Henderick 2004). In addition population loss has been associated with increases in crime, declines in housing values, decreases in quality of life and increases in public service costs (Harries 2004; Schilling & Logan 2008; Rousseau 2009; Hollander 2010; Accordino & Johnson 2000; Winthrop & Herr 2009; Moss 2008). In this case states and their local governments have an incentive to retain the population that they have while attracting new people. It is not assumed that improving wellbeing will be the only thing that states need to do, but it should be part of their approach besides the obvious moral reasons to do so.
Study Design
The discrete rating scale is one of the weaknesses of the subjective wellbeing measure. There are also problems with different measures of happiness having differing effects on outcomes depending on the definition used (Borooah 2005). There are also cultural differences when answering the subjective wellbeing questions which could hurt the validity of the instrument. There are also concerns over whether the questions asked are
comprehensive enough to capture wellbeing.
The Gallup-Healthways Wellbeing Index is one such index that attempts to be as comprehensive as possible incorporating multiple questions to capture both positive affect and life satisfaction. The index is based on
telephone interviews of at least 1000 random adult respondents across the fifty states and different congressional districts on a daily basis. It is one large index composed of six smaller indexes, life evaluation, emotional health, physical health, healthy behavior, work environment and basic access. Due to the comprehensiveness of the index it is the most descriptive of subjective wellbeing and it is used as the explanatory variable of interest in this study (Gallup-Healthways 2009).
There are different ways to measure in-migration, but most studies use net in-migration. Ruger and Sorens (2011) used net internal migration by state for the years 2000 to 2009 over the population in 2000 for their study on the effects of total freedom on in-migration. Treyz et.al. (1993) used net economic migration which removes non-economic migrants from their study of the expected wage on in-migration. Cebula (1975) used net migration in which he simply subtracted out-migrants from in-migrants in his study of quality of life influences on net migration. Conway and Houtenville (2003) used net inflows which is the same as net in-migration in their study of age groups and migration. They also used gross migration flows as well. Johnson, Voss, Hammer, Fuguitt and McNiven (2005) used expected births / deaths and compared this with the Census data for that year in which they divided the actual population by the expected population in their study of the patterns of migration based on age, spatial and functional characteristics. Poston Jr. et.al. (2009) measured in-migration as in-migration for a certain period minus out-migration during the same period as a percentage of state population in the beginning of this period for their study of the effects of climate on net in-migration.
The net in-migration score used by Poston Jr. et.al. (2009) is used in this study. The reason that this measure was selected is because it appears to be similar to other measures used by other studies in which
used this measure in a state-level, cross-sectional multiple regression which is the design of this study. This variable serves as the outcome variable in this study.
One research question is of primary importance in this article. Does the reported subjective wellbeing of a state attract more in-migrants as measured by net in-migration? It is hypothesized that as a state’s subjective wellbeing score increases so does the level of in-migration to that state. This hypothesis is rooted in the migration literature in which the quality of life influenced by the natural environment or state-level policy decisions has a positive effect on in-migration to those states that capitalize on these wellbeing indicators. This paper does not distinguish between natural or human-induced quality of life factors however there is an assumption that policy decisions do have a large influence on these factors. It is further assumed in this paper as discussed in the literature that the impetus to relocate to a state because of perceived improvements to personal wellbeing is based on the free flow of information and social networks in which people are able to compare their own wellbeing in the current state with those in another state. This is based on the comparison theory of happiness discussed in the literature.
The average subjective wellbeing scores from the Gallup-Healthways Wellbeing Index for a state between the years 2008 and 2010 are used in this study (Gallup 2010). The survey started in 2008 and in-migration data for 2010 are used here. The net in-migration measure used by Poston Jr. et.al. (2009) is used in this study. In-migration from 2005 to 2010 is subtracted by out-migration for the same period and divided by the state population in 2005. State migration data are available through the Census (United States Census 2010; United States Census 2005). In-migration serves as the dependent variable and wellbeing as the independent variable.
The number of states used in this analysis is 48, not including Alaska and Hawaii. Poston Jr. et.al. (2009) and Cebula (1975) excluded these states because of their unique location vis-à-vis other states. Migrating from Hawaii and Alaska has unique challenges that migrating from Pennsylvania or any other contiguous state does not have when moving to another state. Due to these unique challenges the states were excluded from this analysis.
of analysis is ubiquitous in the migration literature. As discussed in the literature review, Cebula and Nair-Reichert (2012), Poston Jr. et.al. (2009), Ruger and Sorens (2011) and Ashby (2007) cited in this paper, for example, all approached the subject of in-migration utilizing this same methodology. The relationship between perceptions of improvements to personal wellbeing by migrating to another state that is perceived as a state that maximizes wellbeing within its borders would require either a panel or time-series model with assumptions of non-linearity for more confidence in these results. Theoretically, the relationship between state-level wellbeing and net in-migration explored in this paper may be linear in the short term, but curved in the long term. This is explored in more detail in the discussion section.
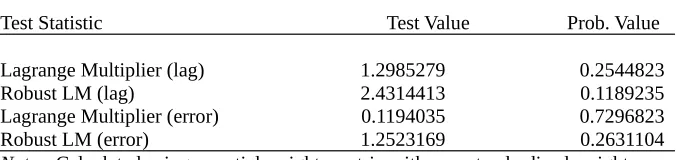
The issue of spatial correlation was also tested on the dependent variable to determine the correct model since a cross-sectional study would potentially bias results from unobserved economic and policy conditions. A Lagrange Multiplier and Robust Lagrange Multiplier were calculated for spatial lag and spatial error using the open-source software Geoda™. The LM test is considered a more optimal test of spatial lags and errors. It was found that none of the values were significant at the .10 level for any of the tests for either the spatial lag or spatial error model indicating that there were no problems with spatial correlation in the data necessitating a maximum likelihood or instrumental variables estimator (Kalenkoski & Lacombe 2008; Gibson, Kim & Olivia 2011). The results of these tests can be found in table 1.
A number of control variables were introduced based on the migration literature. State-level
unemployment rate, housing price index score, income per capita, violent crimes per state, the number of 18 to 44 year olds per state (thousands), the number of 65+ year olds per state (thousands), percent of state population with a college degree, percent of state population that is African American/White/Latino/Asian, and the amount of
spending per state (billions) were used as controls. Data for the demographic, spending, housing price, college attainment and age variables are from the U.S. Census. Data on unemployment are from Bureau of Labor Statistics and per capita income data are from the U.S. Department of Commerce. Violent crime data are from the Federal Bureau of Investigations.
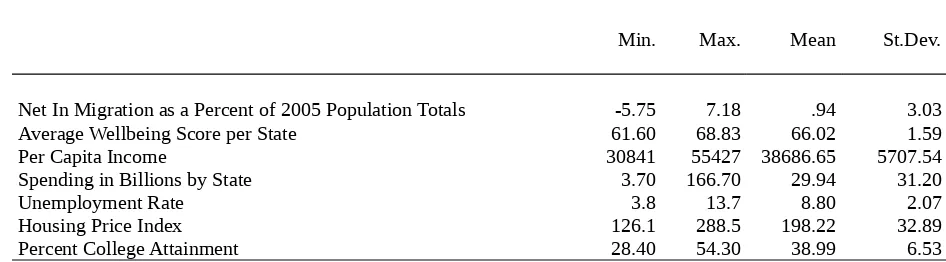
The descriptive statistics for the control variables and the dependent and independent variables can be found in tables 2 and 3.
The net in-migration ranged from -5.75 percent of 2005 population levels to 7.18 percent of 2005
population levels. The average wellbeing score ranged from 61.60 to 68.83 indicating a lower level of variation on the wellbeing score than the in-migration / out-migration percent. The lower the wellbeing score the lower the wellbeing in that state.
Some of the control variables also displayed non-normal characteristics necessitating transformation. Income per capita, spending per state, number of 18 to 44 year olds, percent college attainment, percent Latino, percent Asian and violent crimes per state were logged due to normality issues. The percent African American was taken at the square root also due to normality issues. In addition, most of the control variables were highly
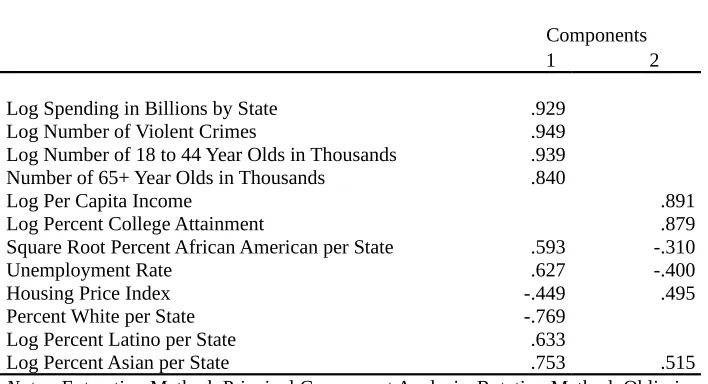
correlated creating a problem with multicollinearity. Instead of removing some of these variables from the analysis new variables were created through a principal components analysis. The purpose of this analysis is to take collinear variables and, “reduce them to a subset of uncorrelated factors” (Field 2013, p. 674).
The variables that were included in the principal components analysis are log of spending by state, log of violent crimes, log of the number of 18 to 44 year olds (thousands), the number of 65+ year olds (thousands), log per capita income, log percent college attainment, square root of percent African American, log percent Latino, log percent Asian, percent White, unemployment and the housing price index. These 12 variables factored into two components. The first component can be labeled demographics, spending and unemployment. The variables that loaded into this component are log of spending by state, log of violent crimes, log of the number of 18 to 44 year olds, the number of 65+ year olds, square root of percent African American, percent White, log percent Latino, log percent Asian and unemployment. All of them loaded positively into this component except percent White per state. The second component can be labeled income, education and housing. The variables that loaded into this
component are log per capita income, log of percent college attainment and the housing price index. All these variables had positive relationships. These two components serve as new variables in the multiple regression. Table 4 has the individual scores of each variable on each component.
of the non-redundant residuals were above .05 which indicates that there may be a problem with model fit (Field, 2013).
In summary, the variables used in the multiple regression on net in-migration as a percent of 2005 population levels (In-Migration) are the average wellbeing score per state (Wellbeing), the income, education and housing factor (Factor 1), the demographics, spending and unemployment factor (Factor 2) and average net migration (Migration). The model with these variables is represented in mathematical form below. The notation s represents each individual state.
In-Migrations = α0 + β1 (Wellbeing)s + β2 (Factor 1)s + β3 (Factor 2)s + β4 (Migration)s + εs
Results
The statistical program SPSS v. 22 was used to calculate the results of the model. This program produces various statistics in which the standardized and unstandardized betas (b) are the primary focus of the results. The unstandardized betas are the raw effects on the dependent variable by increasing the independent variable by one unit while holding the other variables constant. The standardized betas (β) are the effects in standard deviations on the outcome variable by a one standard deviation change in the predictor while holding the other predictors constant. The standardized betas are more comparable to each other than the unstandardized betas.
The wellbeing score used in this analysis is significantly and positively related to net in-migration at the .10 probability level. The unstandardized beta in table 5 shows that as the wellbeing score increases by one the net in-migration increases by .71 percent of 2005 population totals for that state. This indicates that as a state’s wellbeing score improves the level of net in-migration increases for that state.
Only one of the two factors is significantly related to net in-migration. The factored variable
demographics, spending and unemployment (Factor 2) is significant at the .01 level and negatively related to net in-migration. Past migration streams represented by the average net migration to a state was also significant at the .10 level and positively related to net in-migration. In both of these cases the direction of influence on the outcome variable was expected based on the literature.
impact on the dependent variable while being less significant. Average net migration was slightly lower in its impact on the dependent variable and also significant at the same level as wellbeing.
Discussion
As discussed in the literature review of this paper, there is a limited focus on the effects of subjective wellbeing on migration. Nowok et.al. (2013) explained that subject wellbeing can be a catalyst for moving and the desire to improve it. Their research was on the post-migration effects on wellbeing and mostly assumed that those that moved sought to improve their wellbeing. The research in this paper sought to explore whether that was truly a catalyst for moving using the comparison theory of happiness as the basis for that assumption. Rebhun and Raveh (2006) on the other hand were more clearly interested in the reasons for moving from one place to another and found that quality of life factors like inequality, education, medical care and crime (objective measures of wellbeing) were a catalyst for migration into or out of a place.
This study is unique by approaching wellbeing utilizing a subjective wellbeing score. The migration literature has included objective aspects of wellbeing / quality of life as a cause of in-migration / out-migration for some time and the results of these studies are in line with the results of this study. Some of these factors
representing the quality of life in a place have focused on the environment such as temperature and climate. Some of these factors have also focused on the effects of government policy. A good portion of this research has used states as the unit of analysis.
These analyses have attempted to define objective wellbeing / quality of life through one of two
orientations, negative or positive rights. Negative rights are those limits placed on government i.e. more freedom for those in the state. Positive rights are those obligations placed on government i.e. more services for those in the state (Usman 2010). In the literature, Ruger and Sorens (2011) found that a decrease in fiscal, regulatory and paternalism burdens from the state leads to more in-migration to that state. These authors focused on both economic and personal freedom while most of the literature in this sphere has focused only on economic freedom. In contrast, a number of studies have found that more government expenditures and services leads to more in-migration such as through the development of parks, public safety and sanitation, welfare and road expenditures (Cebula 2005; Ashby 2007; Cebula 2002; Huang, Orazem & Wohlgemuth 2002).
happy or unhappy may be because of less services or less freedom but these surveys on subjective wellbeing confirm whether the people are actually happy or unhappy. This study is one potential confirmation that this matters when people are choosing to migrate to another state.
The significance of the average wellbeing score with state net in-migration is an important finding in this article with important implications for public policy. The Gallup-Healthways Wellbeing Index captures life
evaluations by classifying respondents as thriving, struggling and suffering on the Cantril Ladder Scale. A state with a relatively large number of residents struggling or suffering is a cause for concern for the policymakers in that state and creates disincentives in relocating there. According to Gallup, only 45% of Americans responded that they are thriving with the majority either struggling or suffering. Gallup compares this percentage with Denmark where 82% of respondents on the same scale felt they were thriving (Gallup-Healthways, 2009).
Overall, those states in the top ten of wellbeing are attracting more migrants than those in the bottom ten of wellbeing. States such as Utah, Wyoming, Montana and Minnesota have the highest average wellbeing scores amongst the lower 48 states. States such as West Virginia, Kentucky, Mississippi and Arkansas have the lowest average wellbeing scores amongst the lower 48 states.
This study set out to determine if state wellbeing had a significant relationship with state net in-migration. A significant and positive relationship was found between these variables. The relationship indicates that state wellbeing could be a positive incentive for in-migration to that state or a negative incentive for out-migration from that state. States should invest time and resources to covering those areas that improve their resident’s wellbeing both to retain those residents as well as attract new residents.
The larger question that is not necessarily answered in this paper is whether the government has an impact on the happiness / wellbeing of their constituents. A positive answer to this question only leads to another question on what those governments can do to maximize general wellbeing in the state. Wassmer, Lascher Jr. and Kroll (2009) found that individual happiness is related to government activity per person through public safety
is definitely an optimal level of personal freedom, state intervention and state spending that can be achieved however this might be subject to shifting circumstances and ideologies.
The constantly shifting expectations by the residents towards government may require governments whether at the state or local level to create an open feedback loop that involves active citizen engagement and involvement so that it is known what is needed, how much of it is needed, where the government should get involved and where it should stand down. Optimally these decisions would be best under unanimous decision-making which could only be achieved through active deliberation and compromise. This might be very challenging at the state-level so less than optimal solutions like a state-wide poll of a selected representative sample could be done where lines of confluence determine those policy initiatives that best impact the wellbeing of its constituents.
In addition, there may be certain areas that are consistently associated with wellbeing that span ideology and context that researchers will have to continue to work on understanding to provide policymakers with empirically-verified directions for policy development and implementation. At the very least, the research in this paper provides some proof that it may actually matter for people living in a state whether they are subjectively happy or not and that states should be concerned about this especially as other states may be making their residents happier than others. As stated previously, this matters in a federal system of public finance where states rely on a substantial proportion of their revenues from own-sources derived from people living in the state. Of course, it also matters who is moving into and out of these states. The poor tend to be less mobile than the rich especially for greater distances such as that required for inter-state movement, but this is not a call for states to focus on attracting the well-off at the expense of the poor. In any case, any neglect of the poor by the state may also have an impact on crime which has an impact on general wellbeing.
There were some weaknesses with this study. A panel study would best capture the effects of wellbeing on net in-migration over time. The cross-sectional design employed here only differentiates between the limited number of cases (48) which may or may not capture the full or true effect of state wellbeing on net in-migration. Unfortunately, the data used for this study does not allow this type of analysis. Additionally, this is a macro-study of migration decision-making. A more thorough analysis would survey the actual migrants to determine their
Future studies could use the newly developed wellbeing measures for metropolitan statistical areas that would lower the level of analysis which would increase the variability and population size of the units of analysis. In addition, states that migrants are leaving and entering could be compared to each other to determine if those migrants are leaving states that are lower in wellbeing than those states that they are entering. At the macro-level this is being done in this study, but this approach would provide further detail.
The problems of endogeneity need to be thoroughly investigated in future studies which Nowok et.al. (2013) attempt to do in their study of whether migrating increases wellbeing or wellbeing increases the likelihood of migrating. In addition, it may be important to separate economic migrants from non-economic migrants if the data will allow this. Non-economic migrants would be the main interest in any study of the effects of wellbeing and migration.
Lastly, the inhibiting effects related to migration need to be considered in a study of wellbeing and
migration. It may be that many would like to leave a state where they are suffering, but are unable because of fiscal constraints. There is a general belief in the migration literature that as people become better off these effects may have less of an effect over time which would limit the selectivity of migrants making the results of these studies much more generalizable. Rebhun and Raveh (2006) stated that, “as migration becomes less selective, it will probably involve a wider range of causations within the different social, economic, cultural, environmental and psychological arenas” (155). One of those psychological arenas will be wellbeing. Rhode and Strumpf (2003) found that mobility costs have decreased over the 140 year period of their study and it is suspected that these costs will continue to decrease over time.
Conclusion
The relationship between the subjective wellbeing in a state and net in-migration to that state was studied in this paper. The results indicate that the subjective wellbeing in a state may have a significant positive influence on net in-migration. These results accord with the general migration literature that focuses on quality of life factors as a determiner of in-migration / out-migration.
only across county-lines, but across state-lines to maximize their wellbeing. It is recommended in this paper that state policymakers consider the impacts of policy on subjective wellbeing.
The weaknesses of this study are based on the statistical model selected which is related to the constraints of the data. It is recommended as data becomes more available that more sophisticated statistical methods be applied to fully understand the relationship between state and local general subjective wellbeing on in-migration / out-migration to those places. It is also recommended that Gallup-Healthways include a question in the survey on how important the maximization to wellbeing was to making a decision to remain in the state or city or migrate to another place. In addition, it would also be important to include another question in that survey to assess the knowledge that the respondent had regarding the general wellbeing in their place of migration before they migrated there. This would help to overcome some of the unknowns regarding these types of migration decisions.
References
Accordino, J., & Johnson, G. T. (2000). Addressing the vacant and abandoned property problem. Journal of Urban Affairs, 22(3), 301 - 315.
Ackerson, L. K., & Subramanian, S. V. (2010). Negative Freedom and Death in the United States. American Journal of Public Health, 100(11), 2163-2164.
Ashby, N. J. (2007). Economic freedom and migration flows between U.S. states. Southern Economic Journal, 73(3), 677-697.
Bogen , J., & Farrell, D. M. (1978). Freedom and happiness: In Mill's defense of liberty. The Philosophical Quarterly, 28(113), 325-338.
Borooah, V. K. (2005). How to assess happiness? A tale of three measures. Applied Economics Letters, 12(3), 191-194.
Boswell, C. (2008). Combining Economics and Sociology in Migration Theory. Journal of Ethnic & Migration Studies, 34(4), 549-566.
Bradbury, K. L., Downs, A., & Small, K. A. (1982). Urban decline and the future of American cities. Washington, DC: Brookings Institution.
Brülde, B. (2010). Happiness, morality, and politics. Journal of Happiness Studies, 11(5), 567-583.
Cebula, R. J. (2002). Migration and the Tiebout-Tullock hypothesis revisited. Review of Regional Studies, 32(1), 87-96.
Cebula, R. J. (2005). Internal migration determinants: Recent evidence. International Advances in Economic Research, 11(3), 267-274.
Cebula, R., & Nair-Reichert, U. (2012). Migration and public policies: A further empirical analysis. Journal of Economics & Finance, 36(1), 238-248.
Clausen, C. (2008). Moving on. Wilson Quarterly, 32(1), 22-26.
Conway, K. S., & Houtenville, A. J. (2003). Out with the old, in with the old: A closer look at younger versus older elderly migration. Social Science Quarterly., 84(2), 309-328.
Cullen, J. B., & Levitt, S. D. (1999). Crime, urban flight, and the consequences for cities. Review of Economics & Statistics, 81(2), 159-169.
DaVanzo, J. (1978). Who moves and why. Challenge, 21(4), 55.
Easterlin, R. A. (2003). Explaining happiness. Proceedings of the National Academy of Sciences of the United States of America, 100(19), 11176-11183.
Eckersley, R. (2009). Population measures of subjective wellbeing: How useful are they? Social Indicators Research, 94(1), 1-12.
Epstein, G. S. (2008). Herd and Network Effects in Migration Decision-Making. Journal of Ethnic & Migration Studies, 34(4), 567-583.
Epstein, G. S., & Gang, I. N. (2006). The Influence of Others on Migration Plans. Review of Development Economics, 10(4), 652-665.
Field, A. P. (2013). Discovering statistics using SPSS: (and sex, drugs and rock 'n' roll) (4th ed.). Thousand Oaks, CA: Sage Publications.
Frey, B. S., & Stutzer, A. (2000). Maximizing happiness? German Economic Review, 1(2), 145. Gallup. (2010). State of the states overall wellbeing [Data file]. Retrieved from
http://www.gallup.com/poll/125066/State-States.aspx
Gallup-Healthways wellbeing index: Methodology report for indexes. (2009). Retrieved from
Gibson, J., Kim, B., & Olivia, S. (2011). Can we trust cluster-corrected standard errors? An application of spatial autocorrelation with exact locations known. Retrieved from University of Waikato, Department of Economics website: http://EconPapers.repec.org/RePEc:wai:econwp:10/07.
Harries, K. (2004). Violence change and cohort trajectories: Baltimore neighborhoods, 1990-2000. Urban Geography, 25(1), 14-30.
Helm, D. T. (2000). The measurement of happiness. American Journal on Mental Retardation, 105(5), 326-335. Hendrick, R. (2004). Assessing and Measuring the Fiscal Heath of Local Governments: Focus on Chicago Suburban
Municipalities. Urban Affairs Review, 40(1), 78-114.
Hollander, J. B. (2010). Moving toward a shrinking cities metric: Analyzing land use changes associated with depopulation in flint, Michigan. Cityscape: A Journal of Policy Development and Research, 12(1), 133-151.
Huang, T., Orazem, P. F., & Wohlgemuth, D. (2002). Rural population growth, 1950-1990: The roles of human capital, industry structure and government policy. American Journal of Agricultural Economics, 84, 615-627.
Johnson, K. M., Voss, P. R., Hammer, R. B., Fuguitt, G. V., & Mcniven, S. (2005). Temporal and spatial variation in age-specific net migration in the united states. Demography, 42(4), 791-812.
Kalenkoski, C. M., & Lacombe, D. J. (2008). Effects of Minimum Wages on Youth Employment: the Importance of Accounting for Spatial Correlation. Journal of Labor Research, 29(4), 303-317.
Kenny, C. (1999). Does growth cause happiness, or does happiness cause growth? Kyklos, 52(1), 3.
Moss, T. (2008). ‘Cold spots’ of urban infrastructure: ‘Shrinking’ processes in eastern Germany and the modern infrastructural ideal. International Journal of Urban & Regional Research, 32(2), 436-451.
Newbold, K. B. (1996). Determinants of elderly interstate migration in the united states, 1985-1990. Research on Aging, 18(4), 451-476.
Ng, Y. K., & Ho, L. S. (2006). Introduction: Happiness as the only ultimate objective. In Happiness and public policy: Theory, case studies and implications (pp. 1 - 16). New York, NY: Palgrave Macmillan. Nowok, B., van Ham, M., Findlay, A. M., & Gayle, V. (2013). Does migration make you happy? A longitudinal
Poston, D. L.,Jr, Zhang, L., Gotcher, D. J., & Gu, Y. (2009). The effect of climate on migration: United States, 1995-2000. Social Science Research, 38(3), 743-753.
Rebhun, U., & Raveh, A. (2006). The Spatial Distribution of Quality of Life in the United States and Interstate Migration, 1965–1970 and 1985–1990. Social Indicators Research, 78(1), 137-178.
Reisinger, M. E. (2003). Sectoral shifts and occupational migration in the united states. Professional Geographer, 55(3), 383-395.
Rhode, P. W., & Strumpf, K. S. (2003). Assessing the importance of Tiebout shorting: Local heterogeneity from 1850 to 1990. American Economic Review, 93(5), 1648-1677.
Rousseau, M. (2009). Re-imaging the city centre for the middle classes: Regeneration, gentrification and symbolic policies in ‘Loser cities’. International Journal of Urban & Regional Research, 33(3), 770-788.
Ruger, W. P., & Sorens, J. (2011). Freedom in the 50 states (978-0-9836077-0-0). Mercatus Center: George Mason University.
Schilling, J., & Logan, J. (2008). Greening the rust belt: A green infrastructure model for right sizing America’s shrinking cities. Journal of the American Planning Association, 74(4), 451-466
Studer, R. (2012). Does it matter how happiness is measured? Evidence from a randomized controlled experiment. Journal of Economic & Social Measurement, 37(4), 317-336.
Treyz, G. I., Rickman, P. S., Hunt, G. L., & Greenwood, M. J.The dynamics of U.S. internal migration. Review of Economics & Statistics, 75(2), 209-214.
United States Census Bureau. (2010). State-to-state migration flows [Data file]. Retrieved from http://www.census.gov/hhes/migration/data/acs/state-to-state.html.
United States Census Bureau. (2005). Population estimates [Data file]. Retrieved from http://www.census.gov/popest/data/historical/2000s/vintage_2005/index.html
Usman, J. O. (2010). Good enough for government work: The interpretation of positive constitutional rights in state constitutions. Albany Law Review, 73, 1459 – 1534.
Veenhoven, R. (2006, October). How do we assess how happy we are? Tenets, implications and tenability of three theories. Paper presented at New Directions in the Study of Happiness: United States and International
Veenhoven, R. (2000). Freedom and happiness: A comparative study in 46 nations in the early 1990. In E. Diener & E. Suh (Eds.), Culture and subjective wellbeing (pp. 257-288). Cambridge, MA: MIT Press.
Wassmer, R. W., Lascher Jr., E. L., & Kroll, S. (2009). Sub-national Fiscal Activity as a Determinant of Individual Happiness: Ideology Matters. Journal of Happiness Studies, 10, 563 - 582.
Tables Table 1
Diagnostics for Spatial Dependence
Test Statistic Test Value Prob. Value Lagrange Multiplier (lag) 1.2985279 0.2544823 Robust LM (lag) 2.4314413 0.1189235 Lagrange Multiplier (error) 0.1194035 0.7296823
Robust LM (error) 1.2523169 0.2631104
Table 2
Descriptive Statistics of Dependent, Independent and Control Variables Untransformed or Factor Loaded
Min. Max. Mean St.Dev.
Net In Migration as a Percent of 2005 Population Totals -5.75 7.18 .94 3.03
Average Wellbeing Score per State 61.60 68.83 66.02 1.59
Per Capita Income 30841 55427 38686.65 5707.54
Spending in Billions by State 3.70 166.70 29.94 31.20
Unemployment Rate 3.8 13.7 8.80 2.07
Housing Price Index 126.1 288.5 198.22 32.89
Percent College Attainment 28.40 54.30 38.99 6.53
Notes. Dependent variable = Net In Migration as Percent of 2005 Population Totals (2005 – 2010) based on U.S. Census data on in-migration and out-migration. Average Wellbeing based on Gallup-Healthways Wellbeing scores for U.S. States (2008 – 2010). Per capita income from the Bureau of Business and Economic Research at the University of New Mexico from the United States Department of Commerce (2010). Spending in Billions by state based on figures from U.S. Census reported at the billionth level (2010). Unemployment rate from Bureau of Labor Statistics based on averages for monthly data per state (2010). The Housing Price Index data are from the U.S. Census (2010). Percent College Attainment data are from the U.S. Census (2010).
Table 3
Descriptive Statistics of Dependent, Independent and Control Variables Untransformed or Factor Loaded
Min. Max. Mean St.Dev.
Number of Violent Crimes 815 164133 25627.77 31586.41
Percent White per State 43.10 96.00 75.41 13.60
Percent Latino per State .90 43.40 9.14 9.71
Percent African American per State .40 36.90 10.67 9.78
Percent Asian per State .50 12.20 2.53 2.22
Number of 18 to 44 Year Olds in Thousands 201 14424 2328.08 2620.98
Number of 65+ Year Olds in Thousands 70 4247 832.29 859.70
Average Net Migration -723249 1236456 48282.46 267736.51
Table 4
Principle Components Analysis Results
Components 1 2
Log Spending in Billions by State .929
Log Number of Violent Crimes .949
Log Number of 18 to 44 Year Olds in Thousands .939
Number of 65+ Year Olds in Thousands .840
Log Per Capita Income .891
Log Percent College Attainment .879
Square Root Percent African American per State .593 -.310
Unemployment Rate .627 -.400
Housing Price Index -.449 .495
Percent White per State -.769
Log Percent Latino per State .633
Log Percent Asian per State .753 .515
Notes. Extraction Method: Principal Component Analysis. Rotation Method: Oblimin with Kaiser Normalization. Rotation converged in 5 iterations. N = 48 States.
Table 5
Multiple Regression Results
b SE b β
(Constant) -45.81* 24.123
(-94.46, 2.84)
Average Wellbeing Score per State .71* .37 .37*
(-.03, 1.44)
(-1.48, .19)
Demographics, Spending and Unemployment -1.89** .569 -.62**
(-3.04, -.74)
Average Net Migration 3.099E-006* .000 .27*
(.00, .00)
Notes. Dependent Variable: Net In Migration as a Percent of 2005 Population Totals (2005 - 2010). Adjusted R2