0
1
2
3
4
5
6
7
8
9
10
Education Budget as % of GDP
Asia & Sth.Pacific
Indonesia
Vietnam
Cambodia
China
pakistan
Philippines
Nepal
Brunei
Japan
Singapore
India
Thailand
Hong Kong
Korea
Australia
Malaysia
Source
0
1
2
3
4
5
6
7
8
9
10
Education Budget as % of GDP
Middle East & Nth.Africa
Nigeria
U.A.E.
Qatar
Lebanon
Libya
Oman
Turkey
Bahrain
Syria
Egypt
Jordan
Kuwait
Sudan
Saudi Arabia
Yemen
Sth.Africa
Source
0
1
2
3
4
5
6
7
8
9
10
Education Budget as % of GDP
Europe + USA
Greece
Germany
Italy
Netherlands
Poland
U.K.
Portugal
France
Switzerland
Sweden
Norway
Iceland
Denmark
Source
Education Budgets as % of GDP
0 1 2 3 4 5 6 7 8 9 10
Asia & Sth.Pacific Indonesia
Vietnam Cambodia China pakistan Philippines Nepal Brunei Japan Singapore India Thailand Hong Kong Korea Australia Malaysia 0
1 2 3 4 5 6 7 8 9 10
Middle East & Nth.Africa Nigeria
U.A.E. Qatar Lebanon Libya Oman Turkey Bahrain Syria Egypt Jordan Kuwait Sudan Saudi Arabia Yemen Sth.Africa
0 1 2 3 4 5 6 7 8 9 10
Europe Greece
0
100
200
300
400
500
600
700
800
900
Number of Computers
(per thousand people)
Asia & South Pacific
Pakistan
Bangladesh
Burma
Cambodia
Laos
Nepal
India
Sri Lanka
Vietnam
Indonesia
Brunei
China
Philippines
Thailand
Malaysia
South Korea
Japan
Hong Kong
Singapore
Australia
Source
0
100
200
300
400
500
600
700
800
900
Number of Computers
(per thousand people)
Middle East and North Africa
Libya
Yemen
Nigeria
Sudan
Jordan
Turkey
Oman
Syria
Egypt
Morocco
Saudi Arabia
Kuwait
U.A.E.
Qatar
Bahrain
Lebanon
Iran
Source
0
100
200
300
400
500
600
700
800
900
Number of Computers
(per thousand people)
Europe & USA
Switzerland
Sweden
Netherlands
Denmark
U.K.
France
Norway
Germany
Iceland
Finland
Italy
Spain
Greece
USA
source
0 100 200 300 400 500 600 700 800 900
Asian and Sth Pacific Pakistan
Bangladesh Burma Cambodia Laos Nepal India Sri Lanka Vietnam Indonesia Brunei China Philippines Thailand Malaysia South Korea Japan Hong Kong Singapore Australia 0
100 200 300 400 500 600 700 800 900
Middle East & Nth. Africa LibyaYemen Nigeria Sudan Jordan Turkey Oman Syria Egypt Morocco Saudi Arabia Kuwait U.A.E. Qatar Bahrain Lebanon Iran
0 100 200 300 400 500 600 700 800 900
Europe & USA Switzerland
Sweden Netherlands Denmark U.K. France Norway Germany Iceland Finland Italy Spain Greece USA
0
50
100
150
200
Total Number of Computers
(in million)
Asian and Sth Pacific
Pakistan
Bangladesh
Burma
Cambodia
Laos
Nepal
India
Sri Lanka
Vietnam
Indonesia
Brunei
China
Philippines
Thailand
Malaysia
South Korea
Japan
Hong Kong
Singapore
Australia
Source
0
Source50
100
150
200
Total Number of Computers
(in millions)
Middle East & Nth. Africa
Libya
Yemen
Nigeria
Sudan
Jordan
Turkey
Oman
Syria
Egypt
Morocco
Saudi Arabia
Kuwait
U.A.E.
Qatar
Bahrain
Lebanon
Iran
0
50
100
150
200
Total Number of Computers
(in millions)
Europe & USA
Switzerland
Sweden
Netherlands
Denmark
U.K.
France
Norway
Germany
Iceland
Finland
Italy
Spain
Greece
USA
Source
Total Number of Computers
(in millions)
0 50 100 150 200
Europe & US Switzerland Sweden Netherlands Denmark U.K. France Norway Germany Iceland Finland Italy Spain Greece USA 0
50 100 150 200
Asian and Sth Pacific
PakistanBangladesh Burma Cambodia Laos Nepal India Sri Lanka Vietnam Indonesia Brunei China Philippines Thailand Malaysia South Korea Japan Hong Kong Singapore Australia 0 50 100 150 200
Middle East & Nth. Africa Libya
Knowledge Engineering
The Following Six Slides Represent Data From A Selection
Of Countries about Fixed Telephone Lines X 000’s and Per 100
People in The Regions of Europe + USA, Middle East +
Nth.Africa + Asia Pacific.
Fixed Telephone Lines X 000’s – Asia Pacific
A ust r al i a B r unei
Chi na I ndonesi a
Hong K ong, Lao P . D. R.
M al di ves Nepal
P hi l i ppi nes Sr i Lanka
T hai l and
0 50000 100000 150000 200000 250000 300000 350000 400000
Austr al i a Bangl adesh Br unei Cambodi a Chi na India Indonesi a Japan Hong Kong, Kor ea Lao P.D.R. Malaysi a Maldi ves Myanmar Nepal Paki stan Phi l ippi nes Singapor e Sr i Lanka Tai wan Thai l and Vi et Nam Source
Fixed Telephone Lines X 000’s – Middle East + Nth.Africa
2002(000s
)
200
7
Bahrain Iran (I.R.)
Kuwait Lebanon
Nigeria Qatar
Sudan Turkey
Yemen
0 5000 10000 15000 20000 25000
Bahrain
Egypt
Iran (I.R.)
Jordan
Kuwait
Libya
Lebanon
Morocco
Nigeria
Oman
Qatar
Saudi Arabia
Sudan
Syria
Turkey
UAE
Yemen Source
Fixed telephone Lines X 000’s – Europe + USA
2002 2007 Denmark
France Greece
Italy Norway
Portugal Sweden
U K
0 10 20 30 40 50 60 70 80
Telephone Lines Per 100 Persons - Europe - USA Denmark
Finland
France
Germany
Greece
Iceland
Italy
Netherlands
Norway
Poland
Portugal
Spain
Sweden
Switzerland
Fixed Telephone Lines X 000’s
Denmar k Ger many
I t al y P ol and
Sweden USA
0 20000 40000 60000 80000 100000 120000 140000 160000 180000 200000
Denmar k Fi nl and Fr ance Ger many Gr eec e I cel and I t al y Net her l ands Nor way P ol and P or t ugal Spai n Sweden Swi t zer l and U K USA
B ahr ai n Jor dan
Lebanon Oman
Sudan UA E
0 5000 10000 15000 20000 25000
B ahr ai n E gypt I r an (I . R. ) Jor dan K uwai t Li by a Lebanon M or oc co Ni ger i a Oman Qat ar Saudi Ar abi a Sudan Syr i a T ur k ey UAE Y emen
A ust r alia Chin a
Hon g Kon g, M aldives Philippin es
T hailan d B angl adesh B r unei Cambodi a Chi na I ndi a I ndonesi a J apan Nepal P aki st an P hi l i ppi nes Si ngapor e Sr i Lanka T ai wan
Fixed Telephone Lines Per 100 People – Europe + USA
2002 2007 Denmark
Finland France
Germany Greece
Iceland Italy
Netherlands Norway Poland
Portugal Spain Sweden
Switzerland U KUSA
Denmark Finland France Germany Greece Iceland Italy Netherlands Norway Poland Portugal Spain Sweden Switzerland U K USA
Source
Fixed Telephone Lines Per 100 People – Asia Pacific
2002 2007 Australia
Brunei China
Indonesia Hong Kong,
Lao P.D.R. Maldives
Nepal Philippines
Sri Lanka Thailand
0
Australia Bangladesh Brunei Cambodia China India Indonesia Japan Hong Kong, Korea Lao P.D.R. Malaysia Maldives Myanmar Nepal Pakistan Philippines Singapore Sri Lanka Taiwan Thailand Viet Nam source
Fixed Telephone Lines Per 100 People – Middle East + Nth.Africa
20022007
Bahrain Egypt
Iran (I.R.) Jordan
Kuw ait Libya
Lebanon Morocco
Nigeria Oman
Qatar Saudi Arabia
Sudan Syria
TurkeyUAE Yemen
0
Bahrain
Egypt
Iran (I.R.)
Jordan
Kuw ait
Libya
Lebanon
Morocco
Nigeria
Oman
Qatar
Saudi Arabia
Sudan
Syria
Turkey
UAE
Fixed Telephone Lines Per 100 people
Austr ali a Cambodia
Indonesia Kor ea
Mal dives Pakistan
Sr i Lanka Vi et Nam
0 10 20 30 40 50 60 70
Austr ali a Bangl adesh Br unei Cambodi a Chi na India Indonesi a Japan Hong Kong, Kor ea Lao P.D.R. Malaysi a Maldi ves Myanmar Nepal Paki stan Phi l ippi nes Si ngapor e Sr i Lanka Tai wan Thai land Viet Nam 2 0 0 2 200 7
D en m ar k F i n la n d
F r a n c e Ge rm an y
Gr e e ce Ic e la n d
Ita ly N e th e r l a n d sN o rw a y
P o la n d P o r tu g a lS p a in
S w e d e nSw itze rla n dU KU SA
0 1 0 2 0 3 0 4 0 5 0 6 0 7 0 8 0
D e n m a r k F in la n d F r an c e G e r m a n y G r e e c e Ic e la n d Ita ly N e t h e r la n d s N o r w a y Po la n d Po r tu ga l Sp a in Sw e de n Sw itze rla n d U K U S A
Bahr ai n Egypt Ir an (I.R.)
Jor danKuwai t Li byaLebanon
Mor occoNi ger i a OmanQatarSaudi Ar abi aSudanSyr i aT ur keyUA EYemen
0 5 10 15 20 25 30 35
Bahr ain Egypt Ir an (I.R.) Jor dan Kuwai t Li bya Lebanon Mor occo Niger ia Oman Qatar Saudi Ar abia Sudan Syr ia Tur key UAE Yemen
Knowledge Engineering
The Following Six Slides Represent Data From A Selection of
Countries,About Mobile Telephone Line Subscribers In The Regions Of
Europe
and USA,
Middle East + Nth.Africa and Asia Pacific
.
0
100,000
200,000
300,000
400,000
500,000
'02 '07
Mobile Cellular Subscribers X 000’s – Europe - USA
Denmark
Finland
France
Germany
Greece
Iceland
Ireland
Italy
Netherlands
Norway
Poland
Portugal
Spain
Sweden
Switzerland
UK
USA
Source:
0
100,000
200,000
300,000
400,000
500,000
'02 '07
Mobile Cellular Subscribers X 000’s – Asia Pacific
0
100,000
200,000
300,000
400,000
500,000
'02
'07
Mobile Cellular Subscribers X 000’s – Middle East & Nth. Africa
Bahrain
Egypt
Iran (I.R.)
Jordan
Lebanon
Libya
Morocco
Nigeria
Oman
Qatar
Saudi Arabia
Sudan
Syria
Turkey
UAE
Yemen
Source
Mobile Cellular Subscribers X 000’s
0 100,000 200,000 300,000 400,000 500,000
'02'07
Mobile Cellular Subscribers X 000’s – Europe - USA
Denmark Finland France
Germany Greece Iceland
Ireland Italy
Netherlands Norway Poland
Portugal Spain Sweden
Switzerland UK
USA 0
100,000 200,000 300,000 400,000 500,000
'02'07
Mobile Cellular Subscribers X 000’s – Asia Pacific
Australia Bangladesh Brunei Cambodia China Hong Kong, India Indonesia Japan Korea Lao P.D.R. Malaysia Maldives Myanmar Nepal Pakistan Philippines Singapore Sri Lanka Taiwan
Thailand 0
100,000 200,000 300,000 400,000 500,000
'02'07
Mobile Cellular Subscribers X 000’s – Middle East & Nth. Africa
Bahrain Egypt Iran (I.R.) Jordan Lebanon Libya Morocco Nigeria Oman Qatar Saudi Arabia Sudan Syria Turkey UAE Yemen
0
20
40
60
80
100
120
140
160
180
'07
Mobile Cellular Subscribers Per 100 people Middle East & Nt.Africa
Bahrain
Egypt
Iran (I.R.)
Jordan
Lebanon
Libya
Morocco
Nigeria
Oman
Qatar
Saudi Arabia
Sudan
Syria
Turkey
UAE
Yemen
Source0
20
40
60
80
100
120
140
160
180
'07
Mobile Cellular Subscribers Per 100 People Asia + Sth.Pacific
Australia
Bangladesh
Brunei
Cambodia
China
Hong Kong,
India
Indonesia
Japan
Korea
Lao P.D.R.
Malaysia
Maldives
Myanmar
Nepal
Pakistan
Philippines
Singapore
Sri Lanka
Taiwan
Thailand
0
20
40
60
80
100
120
140
160
180
'07
Mobile Cellular Subscribers Per 100 People Europe + U.S.A
Denmark
Finland
France
Germany
Greece
Iceland
Ireland
Italy
Netherlands
Norway
Poland
Portugal
Spain
Sweden
Switzerland
UK
USA
Source:
Mobile Cellular Subscribers Per 100 People
0 20 40 60 80 100 120 140 160 180
'07
Mobile Cellular Subscribers Per 100 people Middle East & Nt.Africa
Bahrain Egypt Iran (I.R.) Jordan Lebanon Libya Morocco Nigeria Oman Qatar Saudi Arabia Sudan Syria Turkey UAE Yemen
0 20 40 60 80 100 120 140 160 180
'07
Mobile Cellular Subscribers Per 100 People Asia + Sth.Pacific
Australia Bangladesh Brunei Cambodia China Hong Kong, India Indonesia Japan Korea Lao P.D.R. Malaysia Maldives Myanmar Nepal Pakistan Philippines Singapore Sri Lanka Taiwan Thailand
0 20 40 60 80 100 120 140 160 180
'07
Mobile Cellular Subscribers Per 100 People Europe + U.S.A
Denmark
Finland France
Germany Greece Iceland
Ireland Italy
Netherlands Norway
Poland Portugal Spain
Sweden Switzerland
UK USA
Knowledge Engineering
The Following Six Slides Represent Data From A Selection of
Countries,About Internet Users In The Regions Of Asia Pacific, Middle
East + Nth.Africa,Europe and USA.
0
50,000
100,000
150,000
200,000
250,000
(000s)
Internet Users X 000’s – Europe + USA
USA
Denmark
Finland
France
Germany
Greece
Ireland
Italy
Netherlands
Norway
Poland
Portugal
Spain
Sweden
Switzerland
UK
0
50,000
100,000
150,000
200,000
250,000
Users
Internet Users X 000’s _ Middle East + Nth.Africa
Bahrain
Egypt
Iran (I.R.)
Jordan
Kuwait
Lebanon
Libya
Morocco
Nigeria
Oman
Qatar
Saudi Arabia
Sudan
Syria
Turkey
UAE
Yemen
Source0
50,000
100,000
150,000
200,000
250,000
(000s)
Internet Users X 000’s – Asia Pacific
Australia
Bangladesh
Brunei
Cambodia
China
Hong Kong, China
India
Indonesia
Iran (I.R.)
Japan
Korea
Lao P.D.R.
Malaysia
Maldives
Nepal
Pakistan
Philippines
Singapore
Sri Lanka
Taiwan
Thailand
Viet Nam
Source:
0 50,000 100,000 150,000 200,000 250,000
(000s) Internet Users X 000’s – Europe + USA
USA Denmark
Finland France
Germany
Greece Ireland Italy
Netherlands
Norway Poland
Portugal Spain
Sweden Switzerland
UK 0
50,000 100,000 150,000 200,000 250,000
Users
Internet Users X 000’s _ Middle East + Nth.Africa
Bahrain Egypt Iran (I.R.) Jordan Kuwait Lebanon Libya Morocco Nigeria Oman Qatar Saudi Arabia Sudan Syria Turkey UAE Yemen
Internet Users X 000’s
0 50,000 100,000 150,000 200,000 250,000
(0
00s
)
Internet Users X 000’s – Asia Pacific
Australia Bangladesh Brunei Cambodia China Hong Kong, China India Indonesia Iran (I.R.) Japan Korea Lao P.D.R. Malaysia Maldives Nepal Pakistan Philippines Singapore Sri Lanka Taiwan Thailand Viet Nam
Internet Users % Population – Europe + USA
100 's USA
Finland Germany
Ireland Netherlands
Poland Spain
Sw itzerland
0 100
USA Denmark Finland France Germany Greece Ireland Italy Netherlands Norw ay Poland Portugal Spain Sw eden Sw itzerland UK
Internet Users % Population – Middle East + Nth.Africa
Us
e
rs
p
e
r Bahrain
Jordan Libya
Oman Sudan
UAE
0 10 20 30 40 50 60
Bahrain Egypt Iran (I.R.) Jordan Kuw ait Lebanon Libya Morocco Nigeria Oman Qatar Saudi Arabia Sudan Syria Turkey UAE Y
Source
0
10
20
30
40
50
60
70
80
90
100
100's
Internet Users % Population – Europe + USA
USA
Denmark
Finland
France
Germany
Greece
Ireland
Italy
Netherlands
Norway
Poland
Portugal
Spain
Sweden
Switzerland
UK
Source:
0
10
20
30
40
50
60
70
80
90
100
100's
Internet Users % Population – Middle East + Nth.Africa
Bahrain
Egypt
Iran (I.R.)
Jordan
Kuwait
Lebanon
Libya
Morocco
Nigeria
Oman
Qatar
Saudi Arabia
Sudan
Syria
Turkey
UAE
Yemen
Source0
10
20
30
40
50
60
70
80
90
100
100' s
Internet Users % Population – Asia Pacific
Australia
Bangladesh
Brunei
Cambodia
China
Hong Kong, China
India
Indonesia
Iran (I.R.)
Japan
Korea
Lao P.D.R.
Malaysia
Maldives
Nepal
Pakistan
Philippines
Singapore
Sri Lanka
Taiwan
Thailand
Viet Nam
Internet Users As a % of Population
0 10 20 30 40 50 60 70 80 90 100
100's
Internet Users % Population – Europe + USA
USA Denmark Finland France Germany Greece Ireland Italy Netherlands Norway Poland Portugal Spain Sweden Switzerland UK
0 10 20 30 40 50 60 70 80 90 100
100's
Internet Users % Population – Middle East + Nth.Africa
Bahrain Egypt Iran (I.R.) Jordan Kuwait
Lebanon Libya Morocco Nigeria Oman Qatar
Saudi Arabia Sudan Syria Turkey
UAE Yemen
0 10 20 30 40 50 60 70 80 90 100
100' s
Internet Users % Population – Asia Pacific
Australia Bangladesh Brunei Cambodia China Hong Kong, China India Indonesia Iran (I.R.) Japan Korea Lao P.D.R. Malaysia Maldives Nepal Pakistan Philippines Singapore Sri Lanka Taiwan Thailand Viet Nam
Knowledge Engineering
The Following Six Slides represent a Comparison of Internet and
Broadband Subscribers in The Regions Of Asia Pacific, Middle East +
Nth.Africa,Europe and USA
0 10 20 30 40 50 60 70 80
Per 100 100's 2007
Subscribers per 100
's. 2007
Europe + USA
Internet and Broadband Subscribers as % of Population
source
0
10
20
30
40
50
60
70
80
Middle East + Nth.Africa
Internet and Broadband Subscribers as % of Population
Per 100 100's 2007
Subscribers per 100 's
2007
0 10 20 30 40 50 60 70 80
A sia Pacif ic
Int ernet + B ro ad b and Sub scrib er s as % o f Po p ulat io n
Broadband Subscribers
Population % 2007
Internet Subscribers
Population % 2007
Source:
0 20000 40000 60000 80000 100000 120000 140000
USA Denma
rk Finl
and Fran
ce Germ
any Gre
ece Irela
nd Italy
Netherl andsNorwa
y Pola
nd Portu
gal Spai
n Swed
en
Switz erla
nd UK Europe + USA Internet + Broadband Subscribers X 000's
Broadband Subscribers X 000's 2007 Internet Subscribers X 000's 2007
Source:
0 2000 4000 6000 8000 10000 12000 14000 16000 18000
Bahr ain
Iran (I.R
.) Kuw
ait Libya Niger
ia Qata
r Suda
n Turke
y Yeme
n Middle East + Nth.Africa Internet + Broadband Subscribers X 000"s
Broadband Subscribers X 000's 2007 Internet Subscribers X 000's 2007
Source:
0 50000 100000 150000 200000 250000
Austra lia
Bangl adeshBrun
ei
Cambo dia
Chin a
Hong Ko ng
Indi a
Indone sia Iran (I.R
.) Japa
n Korea Lao P .D.R
.
Malays ia Mal dives
Nepal Paki stan Philip pine
s
Sing apo
re Sri Lan
ka Taiw
an Thai land Viet Nam Asia Pacific Internet and Broadband Subscribers X 000's
Broadband Subscribers X 000's 2007
Internet Subscribers X 000's 2007
0
ark Finlan
d FranceGerman
y Greec
e Ireland Ita
ly
Ne therland
s Internet and Broadband Subscribers as % of Population
Per 100 100's 2007 Subscribers per 100 's. 2007
0 ain Egy
ptIran (I.R.)Jordan Kuw
aitLebanon Libya
Morocco Nigeria
Om an Q atar Saudi Arabia
SudanSyriaTurkeyUAEYemen
Middle East + Nth.Africa Inte rnet and Broadband Subscribers as % of Population
Per 100 100's 2007 Subscribers per 100 's 2007
0 stralia Ban glad
eshBrunei Cam bodia
Ch ina Hong KongIndia
Indon esia Ira n (I.R.)
Ja pan
Ko rea La o P.D.R.
M alaysia
M aldives
Nepal Pa kistan Ph ilippines
Singapore Sri La nkaTaiwan
Thailand Viet Nam
Asia Pacific Internet and Broadband Subscribers as % of Population
Broadband Subscribers Population % 2007 Internet Subscribers Population % 2007
Internet + Broadband Subscribers as % of Population
Internet + Broadband Subscribers X 000’s
0 20000 40000 60000 80000 100000 120000 140000
USA Denm
ark Fi nland
Fra nce Germ
any Gree
ce IrelandItaly
Ne therland
s eden Switz erland UK Europe + USA Internet + Broadband Subscribers X 000's
Broadband Subscribers X 000's 2007 Internet Subscribers X 000's 2007 0
0 2000 4000 6000 8000 10000 12000 14000 16000 18000
Bahra in Eg
ypt Iran
(I.R.) Jordan
Ku wait
Lebano n Libya
Mo rocco
Nigeria Oma
n Qa
tar Saudi Arabia
Suda n Syria
TurkeyUAE Yemen
Middle East + Nth.Africa Internet + Broadband Subscribers X 000"s
Broadband Subscribers X 000's 2007 Internet Subscribers X 000's 2007
0 50000 100000 150000 200000 250000
Austr alia Bangl adesh
Bru nei C ambod
ia C
hina H ong K
ong India
Indo nesia
Iran (I. R.)
Japan Kor
ea La o P.D
.R. Mala
ysia Maldives
N epal
Pakis tan Philip pin es S inga
pore
Asia Pacific Internet and Broadband Subscribers X 000's
Broadband Subscribers X 000's 2007 Internet Subscribers X 000's 2007
0 5000 10000 15000 20000 25000 30000 35000
Bahra
Middle East + Nth.Africa Public Expenditure Per Student in
PPP US$
Tertiary
Secondary
Primary
Source:
Europe + USA Public Expenditure Per Student in PPP US$
0 5000 10000 15000 20000 25000 30000 35000 40000 45000
Den
Tertiary Secondary Primary
0
2000
4000
6000
8000
10000
12000
14000
16000
18000
Au stra
lia
Ba ng
lad esh
Bru nei
Ca mb
od ia Chi
na
Indo ne
sia Laos
Ma lays
ia
Ph ilip
pin es
Sin gapo
re Tha
ilan d
Vie tna
m
Asia + Sth.Pacific Public Expenditure Per Student in PPP US$
Tertiary
Secondary
Primary
source
Europe + USA
Public Expenditure on Education as a % of Governm ent
Expenditure
0
10
20
30
40
D
enm
ar
k
Fi
nl
and
Fr
an
ce
G
er
ma
ny
Gr
ee
ce
H
ol
la
nd
N
or
w
ay
Po
rtuga
l
Sw
ed
en
Swi
tz
er
lan
d
U.
K
U
SA
%
source
Middle East + Nth.Africa
Public Expenditure on Education as a % of Total Government Expenditure
0
5
10
15
20
25
30
Ba
hra
in
Eg
yp
t
Jor
da
n
Ku
wa
it
Leb
an
on
Li
by
a
Mo
ro
cc
o
Ni
ge
ria
Om
an
Q
ata
r
Sa
ud
i A
rabi
a
Su
da
n
Syr
ia
Tu
rkey UA
E
Ye
m
en
%
source
Asia + Sth.Pacific
Public Expenditure on Education as a % of Total Government Expenditure
0
5
10
15
20
25
30
Au
st
ra
lia
Ba
ng
lade
sh
Br
une
i
Ca
m
bo
di
a
Ch
in
a
In
do
ne
sia
La
os
Ma
la
ys
ia
Ph
ilip
pi
ne
s
Si
ng
apo
re
Th
ai
la
nd
Vi
et
nam
%
Figure 10 shows that the greater a country’s Gross Domestic Product per
capita, the greater its secondary
Percentage of Technical/Vocational Enrolment.
For instance, the three countries with the highest PTVEs
-Australia, Belgium and the United Kingdom - also have very
high GDP per capita; meanwhile, Malawi, Nigeand Nigeria have low
values for both GDP per capita and PTVEs.
Some neighbouring and/or relatively homogeneous countries tend to
cluster, e.g. all five Nordic countries have
high income levels and PTVE between 20% and 35%;
Japan and the Republic of Korea have similarly high income and PTVE
around 15%; and Armenia and Azerbaijan have lower income and very
low PTVE.
There are exceptions, however. The United States and Ireland do not
have secondary vocational education
despite their high GDP per capita. In contrast, Suriname and Panama are
middle-income countries with very
high PTVE.
Percentages of Technical/Vocational Enrolment in secondary by GDP
per capita (logarithm)
Percentages of Technical/Vocational Enrolment in secondary by GDP per
capita
Fig:10
Source:
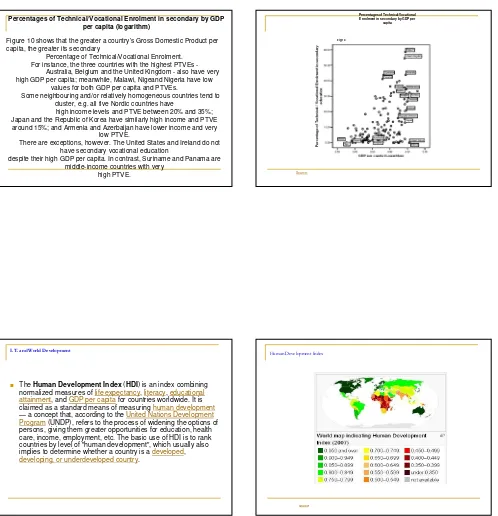
I.T. and World Development
The Human Development Index
(HDI) is an index combining
normalized measures of
life expectancy
,
literacy
,
educational
attainment
, and
GDP per capita
for countries worldwide. It is
claimed as a standard means of measuring
human development
— a concept that, according to the
United Nations Development
Program
(UNDP), refers to the process of widening the options of
persons, giving them greater opportunities for education, health
care, income, employment, etc. The basic use of HDI is to rank
countries by level of "human development", which usually also
implies to determine whether a country is a
developed
,
developing, or underdeveloped country
.
Human Development Index
World map indicating Human Development Index (2007
Source:
Digital Opportunity Index
Source:
Digital Opportunity Index
source
Digital Opportunity Index
Digital Opportunity Index
source
¾
The Digital Divide is real and growing in many cases
¾
The ability to move into the Digital Age will effect
each country’s future growth opportunities and impact
greatly it’s industries and citizens.
¾
Many countries are not well placed at this time and
need a Digital Rescue package in order to catch up
and compete.
¾
An effective national IT policy must be multi-sectored
and target changes and give incentives
The Digital Divide
The Digital Divide
Digital Opportunity Index
Source:
The Knowledge Economy and Economic Performance
Economic development and knowledge are closely related (figure 4).
In fact, the correlation between the accumulation of knowledge, as
measured by the KEI, and levels of economic development
is around 87 percent.Countries with higher KEI values tend to have
higher levels of economic development,and vice versa.