Summary Foliar frost resistance of three endemic New Zea-land trees, Nothofagus menziesii (Hook. f.) Oerst. (Fagaceae), Pittosporum eugenioides A. Cunn. (Pittosporaceae) and Gri-selinia littoralis Forst. f. (Cornaceae), was examined as the trees hardened from late summer to midwinter in a lowland forest site. The lowest temperatures causing 50% damage (LT50) occurred in late winter and were similar to those re-corded for other forest trees native to New Zealand (−11.7 °C in N. menziesii, −10.7 °C in P. eugenioides, and −10.6 °C in G. littoralis). All three species hardened by 4--7 °C, with G. littoralis showing the least frost resistance in summer and hence the greatest degree of hardening. Thermal analysis dur-ing freezdur-ing indicated that all three species became more tolerant of extracellular ice formation in winter. Measurements of chlorophyll a fluorescence correlated well with visible in-jury. The differing patterns of frost damage development in the three species were related to leaf anatomy: visible injury was localized within the small compartments formed by the highly septate leaves of the most resistant species, N. menziesii, and was somewhat localized in the partially septate leaves of P. eugenioides, whereas damage could be initiated anywhere in the aseptate leaves of G. littoralis, which was the least frost resistant species, particularly in summer.
Keywords: chlorophyll a fluorescence, differential thermal analysis, Griselinia, leaf anatomy, Nothofagus, Pittosporum.
Introduction
During cold hardening, leaves may either remain freezing sensitive and become damaged as soon as ice forms within the tissue or become freezing tolerant and sustain a certain amount of ice formation before damage occurs. Moderate frost resis-tance of evergreen leaves may be achieved either by extracel-lular freezing of celextracel-lular water (equilibrium freezing) or by supercooling of the cellular solutions (nonequilibrium freez-ing) (Olien 1978, Lösch and Kappen 1981). Persistent super-cooling, to −10 or −12 °C, has been reported as a frost survival mechanism in several species with evergreen leaves from
warm temperate climates with mild winters (Sakai and Larcher 1987). Leaves of most angiosperm trees native to New Zealand are moderately frost hardy during winter, with incipient injury occurring at temperatures between −2 and −15 °C, but show seasonal acclimation of only 1--6 °C. These attributes are characteristic of freezing-sensitive leaves that are injured as soon as ice forms within the tissue (e.g., olive (Larcher 1982)). However, leaves of seedlings of Nothofagus solandri var. clif-fortioides (Hook. f.) Oerst. show up to 8 °C of hardening (Greer et al. 1989) and leaves of adult trees exhibit up to 11 °C of hardening (Wardle and Campbell 1976), indicating the potential of Nothofagus species to develop freezing tolerance. To examine the underlying mechanism of foliar frost resis-tance (frost hardiness) of New Zealand evergreen trees, Notho-fagus menziesii (Hook. f.) Oerst. (Fagaceae), Pittosporum eugenioides A. Cunn. (Pittosporaceae) and Griselinia littoralis Forst. f. (Cornaceae) were investigated. These species were chosen because they differ in leaf anatomy and phenology. Furthermore, there is no published information on the frost resistance of the important timberline tree, N. menziesii, which was chosen because it was expected to develop a higher frost resistance than the other two species.
Materials and methods
Plant material
The genus Nothofagus is restricted to the Southern Hemi-sphere, and Griselinia to New Zealand. Nothofagus menziesii, which may attain a height of 30 m, has a broad altitudinal distribution, from sea level to the timberline, where it can be found in almost pure stands (Wardle 1984). Pittosporum eugenioides attains a height of about 12 m and is found in forests, on forest margins and stream banks. It is restricted to altitudes below 600 m (Salmon 1980). Griselinia littoralis is a spreading tree up to 15 m tall. It is most common at low altitudes but may be found up to 900 m (Salmon 1980).
The study area was in a forest within the Waipori Falls Scenic Reserve at an altitude of about 70--80 m above sea level
Frost resistance and susceptibility to ice formation during natural
hardening in relation to leaf anatomy in three evergreen tree species
from New Zealand
G. NEUNER
1,3and P. BANNISTER
21 Institut für Botanik, Abteilung Allgemeine Botanik, Sternwartestrasse 15, 6020 Innsbruck, Austria
2 Department of Botany, University of Otago, P.O. Box 56, Dunedin, New Zealand
3 Author to whom offprint requests should be sent
Received September 13, 1994
(45°55′ S, 170°1′ E) in a locality where the three species occur naturally together. In March, additional measurements were made on twigs of P. eugenioides and G. littoralis from trees growing in the Dunedin Town Belt (30 m, 45°52′ S, 170°30′ E).
Samples were collected monthly before 1000 h. Twigs sup-porting two or more years of growth were cut from at least five adult trees of each species, from the northern and eastern periphery of each crown about 1.5 m above ground. The twigs were wrapped in polyethylene bags and transported at tem-peratures similar to the collection site to the Botany Depart-ment of the University of Otago, where only the current-year growth was subjected to frost treatment. The interval between collection and treatment was about 1 h.
Determination of foliar frost resistance
Frost treatments were conducted as described by Bannister (1984b) in microprocessor-controlled commercial freezers. Samples were wrapped in polyethylene bags and surrounded with polystyrene foam to minimize temperature fluctuations. Freezers were programed to decrease temperature at about 12 °C h−1 to about 0 °C. Thereafter, the cooling rate was main-tained at ≤ 5 °C h−1 until the target temperature was reached and held constant for 8 h. Warming rates were < 5 °C h−1. During treatment, leaf temperatures were monitored at 15-min intervals by thermistors connected to a chart recorder (mini-ature temper(mini-ature recorder, Model D, Grant Instruments Ltd., Cambridge, U.K.).
After freezing, treated twigs were placed on damp paper towels within polyethylene bags at moderate illumination (about 100--200 µmol m−2s−1) at room temperature. Frost damage was assessed after 7 days by visual estimation of the percent damage to the lamina. Percent damage was then plot-ted against the frost treatment temperature and a logistic curve was fitted to the data (P.fit, Biosoft, Cambridge, MS). The values for 10, 50 and 90% damage (LT10, LT50 and LT90) were obtained from the curve. Estimates of LTi (the highest tempera-ture causing incipient injury) and LT100 (the highest tempera-ture causing 100% damage) were also made.
Determination of ice formation
Freezing exotherms for leaves of G. littoralis and P. eug-enioides were registered with thermistors (Grant Instruments Ltd.). Exotherms for leaves of N. menziesii were detected by thermocouples connected to a programable datalogger (CR10, Campbell Scientific Ltd., Logan, UT, USA). A single thermo-couple or thermistor was mounted under each leaf. The leaves were insulated between sheets of polystyrene, to reduce heat loss during ice formation, and placed in a precooled commer-cial freezer. Cooling rates below 0 °C were 1.5 °C min−1. The chart recorder registered temperature at a maximum rate of one measurement per minute. A recording rate of one measurement per second was used for the thermocouples.
The supercooling temperature, Tsc (Levitt 1980, see also Sakai and Larcher 1987), was determined as the lowest sub-freezing leaf temperature attained before the exothermic in-crease. Data presented are mean values of at least 10 trials.
Smaller increases of temperature due to ice formation were detected by differential thermal analysis (DTA, Burke et al. 1976). In addition to the sample temperature, a parallel, water-free, reference temperature was recorded. The temperature difference (DK) was subsequently plotted against the reference temperature. Cooling rates were the same as those used for the determination of Tsc, except that lower rates of 1 °C h−1 were sometimes used. Leaf and reference temperatures were usually recorded every second, but every 2 min when the cooling rate was only 1 °C h−1. At least five replicate leaves were used for each determination.
In vivo chlorophyll fluorescence measurements
The functioning of mesophyll cells during frost treatment was monitored by in vivo chlorophyll fluorescence, with two pocket computer fluorometers (Larcher and Cernusca 1985). The fluorometer consisted of an SF-10 sensing probe (Brancker, Ottawa, Canada) controlled by a microcomputer. Induction transients were recorded for three different time scales (0--100 ms, 0--8 s and 0--100 s).
Leaves were dark adapted for 45 min before fluorescence was induced by red light of 630 to 720 nm wavelength at an intensity of 13 µmol m−2 s−1 (quantum sensor LI-188B, Li-Cor Inc., Lincoln, NE) for a duration of 100 s.
The effects of low temperature on chlorophyll fluorescence were measured on attached leaves mounted under the sensor head of the pocket fluorometer. A 1-mm thick cork ring and a thin (0.15 mm) cover-glass were interposed between the leaf and the sensor head. A small fan ensured an even lowering of temperature within the microprocessor-controlled freezer. The temperature was progressively reduced until leaves were com-pletely frozen. Cooling rates were 6 °C h−1 above 0 °C and 1 °C h−1 below 0 °C, when fluorescence transients were re-corded at 45-min intervals. The fluorescence ratio tp/tp20 was determined according to Larcher et al. (1991), where tp and tp20 are the times required to attain peak fluorescence at the freez-ing temperature and at 20 °C, respectively. Four replicates were used for each species.
Results
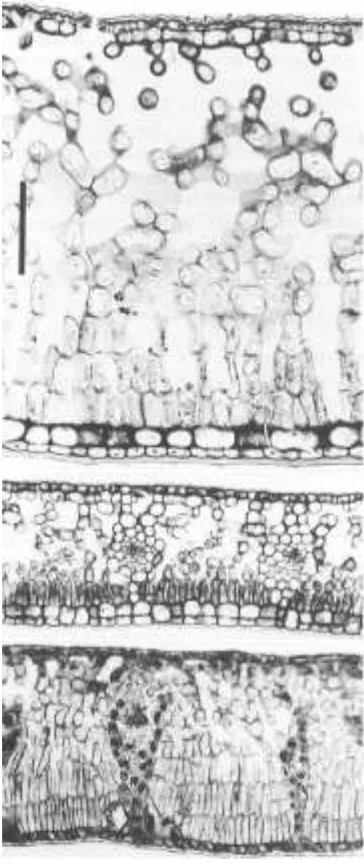
Leaf anatomy
All three species have evergreen dorsiventral leaves that differ in their transverse structure (Figure 1). Only mature leaves were sampled for frost resistance measurements, and it was assumed that no gross changes in leaf anatomy occurred be-tween late summer and midwinter.
a septate leaf blade. The leaf compartments are larger than in N. menziesii: about 0.2–0.5 mm2in area near the leaf margin, but larger near the central main vein (1–3 mm2). The leaves of G. littoraliscontain no sclerenchymatous or collenchymatous supporting tissue, and are therefore without septae. Mechani-cal support is provided by a hypodermis.
Both the palisade and spongy mesophyll ofN. menziesiiare densely packed, with small cells and narrow intercellular spaces. Mesophyll cells and intercellular spaces are larger in P. eugenioidesand largest inG. littoralis. Consequently, the densely packed mesophyll and anatomical separation of freez-ing units found inN. menziesiiprovide an ideal structure for effective supercooling (Sakai and Larcher 1987), whereas an-atomical requirements for supercooling are met to a decreas-ing extent inP. eugenioidesandG. littoralis.
Symptoms of freezing injury
Differences in the pattern and development of frost damage in leaves of the three species were related to leaf anatomy. These differences were consistent and did not change with season. The first signs of damage in leaves ofN. menziesiioccurred in parenchymatous cells in the axils of basal veins of the leaf, where fringed domatia (small pits) often occur. Subsequently, however, the strongly septate leaf blade ofN. menziesii devel-oped a mottled pattern of damage when leaves were exposed to temperatures around LT50: some intercostal regions were completely killed, whereas others were undamaged. The same pattern of injury, which seems to be typical of septate leaves, has been observed inN. solandri var.cliffortioides(Wardle and Campbell 1976) as well as in Mediterranean sclerophyl-lous plants (e.g.,Laurus nobilisL.,Quercus ilexL. (Larcher 1954) and leaves ofCinnamomum(Larcher 1985)).
In contrast toN. menziesii, the initial damage to leaves of P. eugenioidesoccurred in the collenchymatous cells associ-ated with the veins. A mottled pattern of damage developed at the leaf tip and on the leaf margins, indicating the protection (probably from ice expansion) afforded by the small compart-ments formed by septae in these regions. The epidermal layers were often the first site of injury in the intercostal regions of the leaf, with the mesophyll becoming affected later. This made the visual assessment of damage difficult, because dam-age had to be evaluated in three dimensions. Similar damdam-age has been observed in Mediterranean sclerophylls (e.g., Arbu-tus unedoL., Larcher 1954).
The pattern of leaf injury inG. littoraliswas characteristic of leaves containing homogeneous mesophyll (e.g., Olea, Larcher 1964) and was typified by a diffuse blackening or browning that might be initiated anywhere on the leaf blade.
Foliar frost resistance
All three species showed an increase in foliar frost resistance during natural hardening from late summer until midwinter (Figure 2).Notofagus menziesiishowed the highest resistance throughout the year, andG. littoralisthe lowest.
In winter, the maximum foliar frost resistances (LT50) of all three species were similar (–11.7 °C inN. menziesii,–10.7 °C inP. eugenioides, and –10.6 °C inG. littoralis) and the differ-ent amounts of hardening (4 °C in N. menziesii and P. eugenioides, and 6.8 °C inG. littoralis) mainly reflected the lower frost resistance ofG. littoralisin summer.
The range of temperatures associated with 10–90% damage (Figure 2) was from 1 to 4 °C for all three species, except for G. littoralisduring March and April when it was < 1 °C. A narrow range of temperatures causing damage has also been found in other indigenous species (Bannister 1984a, 1994b), although a difference of > 5 °C between temperatures causing incipient injury (LTi) and maximum damage (LT100) has been observed inN. solandrivar. cliffortioides(Wardle and Camp-bell 1976).
Susceptibility to ice formation
The temperature at which freezing commences in plant tissues appears to depend on leaf anatomy, the presence of ice
nuclea-Figure 1. Transverse leaf sections (10µm) ofN. menziesii(upper),
tors and tissue water content, and is further influenced by leaf detachment (Sakai and Larcher 1987). The capacity for tran-sient supercooling may be reduced in attached leaves because of the presence of ice nucleators in the vascular system. Meas-urements of freezing exotherms in attached leaves during win-ter indicated that ice formed at temperatures 4--5 °C higher than the measured threshold supercooling temperature, Tsc*, of detached leaves with a dry surface (Neuner, Bannister and Larcher, unpublished observations). However, Tsc* was used to measure the potential capacity for supercooling and did not change significantly during natural hardening (Figure 2). Mean values for all three species were between −5 and −8 °C and are within the range reported for transient supercooling in other evergreen leaves (Larcher 1985). However, the low rates of freezing (≤ 5 °C h−1) used to determine frost resistance were intended to reduce both the degree of supercooling indicated by Tsc* and the associated possibility of increased damage.
In summer, leaves of P. eugenioides and G. littoralis were damaged as soon as freezing exotherms indicated the first formation of ice within the leaf tissue. At Tsc*, leaves of P. eugenioides showed around 50% damage and leaves of G. littoralis were completely killed. These two species are
evidently freezing-sensitive in summer and are likely to be damaged by sudden freezing when the thermal equilibrium is restored after transient supercooling (Olien 1978). We were unable to detect exotherms in leaves of N. menziesii, and thus no information is available on the pattern of ice formation for this species in summer.
In winter, all three species showed tolerance of ice formation within their leaf tissues and, in contrast to summer, the onset of damage was coincident with Tsc* (see Figure 2). However, in situ measurements of the threshold supercooling tempera-ture, Tsc (Figure 2), in winter indicated that ice formed at much higher temperatures in attached leaves, and major tissue dam-age occurred several degrees below Tsc, indicating that the leaves were tolerant of ice formation within their tissues.
The freezing characteristics of the three different leaf types were apparent when the results for DTA and damage were combined (Figure 3). In N. menziesii, the exothermic response indicated a sequential freezing of leaves that was associated with a progressive increase in damage. In leaves of P. eug-enioides and G. littoralis the exotherms showed an initial sharp peak that was associated with no more than 10% damage, suggesting that the peak was associated with the nonlethal freezing of extracellular water.
Tissue freezing measured by in vivo chlorophyll fluorescence measurements
Fluorescence measurements, especially the relationship of tp/tp20 to temperature (Figure 4), showed characteristic changes that were related to ice formation within the leaf (Larcher et al. 1991). In N. menziesii, the decline in tp/tp20 was coincident with the range of temperatures associated with freezing of the leaf (Figure 3). The broad range of temperature (4.5--9 °C) associ-ated with the decline of tp/tp20 to zero reflected the capacity of the small compartments to supercool and remain photosyn-thetically active. This interpretation is consistent with the ob-served mottled pattern of damage.
A differential susceptibility of tissues was evident within leaves of P. eugenioides because leaves were already damaged (LT10) before tp/tp20 began to decline (Figure 3). Mesophyll damage occurred within a narrow temperature range (3--5 °C) only after the collenchyma associated with the vascular strands and the epidermal layers had been damaged.
In leaves of G. littoralis, the decline in tp/tp20 started imme-diately after the initial exotherm peak and extended over a temperature range of 4 to 6 °C (Figure 3). This pattern is consistent with the diffuse pattern of damage that occurred immediately after ice nucleation and affected all cell types equally.
In all three species, the temperature range encompassing the decline of tp/tp20 (∆T) corresponded with that associated with visible damage to the mesophyll and was closely related to LT50 (Figure 5), except in P. eugenioides in June. However, a decline of tp/tp20 during progressive cooling has been observed in both freezing-sensitive and freezing-tolerant Rhododendron leaves (Larcher 1994), suggesting that the change in fluores-cence is due to ice formation within the leaf tissue rather than to death of the mesophyll. Consequently, it would be better to
Figure 2. Frost resistance of leaves of N. menziesii, P. eugenioides and
G. littoralis during natural hardening. Bars indicate damage: 10--50% (open) and 50--90% (solid). The lowest subfreezing temperature at-tained before the exothermic temperature increase, measured on de-tached leaves with a dry surface (Tsc*, w) and measured on attached
test the viability of the mesophyll after, rather than during, frost treatment. Recent reports show a good correspondence between visible injury of leaves and chlorophyll fluorescence measured after frost treatment (Robberecht and Junttila 1992, Lindgren and Hällgren 1993).
Discussion
Chlorophyll fluorescence, thermal analysis and visible injury in relation to leaf anatomy
The results stress the value of visible injury as a measure of frost injury in leaves of differing anatomies. Chlorophyll fluo-rescence measurements relate specifically to mesophyll, whereas blackening and browning can result from damage to other leaf tissues, which is integrated by visual assessment. Furthermore, visible damage is assessed for the whole leaf, whereas fluorescence is monitored over comparatively small leaf areas, and thermocouples monitor an even smaller leaf area.
The best correlations of thermal analysis, fluorescence measurements and visible damage were found in N. menziesii (Figures 3--5). These relate to the highly septate nature of the leaf (Figure 1), which provides small, individual units that
Figure 4. Temperature response of tp/tp20 measured during cooling of
leaves of N. menziesii in May (four replicates). The cooling rate was 1 °C h−1. The lowest subfreezing temperature attained before the exothermic temperature increase, Tsc*, is indicated with an arrow, and
coincides with the temperature at which tp/tp20 starts to decline. The
temperature range (∆T) encompassing the decline is indicated by vertical dotted lines.
Figure 5. The temperature range, ∆T, over which tp/tp20 declines
measured on leaves of N. menziesii, P. eugenioides and G. littoralis
during natural hardening. The mean range is indicated by the black bar and its standard deviation by the open bar. The lethal temperature range (LT(i−100), i.e., the temperature range between LTi and LT100)
was determined by visual assessment of damage to the leaf blade 7 days after freezing.
Figure 3. Differential thermal analysis of leaves of N. menziesii,
P. eugenioides and G. littoralis measured in August. Three typical plots for each species are shown. Cooling rates were 1.5 °C min−1 for
N. menziesii and 1 °C h−1 for P. eugenioides and G. littoralis. Horizon-tal bars indicate the temperature range for the decline in fluorescence (tp/tp20): black bar represents the mean range and open bar its standard
freeze at random over a period of time. Consequently, a small segment of leaf is likely to be representative of the whole leaf. In contrast, in G. littoralis, damage can be initiated anywhere in the leaf blade so that a sensor might be in an area that was damaged earlier or later than the rest of the leaf, whereas in P. eugenioides, the leaf tips and edges are injured first, so that monitoring the middle of the leaf would fail to reveal the onset of damage. Furthermore, measurements of fluorescence and temperature are instantaneous, whereas visible injury is as-sessed after one week and is therefore a consequence of pri-mary events during freezing and the resultant death and decay of the cells. Despite these limitations, correspondence between the three methods was generally good and complementary in all three species, indicating that a combination of results from fluorescence measurements, thermal analysis and visible in-jury provides valuable information about the pattern of freez-ing in leaves.
Foliar frost resistance
Foliar frost resistance of all three species was within the range reported for evergreen broad-leaved trees from the Southern Hemisphere (Sakai et al. 1981). The foliar frost resistance of N. menziesii during summer (LTi = −5.3 °C) was slightly higher than that of another major timberline tree of New Zealand’s South Island, N. solandri var. cliffortioides (LTi of −3 to −5oC, Wardle and Campbell 1976). Adult trees of N. so-landri var. cliffortioides have midwinter LT0 and LTi values of −10 to −13 and −14 °C, respectively (Sakai et al. 1981, Wardle and Campbell 1976), whereas the midwinter LTi value in N. menziesii was only −8.3 °C. The only LT50 values reported for N. solandri var. cliffortioides are for seedlings (Greer et al. 1989) and range between −4.5 to −11.5 °C during winter depending on the altitude, and the maximum resistance is similar to the LT50 of −11.7 °C recorded in leaves from an adult tree of N. menziesii during winter (Figure 2).
Winter frost resistance of P. eugenioides leaves (LT50 of −10.7 °C) was similar to the LT50 of −8.8 °C recorded by Bannister et al. (1995) in leaves from trees in the Dunedin Town Belt, but was much greater than that found by Sakai and Wardle (1978), who reported an LT0 of −3 °C (in contrast to our LTi of −7.4 °C (Figure 3)), which they concluded was inconsistent with the widespread distribution of P. eugenioides in New Zealand. However, we found frost resistances for P. eugenioides that were similar to those of other widespread species and of other species of Pittosporum (e.g., Sakai and Wardle 1978, Warrington and Stanley 1987).
Foliar frost resistance of G. littoralis (LT50 = −10.6 °C) during midwinter is in good agreement with previous investi-gations (cf. Sakai and Wardle 1978, Bannister 1984a). The low LT50 value of −3.8 °C in summer might be related to leaf anatomy (Figure 1) that provides little opportunity for effective supercooling.
A total seasonal change in frost resistance of P. eugenioides of only 4 °C was low but is similar to cultivars of P. tenuifolium Banks & Soland. ex Gaertn. (Warrington and Stanley 1987). The increase in frost resistance for G. littoralis was 6.8 °C until August, which is slightly higher than that reported for other
native evergreen tree species. In N. menziesii, observed hard-ening was within the range reported for New Zealand species, but is lower than the 9--11 °C range reported for N. solandri var. cliffortioides (Wardle and Campbell 1976); however, our trees were from lowland sites, and the degree of hardening may be greater at high altitudes.
Frost resistance and species distribution
Sakai and Wardle (1978) related the winter frost resistance of many New Zealand species to their latitudinal and altitudinal distribution, whereas Read and Hill (1988) found no relation-ship between frost resistance and altitudinal distribution in Tasmanian forest trees, even when distribution within the can-opy was taken into account. The three species that we exam-ined showed differences in frost resistances that were more or less in accordance with their potential altitudinal distribution. Notofagus menziesii extends to the timberline and, as ex-pected, was the most frost resistant. Pittosporum eugenioides, which is confined to altitudes below about 600 m (Salmon 1980), was more frost resistant than G.littoralis, which may occur at the timberline (Wardle 1984). However, P. eugenioides is frequently found in more exposed areas, such as forest margins and river banks, whereas G. littoralis is often a subcanopy species.
It is possible that the species we examined were unable to develop their maximum potential frost resistance in the shel-tered lowland site where the experimental material was col-lected. Moreover, ecotypes with different frost tolerances may occur across the altitudinal and latitudinal ranges of these species, as has been observed in other native trees (cf. Hawkins et al. 1991, Reitsma 1994).
Nevertheless, the winter frost resistance of native New Zea-land trees is low and often near its potential maximum (Sakai et al. 1981, Greer et al. 1989, Bannister et al. 1995), thus small differences in frost resistance may be significant in determin-ing the survival of trees. We found that differences in leaf anatomy influenced the formation of ice and the pattern of frost injury in these three species. Further studies are needed to determine whether these findings have general validity.
Acknowledgments
G. Neuner was supported by a postdoctoral grant from the Austrian Government Department for Research and Science (BMWF). We thank W. Larcher, University of Innsbruck, for helpful suggestions and for providing two fluorometers, the New Zealand Department of Conservation for permission to collect samples in the Waipori Falls Scenic Reserve, and R. Gimpel, Botany Department, University of Otago, for cooperation in designing and constructing a mobile freez-ing chamber.
References
Bannister, P. 1984a. Winter frost resistance of leaves of some plants from the Three Kings Islands grown outdoors in Dunedin. N.Z. J. Bot. 22:303--306.
Bannister, P., C.M. Colhoun and P.E. Jameson. 1995. The winter hardening and foliar frost resistance of some New Zealand species of Pittosporum. N.Z. J. Bot. In press.
Burke, M.J.I., L.V. Gusta, H.A. Quamme, P.J. Weiser and P.H. Li. 1976. Freezing and injury in plants. Annu. Rev. Plant Physiol. 27:507--528.
Greer, D.H., P. Wardle and R.P. Buxton. 1989. Seasonal frost hardiness of Nothofagus solandri seedlings from two altitudinally diverse sites in Canterbury, New Zealand. N.Z. J. Bot. 27:299--304. Hawkins, B.J., G.B. Sweet, D.H. Greer and D.O. Bergin. 1991.
Ge-netic variation in the frost hardiness of Podocarpus totara. N.Z. J. Bot. 29:455--458.
Larcher, W. 1954. Die Kälteresistenz mediterraner immergrüner und ihre Beeinfluβbarkeit. Planta 44:607--635.
Larcher, W. 1964. Winterfrostschäden in den Parks und Gärten von Arco und Riva am Gardasee. Ferdinandeum, Innsbruck 43:153--199.
Larcher, W. 1982. Typology of freezing phenomena among vascular plants and evolutionary trends in frost acclimation. In Plant Cold Hardiness and Freezing Stress, Vol. II. Eds. P.H. Li and A. Sakai. Academic Press, London, New York, pp 417--426.
Larcher, W. 1985. Kälte und Frost. In Handbuch der Pflanzenkrank-heiten, vol I, 7th Edn. Ed. P. Sorauer. Parey, Berlin, pp 107--326. Larcher, W. 1994. In vitro fluorescence as a tool for non-invasive
investigation of freezing events. Chlorophyll Fluorescence News-letter 2:3--6.
Larcher, W. and A. Cernusca. 1985. Mikrocomputergesteuerte mobile Anlage zum fluorometrischen Nachweis von Photosynthesestörun-gen. Sitzungsber. österr. Akad. Wiss., Math.-naturw. Kl. I, 194:45--64.
Larcher, W., U. Meindl, E. Ralser and M. Ishikawa. 1991. Persistent supercooling and silica deposition in cell walls of palm leaves. J. Plant Physiol. 139:146--154.
Levitt, J. 1980. Responses of plants to environmental stresses. Vol. I: Chilling, freezing, and high temperature stresses. 2nd Edn. Aca-demic Press, London, New York, 497 p.
Lindgren, K. and J.E. Hällgren. 1993. Cold acclimation of Pinus contorta and Pinus sylvestris assessed by chlorophyll fluorescence. Tree Physiol. 13:97--106.
Lösch, R. and L. Kappen. 1981. The cold resistance of Macaronesian Sempervivoideae. Oecologia 50:98--102.
Metcalfe, C.R. and L. Chalk. 1979. Anatomy of the dicotyledons, Vol. I. 2nd Edn. Clarendon Press, Oxford, 276 p.
Napp-Zinn, K. 1973. Anatomie des Blattes. II. Blattanatomie der Angiospermen. A. Entwicklungsgeschichtliche und topographische Anatomie des Angiospermenblattes. In Handbuch der Pflan-zenanatomie. vol VIII/2A: Spezieller Teil (1. Lieferung). Ed. K. Linsbauer. Bornträger, Berlin, 218 p.
Olien, C.R. 1978. Analysis of freezing stresses and plant response. In
Plant Cold Hardiness and Freezing Stress. Mechanism and Crop Implications. Eds. P.H. Li and A. Sakai. Academic Press, New York, San Francisco, London, pp 37--48.
Read, J. and R.S. Hill. 1988. Comparative responses to temperature of the major canopy species of Tasmanian cool temperate rain forest tree species and their ecological significance. I. Foliar frost resis-tance. Aust. J. Bot. 36:131--143.
Reitsma, L. 1994. The frost resistance of some native plants from the Central Volcanic Plateau, North Island, New Zealand, in relation to plant succession. N.Z. J. Bot. 32:217--226.
Robberecht, R. and O. Junttila. 1992. The freezing response of an arctic cushion plant Saxifraga caespitosa L. Acclimation, freezing tolerance and ice nucleation. Ann. Bot. 70:129--135.
Sakai, A. and W. Larcher. 1987. Frost survival of plants. Responses and adaptation to freezing stress. Ecological Studies 62, Springer, Berlin, 321 p.
Sakai, A., D.M. Paton, and P. Wardle. 1981. Freezing resistance of trees of the south temperate zone, especially subalpine species of Australasia. Ecology 62:563--570.
Sakai, A. and P. Wardle. 1978. Freezing resistance of New Zealand trees and shrubs. N.Z. J. Ecol. 1:51--61.
Salmon, J.T. 1980. The native trees of New Zealand. Bradwell, Lon-don, Auckland, 384 p.
Wardle, J.A. 1984. The New Zealand beeches. Ecology, utilisation and management. N.Z. Forest Service, Caxton Press, Christchurch, 447 p.
Wardle, P. and A.D. Campbell. 1976. Seasonal cycle of tolerance to low temperature in three native woody plants in relation to their ecology and post-glacial history. Proc. N.Z. Ecol. Soc. 23:85--91. Warrington, I.J. and C.J. Stanley. 1987. Seasonal frost tolerance of