1
Port Efficiencies in Indonesia:
Lesson Learnt from Selected Ports
1by Titik Anas, Haryo Aswicahyono and Syareza Tobing
This Policy Research Paper was prepared for the Indonesia Services Dialogue under the USAID-SEADI project.
Indonesia’s ports were reported underperformed. Earlier studies tend to use one output, dwelling time to measure the port performance, such as World Bank (2013).
This policy brief offers another perspective on measuring the port performance using the Data Envelopment Analysis (DEA), which measures how efficient inputs used to get certain output. The advantage of this measure is it allows multiple inputs and multiple outputs in the model.
Indonesia’s Ports is Relatively Inefficient
We analyze 4 major ports, 2 Class 1 categories ports and 1 special port using two different models. First, Model 1 uses 2 outputs and 4 inputs. Second, Model 2 uses 1 output and 4 inputs. We compare the selected container terminals in the 7 ports to the ones in Singapore, Malaysia and Thailand.
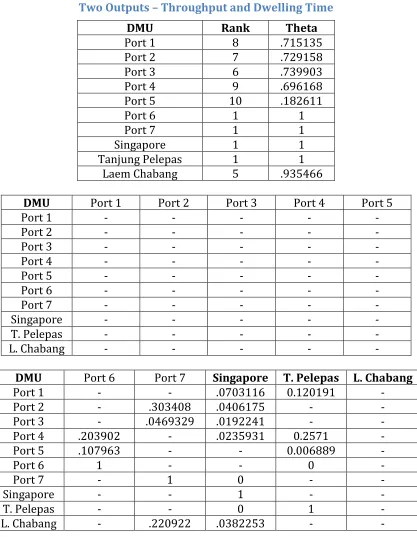
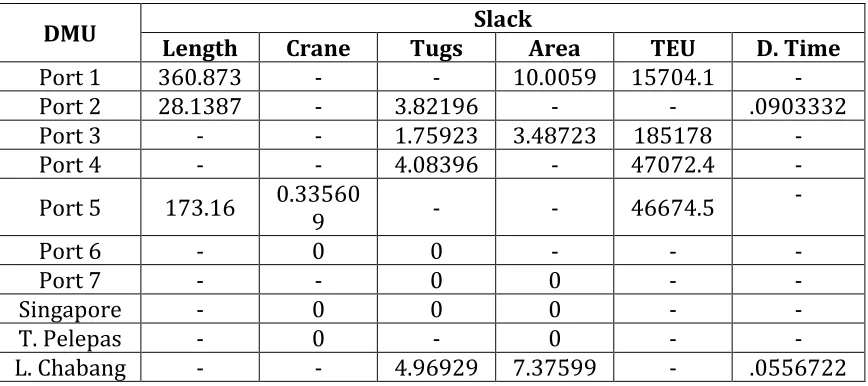
In the analysis, we use four inputs, main inputs used and available in all ports being compared. First, number of cranes used in each container terminal, which is considered the most fundamental equipment. Second, number of tug boats in each terminal. Third is the total length of berths in each container terminal. The last input would be the terminal area of the container terminal. As for output, there will be two different outputs considered. The first model will use two outputs (throughput and dwelling time). The second model uses only one output (throughput). Table 1 shows the results for Model 1 and Table 2 shows the results for Model 2.
Based on the results of the first model, Out of the 10 observed ports, four ports are evaluated as having been operated at an optimal level. With Singapore presumably being the reference, Tanjung Pelepas, Port 6 and Port 7 have managed to achieve an equal level of efficiency with Singapore with respect to their input.
Although operating below optimal level, Laem Chabang achieved a relatively high efficiency score of 93.5%, meaning that they should be able to achieve a their current level of output with 6.5% less input. Further improvement could be made in the management of Tug Boats and Container Terminal Area to reduce Dwelling Time.
1 This policy brief is made possible by CSIS-ERIA research on port efficiencies. Substantial
2 Four other Indonesian ports being assessed ranked 6 to 9 respectively in the efficiency ranking, with a relatively close efficiency score of 69%-74%. While crane operation has been efficient in each of these ports, better management in the inputs could be made to increase output.
Table 1 DEA Efficiency Results2 1
3
By comparing the efficiency rankings of the first and second model, it can be observed that the results of both models differ only slightly. Port 6, Port 7, Singapore and Tanjung Pelepas still places on top of the efficiency rankings, followed by Laem Chabang in the fifth spot.
Table 2 DEA Efficiency Results32
4 unloaded (throughput) and the length of time to get the goods to the ship or to the gate (dwelling time). The results show that most of Indonesia’s major ports are not operating at its optimal level.
5
Concluding Remarks
The DEA show that 5 out of 7 Indonesia’s ports being assessed are inefficient.
Port 7 is located in Free Trade Zone in which import goods rarely require custom clearance so it is expected that it is relatively efficient compared to the benchmark. Port 6, which is not in the Free Trade Zone is the only “normal’’ port that is relatively efficient compared to the other 5 ports. Some other factors might contribute to the efficiencies (shown in suboptimal output), among others are, pre clearance document processing, custom clearance, port and road congestion.
References
CSIS (2013), Port Services in Indonesia: An Assessment, Jakarta
Charnes, A., Cooper, W.W., Rhodes, E. (1978). Measuring the efficiency of decision making units. European Journal of Operational Research 429 – 444
Tongzon, J. (2001). Efficiency measurement of selected Australian and other international ports using data envelopment analysis. Transportation Research Part A 35
Appendix
Data Envelopment Analysis
DEA analysis provides a method to involve multiple inputs as well as multiple outputs to evaluate efficiency. Furthermore, DEA calculation are non-parametric and do not require explicit determination of inputs and outputs as well as rigid weight of the various factors being used.
Basically, the DEA attempts to create a relative efficiency measure based on a single virtual output and a single virtual input. Efficiency is determined by choosing Decision Management Units (DMUs) which are most efficient in transforming the virtual input into the virtual output. Formally, assume that there are n DMUs evaluated, where each DMU consumes varying amounts of m different inputs to produce s different outputs. More specifically, DMUj cosumes
Xj = xijamount of inputs while producing Yj = yrj outputs (r=1,...s).
The s x n matrix of output measures is denoted by Y while the m x n matrix is symbolized by X. With the assumption that xij > 0and yrj > 0, consider the
6 created, subject to the constraint that no DMU can have a relative efficiency score greater than one. Symbolically :
Where ur and vi assigned to output r and input i as weights, respectively.