62
Determination of Rock Type Using Hydraulic Flow Unit Concept to Predict
Permeability with Artificial Neural Network
(Penentuan Jenis Batuan Menggunakan Konsep Satuan Alir Hidrolik untuk Memperkirakan
Permeabilitas Dengan Jaringan Syaraf Tiruan)
Ghanima Yasmaniar, Ratnayu Sitaresmi, Suryo Prakoso Petroleum Engineering Department, Universitas Trisakti
Abstract
Permeability is one of the important of reservoir characteristics, but is difficult to predict it. The accurate permeability values can be obtained from core data analysis, but it is not possible to do at all of the well intervals in the field. This study used 191 sandstone core samples from the Upper Cibulakan Formation in the North West Java Basin. The concept of HFU (Hydraulic Flow Unit) developed by Kozeny-Carman is used to generate the relationship between porosity and permeability for each rock type. Afterward, to estimate the permeability value at uncored intervals, the statistical methods of artificial neural network based on log data are used on G-19 Well, G Field which is located in the North West Java Basin. Based on core data analysis from this research, the reservoir consists of eight HFU with different equations to estimate permeability for each HFU. From this reserarch, the results of permeability calculations at uncored intervals are not much different from the core data at the same depth. Therefore the approach of permeability prediction can be used to determine the value of permeability without performing core data analysis so that it can save the company expenses.
Keywords: Rock type, permeability, hydraulic flow unit, artificial neural network Sari
Permeabilitas adalah salah satu karakteristik reservoir yang penting, tetapi sukar untuk memperkirakannya. Nilai permeabilitas yang akurat dapat diperoleh dari analisis data core, akan tetapi tidak mungkin untuk melakukan untuk seluruh interval sumur di lapangan tersebut. Kajian menggunakan 191 contoh core batupasir dari Formasi Cibulakan Atas di Cekungan Jawa Barat Utara. Konsep SAH (Satuan Alir Hidrolik) yang dikembangkan oleh Kozeny-Carman digunakan untukmembuat hubungan antara porositas dan permeabilitas untuk tiap jenis batuan. Kemudian, untuk memperkirakan nilai permeabilitas pada interval yang tidak ada data core, metode statistika jaringan syaraf tiruan yaqng didasarkan pada data log digunakan pada Sumur G-19, Lapangan G yang terletak di Cekungan Jawa Barat Utara. Berdasarkan pada analisis data core dari penelitian ini, reservoir terdiri dari delapan SAH dengan persamaan berbeda untuk memperkirakan permeabilitas unbtuk tiap SAH. Dari penelitian ini, hasil perhitungan permeabilitas pada interval yang tidak ada data core tidak berbeda banyak dari data core pada kedalaman yang sama. Oleh karena itu, pendekatan perkiraan permeabilitas dapat digunakan untuk menentukan nilai permeabilitas tanpa melakukan analisis data core, sehingga dapat menghemat pengeluaran perusahaan.
Kata-kata kunci: Jenis batuan, permeabilitas, satuan alir hidrolik, jaringan syaraf tiruan
*Ghanima Yasmaniar (corresponding author): E-mail: [email protected] Tel: +62-82114603972
I. INTRODUCTION
Permeability is one of the physical properties of rock which is important because it relates to productivity and fluid flow from the reservoir. An accurate permeability value can be obtained from core data analysis. However, this analysis is not possible to do at all the well intervals in the field, so that permeability information becomes incomplete.
Amaefule (1993) had introduced the concept of HFU (Hydraulic Flow Unit) developed by Kozeny-Carman to classify rocks based on their rock type. Hydraulic flow unit is a basic element of the total volume of reservoir rock where its geological and petrophysical properties affect the distribution of reservoir zoning, each of which has a uniform fluid flow capacity and differs from the rest of the
reservoir volume (Amaefule, 1993).
From this HFU concept, the relationship between porosity and permeability will be generated by each rock type. If the relationship between porosity and permeability at each flow unit has been known, then the statistical method based on log data can be used to estimate permeability values in the uncored zones.
II. BASIC THEORY
Kozeny-Carman considers that the pore reservoir is an association of capillary tubes. Kozeny-Carman uses Poisseuille's Law (for flow in capillary tubes) and Darcy's Law (for flow in porous media), to acquire the relationship between porosity and permeability (Tiab and Donaldson, 2004).
the fluid element in the capillary tube is the same as the travel time of the fluid element in the volume unit in the reservoir (Amaefule, 1993) so that the following equation is obtained:
(
)
(1) Mean hydraulic radius (rmh) is a function of grain surface area per grain volume or specific surface (Sgv) and effective porosity . The relationship between the them is stated in the equation:
(
)
(
)
(2)
(
)
(3)If Equation (3) is substituted into Equation (1), then it is obtained:
[
]
(4)
Where k is in μm2
and in the fraction.
So that in general the Kozeny-Carman equation can be written as:
[
]
(5)
Where Fs is a shape factor (2 for cylinder models). Whereas τ is tortuosity which is the ratio of the distance traveled by the fluid on the porous media compared to the length of the reservoir or the sample. The value is referred as the Kozeny constant.
If Equation (5) is divided by then it is obtained:
√
*
+ [
√]
(6)
Where is k in μm2.
Then a new parameter is appeared named RQI (Reservoir Quality Index). RQI is defined as the degree of reservoir rock quality based on its permeability and effective porosity values (Amaefule and Altunbay, 1993), which are stated in the equation:
√
(7)Where k in mD and RQI is in μm2. If RQI is in units of mD, then Equation (7) becomes:
√
(8)There is also another parameter named which is defined as the ratio between the pore volume to the grain volume, which can be expressed in the equation:
(
)
(9)Equations (8) and (9) then generate a new parameter named FZI (Flow Zone Indicator) which can be expressed in the equation:
[
√
]
(10)
Then to do data grouping based on its flow unit, the following equation is used:
(11)
If in Equation (10) logarithms are added on both sides, the following equation is generated:
(12) In the log plots between RQI and , all data that have the same FZI value will fall on a line with a certain slope. Data samples that have different FZI values will fall on the other parallel lines. From this FZI equation, it can be seen that all samples from a straight line with a certain slope have the same pore channel attributes and will form a hydraulic unit (Amaefule and Altunbay, 1993).
III. METHOD
This study used 191 sandstone core samples from the Upper Cibulakan Formation in the North West Java Basin. From the core sample then rock type analysis is performed using the HFU (Hydraulic Flow Unit) concept developed by Kozeny-Carman.
After obtaining the relationship between porosity and permeability for each rock type, then the permebility prediction is performed at uncored intervals on the G-19 well. The permeability value is estimated by applying the artificial neural network statistical method using Petrel software.
III. DATA ANALYSIS
The determination of HFU is obtained by applying the Kozeny-Carman approach using available data cores. After calculation, it is known that the analyzed reservoir consists of eight different HFUs. The relationship between porosity and permeability for each flow unit can be seen in Figure 1 below.
64
Figure 1. Porosity vs Permeability Relationships For Each HFU
The empirical equation generated by each HFU based on the relationship between porosity and permeability can be seen in Table 1 below, where x is porosity and y is permeability.
Table 1. Empirical Equations of Porosity and Permeability Relationships for Each HFU
HFU
Empirical Equation1
y = 1E+07x
8,3942
y = 19.8170 x
4,8793
y = 15.918x
3,4814
y = 5.064,7 x
3,4795
y = 1.759,9 x
3,3166
y = 840,51 x
3,5527
y = 450,54 x
3,7188
y = 87,244 x
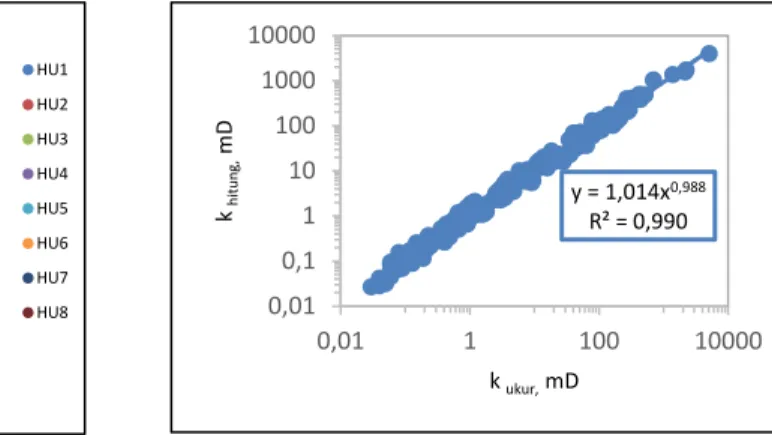
3,325Thus, if the HFU group can be determined, the permeability value can be calculated using the equation that shown in Table 1 above. To test the accuracy of permeability results, a comparison between the permeability values based on the equations of each HFU and the permeability value of the core data can be seen in Figure 2 below. From Figure 2, it can be seen that the results of permeability estimation using the HFU approach generate a good result, as seen from the R2 correlation coefficient of 0.990 which is relatively close to one, and the trendline formed coincides with the line y = x. After validation on the results of the permeability calculation, then the tabulation of the smallest, largest, and average value for each HFU was made which can be seen in Table 2 below.
Figure 2. Permeability Validation Based on the Kozeny-Carman Approach to Data Core
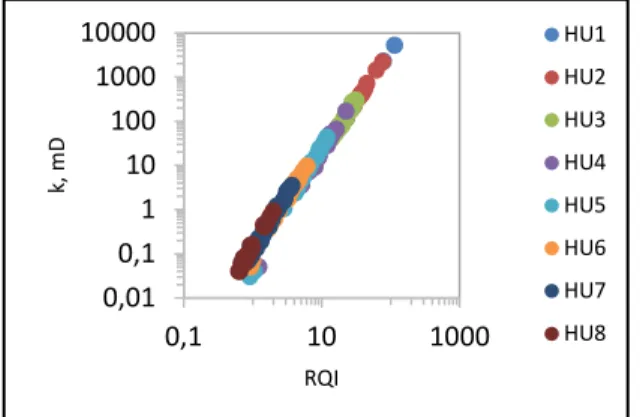
From the results of the tabulation above, it is known that a good HFU, which is a small HFU number, has a higher permeability value than a low quality HFU, which causes fluid to flow faster and the reservoir quality index gets better. This is in line with the relationship generated between RQI and permeability which can be seen in Figure 3 below.
Table 2. The Smallest, Largest, and Average Permeability Value for Each HFU
HFU Permeabilitas, mD
Min Max Mean
1 2258.000 5153.000 3705.500 2 112.000 2191.000 650.182 3 40.500 298.000 134.656 4 0.050 168.000 26.499 5 0.030 43.000 12.412 6 0.050 9.550 2.946 7 0.060 3.500 0.763 8 0.040 0.920 0.191
Figure 3 shows that RQI is directly proportional to the value of permeability, and the prices of both will be better as the quality of HFU is better. Then, to get the estimated value of permeability at uncored intervals, the calculations were performed using artificial neural network methods using Petrel software. The calculation is carried out on G-19 Well, G Field that located in the North West Java Basin. This method is obtained by building a FZI model database based on its relationship with existing log data, such as Vshale, SP log, and porosity using Petrel software. After obtaining the FZI number, then the determination of the HFU owned by the G-19 Well was made. After that, permeability calculations were carried out based on the equations resulting from the relationship between porosity and permebility in each HFU listed in Table 1.
0,01 0,1 1 10 100 1000 10000 0 0,1 0,2 0,3 0,4 0,5 P er m eab ili tas , m D Porositas HU1 HU2 HU3 HU4 HU5 HU6 HU7 HU8 y = 1,014x0,988 R² = 0,990 0,01 0,1 1 10 100 1000 10000 0,01 1 100 10000 k hi tun g, mD k ukur, mD
Figure 3. RQI vs Permeability Relations
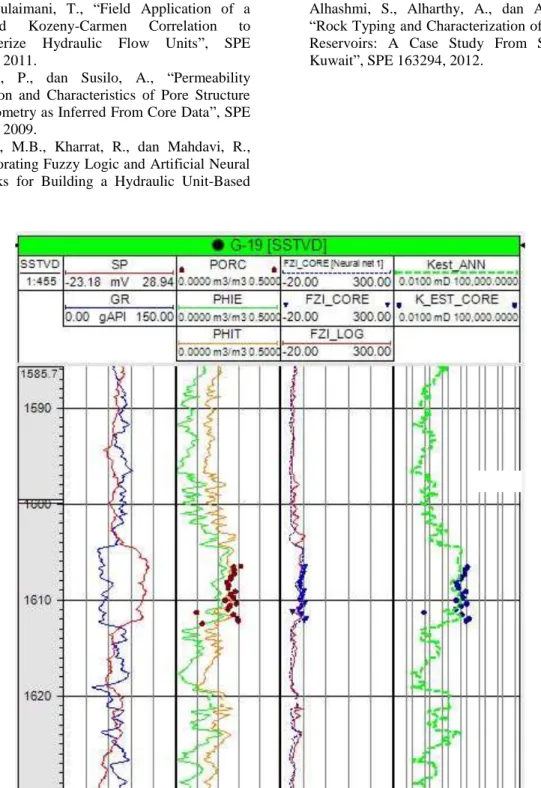
To test the accuracy of the permeability results obtained, a comparison between the permeability values obtained from the artificial neural network process with the value of the core data at the same depth can be seen in Figure 4 below.
Figure 4. Validation of Calculation of Permeability in G-19 Well
From Figure 4 above, it can be seen that the results of permeability estimation using aritifial neural networks are not much different from the core data at the same depth, and after compared with the line y=x, the resulting point is relatively close to the line which indicates that the value produced not much different. For the results of the calculation of permeability generated in the log section can be seen in the Appendix.
IV. CONCLUSIONS
1. From the analysis of 191 core data for the Upper Cibulakan Formation in the North West Java Basin, eight different HFUs were obtained with each equation for estimating different permeability values.
2. The better the HFU, the greater the average permeability obtained, so that the fluid flows
3. Validation of the permeability value between the HFU approach and core data generates a good value which is indicated by the R2 correlation coefficient of 0.990 which is relatively close to one.
4. The results of permeability calculations at uncored intervals using artificial neural networks produce values that are not much different from core data at the same depth after compared with the y=x line in the validation process.
5. Permeability predictions made at uncored intervals using the artificial neural network method can provide benefits to companies that it can determine the value of permeability without coring and its analysis.
ACKNOWLEDGEMENT
The author would like to thank to BATM (Badan Afiliasi Teknologi Mineral) Universitas Trisakti that have given the opportunity to the author to conduct research and data processing that supports this research.
NOMENCLATURE
= Effective porosity, fraction = Tortuosity, dimensionless Fs = Shape factor, dimensionless k = Permeability, mD
rmh = Mean hydraulic radius, m Sgv = Specific surface area, m-1 REFERENCES
1. Abbaszadeh, M., Fuji, H., and Fujimoto, F., “Permeability Prediction by Hydraulic Flow Units – Theory and Applications”, SPE 30158, 1996.
2. Amaefule, J.O. and Altunbay, M., “Enhanched Reservoir Description: Using Core and Log Data to Identify Hydraulic (Flow) Units and Predict Permeability in Uncored Intervals/Wells”, SPE 26436, 1993.
3. Aminian, K., Ameri, S., Oyerokun, A., dan Thomas, B., “Prediction of Flow Units and Permeability Using Artificial Neural Networks”, SPE 83586, 2003.
4. Chekani, M., “Reservoir Rock Typing in Carbonate Reservoir-Cooperation of Core and Log Data: Case Study”, SPE 123703, 2009. 5. Gomes, J.S., Ribeiro, M.T., Strohmenger, C.J.,
Negahban, S., dan Kalam, M.Z., “Carbonate Reservoir Rock Typing – The Link Between Geology and SCAL”, SPE 118284, 2008.
6. Guo, G., Diaz, M.A., Paz, F., Smalley, J., dan Waninger, E.A., “Rock Typing as an Effective Tool for Permeability and Water Saturation Modeling: A Case Study in Clastic Reservoir in the Oriente Basin”, SPE 97033, 2005.
7. Kohli, A., dan Arora, P., “Application of Artificial Neural Networks for Well Logs”, IPTC 17475, 2014. 0,01 0,1 1 10 100 1000 10000 0,1 10 1000 k, m D RQI HU1 HU2 HU3 HU4 HU5 HU6 HU7 HU8 y=x
66 8. Michel, R., dan Bruno, L., “Rock Typing in
Carbonates: A Critical Review of Clustering Methods”, SPE-171759-MS, 2014.
9. Mortensen, J., Engstrom, F., dan Lind, I., “The Relation Among Porosity, Permeability, and Specific Surface of Chalk From the Gorm Fiels, Danish North Sea”, SPE 31062, 1998.
10. Nooruddin, H., Hossain, M.E., Sudirman, S.B., dan Sulaimani, T., “Field Application of a Modified Kozeny-Carmen Correlation to Characterize Hydraulic Flow Units”, SPE 149047, 2011.
11. Permadi, P., dan Susilo, A., “Permeability Prediction and Characteristics of Pore Structure and Geometry as Inferred From Core Data”, SPE 125350, 2009.
12. Shahvar, M.B., Kharrat, R., dan Mahdavi, R., “Incorporating Fuzzy Logic and Artificial Neural Networks for Building a Hydraulic Unit-Based
Model for Permeability Prediction of a Heterogeneous Carbonate Reservoir”, IPTC 13732, 2009.
13. Tiab, D., dan Donaldson, E.C., “Petrophysics – Theory and Practice of Measuring Reservoir Rock and Fluid Transport Properties”, Gulf Professional Publishing, Oxford, 2004.
14. Turkey, S., Alkanderi, J., Kumar, P., Alalawi, G., Alhashmi, S., Alharthy, A., dan Alraisi, M., “Rock Typing and Characterization of Carbonate Reservoirs: A Case Study From South East Kuwait”, SPE 163294, 2012.