LAMPIRAN
Lampiran 1. SNI Cookies
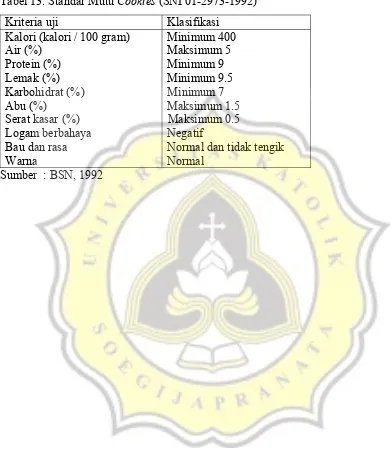
Tabel 13. Standar Mutu Cookies (SNI 01-2973-1992)
Kriteria uji Klasifikasi
Kalori (kalori / 100 gram) Minimum 400
Air (%) Maksimum 5
Protein (%) Minimum 9
Lemak (%) Minimum 9.5
Karbohidrat (%) Minimum 7
Abu (%) Maksimum 1.5
Serat kasar (%) Maksimum 0.5
Logam berbahaya Negatif
Bau dan rasa Normal dan tidak tengik
Warna Normal
Sumber : BSN, 1992
Lampiran 2. Kuesioner Evaluasi Sensoris
UJI RANKING HEDONIK
Nama : Tanggal :
Produk : cookies
Atribut : warna
Instruksi :
Di hadapan Anda terdapat 4 sampel cookies. Amatilah sampel secara berurutan dari kiri
ke kanan. Setelah mengamati semua sampel, Anda boleh mengulang sesering yang
Anda perlukan. Urutkan sampel dari yang warnanya paling Anda sukai (= 4) hingga
yang paling kurang Anda sukai (= 1).
Kode sampel Ranking (tidak boleh dobel)
Terima kasih
UJI RANKING HEDONIK
Nama : Tanggal :
Produk : cookies
Atribut : rasa
Instruksi :
Di hadapan Anda terdapat 4 sampel cookies. Cicipilah sampel secara berurutan dari kiri
ke kanan. Minumlah air setiap kali akan berganti sampel. Setelah merasakan semua
sampel, Anda boleh mengulang sesering yang Anda perlukan. Urutkan sampel dari yang
rasanya paling Anda sukai (= 4) hingga yang paling kurang Anda sukai (= 1).
Kode sampel Ranking (tidak boleh dobel)
Terima kasih
UJI RANKING HEDONIK
Nama : Tanggal :
Produk : cookies
Atribut : aroma
Instruksi :
Di hadapan Anda terdapat 4 sampel cookies. Ciumlah sampel secara berurutan dari kiri
ke kanan. Setelah mencium semua sampel, Anda boleh mengulang sesering yang Anda
perlukan. Urutkan sampel dari yang aromanya paling Anda sukai (= 4) hingga yang
paling kurang Anda sukai (= 1).
Kode sampel Ranking (tidak boleh dobel)
Terima kasih
UJI RANKING HEDONIK
Nama : Tanggal :
Produk : cookies
Atribut : tekstur
Instruksi :
Di hadapan Anda terdapat 4 sampel cookies. Gigitlah sampel secara berurutan dari kiri
ke kanan. Setelah menggigit semua sampel, Anda boleh mengulang sesering yang Anda
perlukan. Urutkan sampel dari yang teksturnya paling Anda sukai (= 4) hingga yang
paling kurang Anda sukai (= 1).
Kode sampel Ranking (tidak boleh dobel)
Terima kasih
UJI RANKING HEDONIK
Nama : Tanggal :
Produk : cookies
Atribut : overall
Instruksi :
Di hadapan Anda terdapat 4 sampel cookies. Amati sampel secara berurutan dari kiri ke
kanan. Setelah mengamati semua sampel, Anda boleh mengulang sesering yang Anda
perlukan. Urutkan sampel dari yang paling Anda sukai (= 4) hingga yang paling kurang
Anda sukai (= 1).
Kode sampel Ranking (tidak boleh dobel)
Terima kasih
Lampiran 3. Kurva Standar β-Karoten
Konsentrasi (ppm) Absorbansi
2,2
4,4
8,8
13,2
17,6
22
0,0400
0,0731
0,1303
0,2084
0,3049
0,0053
Lampiran 4. Perhitungan Umur Simpan
Contoh perhitngan umur simpan :
Dalam penelitian ini digunakan temperatur 40°C dengan RH 90% selama 28 hari, maka
bila dikonversikan pada suhu kamar (25°C) menjadi :
Q = 2
ts = 28 hari
suhu ruang (T1) = 25°C
suhu ASLT (T2) = 40°C
δT = T2-T1 = 40°C - 30°C = 10°C ts (T1) = ts (T2) x Q δT/10
= 28 hari x 2 10/10
= 28 hari x 2
= 56 hari
= 8 minggu
Lampiran 5. Hasil Analisa SPSS
Tests of Normality
.146 6 .200* .956 6 .786
.221 6 .200* .955 6 .780
.193 6 .200* .924 6 .533
.232 6 .200* .876 6 .251
.180 6 .200* .945 6 .698
.175 6 .200* .957 6 .797
.249 6 .200* .949 6 .732
.181 6 .200* .936 6 .629
.244 6 .200* .953 6 .768
.193 6 .200* .983 6 .966
.185 6 .200* .938 6 .645
.195 6 .200* .872 6 .233
.227 6 .200* .890 6 .317
.320 6 .055 .717 6 .009
.193 6 .200* .914 6 .466
.201 6 .200* .908 6 .426
.244 6 .200* .903 6 .394
.185 6 .200* .974 6 .918
.186 6 .200* .961 6 .828
.214 6 .200* .958 6 .804
.249 6 .200* .892 6 .331
.174 6 .200* .951 6 .748
.191 6 .200* .937 6 .638
.226 6 .200* .912 6 .452
.215 6 .200* .898 6 .364
.146 6 .200* .982 6 .960
.203 6 .200* .934 6 .613
.183 6 .200* .940 6 .660
.167 6 .200* .938 6 .646
.229 6 .200* .896 6 .349
.185 6 .200* .961 6 .824
.185 6 .200* .972 6 .902
.190 6 .200* .893 6 .336
.196 6 .200* .871 6 .230
.288 6 .132 .885 6 .291
.240 6 .200* .858 6 .183
.312 6 .070 .852 6 .164
.263 6 .200* .841 6 .132
.247 6 .200* .903 6 .394
.206 6 .200* .907 6 .414
.303 6 .091 .887 6 .304
.166 6 .200* .951 6 .750
.210 6 .200* .926 6 .551
.167 6 .200* .957 6 .799
.203 6 .200* .971 6 .898
.254 6 .200* .809 6 .071
.203 6 .200* .938 6 .645
.220 6 .200* .957 6 .796
.256 6 .200* .828 6 .104
.207 6 .200* .869 6 .223
.272 6 .187 .856 6 .175
.248 6 .200* .858 6 .182
.193 6 .200* .952 6 .759
.223 6 .200* .910 6 .438
.143 6 .200* .979 6 .945
.159 6 .200* .968 6 .880
.213 6 .200* .884 6 .288
.223 6 .200* .891 6 .322
.203 6 .200* .890 6 .317
.248 6 .200* .905 6 .407
.288 6 .130 .772 6 .032
.168 6 .200* .980 6 .953
.263 6 .200* .851 6 .159
.308 6 .077 .871 6 .231
perlakuan kontrol 15 kontrol 18 kontrol 20 adonan kontrol 30% 15 30% 18 30% 20 adonan 30% 40% 15 40% 18 40% 20 adonan 40% 50% 15 50% 18 50% 20 adonan 50% kontrol 15 kontrol 18 kontrol 20 adonan kontrol 30% 15 30% 18 30% 20 adonan 30% 40% 15 40% 18 40% 20 adonan 40% 50% 15 50% 18 50% 20 adonan 50% kontrol 15 kontrol 18 kontrol 20 adonan kontrol 30% 15 30% 18 30% 20 adonan 30% 40% 15 40% 18 40% 20 adonan 40% 50% 15 50% 18 50% 20 adonan 50% kontrol 15 kontrol 18 kontrol 20 adonan kontrol 30% 15 30% 18 30% 20 adonan 30% 40% 15 40% 18 40% 20 adonan 40% 50% 15 50% 18 50% 20 adonan 50% vit_A angka_TBA antioksidan lemak
Statistic df Sig. Statistic df Sig.
Kolmogorov-Smirnov a Shapiro-Wilk
This is a lower bound of the true significance. *.
Lilliefors Significance Correction a.
Normalitas Uji Fisik
Tests of Normality
.225 6 .200* .863 6 .199
.186 6 .200* .971 6 .899
.217 6 .200* .897 6 .355
.313 6 .067 .756 6 .023
.163 6 .200* .946 6 .710
.268 6 .200* .858 6 .184
.176 6 .200* .971 6 .902
.308 6 .077 .790 6 .047
.196 6 .200* .934 6 .612
.203 6 .200* .897 6 .354
.318 6 .057 .880 6 .269
.201 6 .200* .961 6 .826
.227 6 .200* .879 6 .264
.137 6 .200* .969 6 .883
.184 6 .200* .906 6 .409
.183 6 .200* .899 6 .370
.199 6 .200* .936 6 .624
.229 6 .200* .841 6 .133
.184 6 .200* .975 6 .924
.316 6 .062 .792 6 .050
.173 6 .200* .927 6 .559
.234 6 .200* .939 6 .647
.257 6 .200* .906 6 .411
.163 6 .200* .967 6 .875
.186 6 .200* .956 6 .790
.288 6 .132 .871 6 .229
.139 6 .200* .991 6 .990
.220 6 .200* .946 6 .707
.256 6 .200* .851 6 .161
.305 6 .086 .727 6 .012
.294 6 .115 .810 6 .072
.193 6 .200* .910 6 .439
.182 6 .200* .944 6 .692
.249 6 .200* .870 6 .228
.287 6 .134 .830 6 .109
.210 6 .200* .917 6 .487
.403 6 .003 .595 6 .000
.187 6 .200* .903 6 .392
.174 6 .200* .958 6 .802
.228 6 .200* .932 6 .599
.231 6 .200* .899 6 .366
.233 6 .200* .868 6 .218
.227 6 .200* .900 6 .373
.202 6 .200* .927 6 .556
.173 6 .200* .937 6 .638
.248 6 .200* .932 6 .594
.185 6 .200* .916 6 .477
.222 6 .200* .876 6 .252
.275 6 .177 .780 6 .039
.258 6 .200* .934 6 .612
.263 6 .200* .887 6 .301
.167 6 .200* .954 6 .770
.183 6 .200* .929 6 .573
.260 6 .200* .897 6 .356
.187 6 .200* .936 6 .624
.220 6 .200* .922 6 .519
.298 6 .104 .814 6 .078
.192 6 .200* .886 6 .300
.191 6 .200* .931 6 .588
.179 6 .200* .891 6 .321
.242 6 .200* .869 6 .223
.263 6 .200* .897 6 .356
.229 6 .200* .881 6 .275
.179 6 .200* .964 6 .847
perlakuan kontrol 15 kontrol 18 kontrol 20 adonan kontrol 30% 15 30% 18 30% 20 adonan 30% 40% 15 40% 18 40% 20 adonan 40% 50% 15 50% 18 50% 20 adonan 50% kontrol 15 kontrol 18 kontrol 20 adonan kontrol 30% 15 30% 18 30% 20 adonan 30% 40% 15 40% 18 40% 20 adonan 40% 50% 15 50% 18 50% 20 adonan 50% kontrol 15 kontrol 18 kontrol 20 adonan kontrol 30% 15 30% 18 30% 20 adonan 30% 40% 15 40% 18 40% 20 adonan 40% 50% 15 50% 18 50% 20 adonan 50% kontrol 15 kontrol 18 kontrol 20 adonan kontrol 30% 15 30% 18 30% 20 adonan 30% 40% 15 40% 18 40% 20 adonan 40% 50% 15 50% 18 50% 20 adonan 50% hardness lightness a b
Statistic df Sig. Statistic df Sig.
Kolmogorov-Smirnov a Shapiro-Wilk
This is a lower bound of the true significance. *.
Lilliefors Significance Correction a.
Normalitas Variabel Baking loss
Tests of Normality
.217 6 .200* .900 6 .371
.206 6 .200* .967 6 .869
.204 6 .200* .960 6 .822
.339 6 .030 .784 6 .042
.240 6 .200* .886 6 .299
.171 6 .200* .930 6 .582
.187 6 .200* .933 6 .604
.265 6 .200* .927 6 .556
.143 6 .200* .975 6 .922
.265 6 .200* .870 6 .225
.165 6 .200* .965 6 .856
.143 6 .200* .978 6 .942
perlakuan kontrol 15 mnt kontrol 18 mnt kontrol 20 mnt 30% CPO 15 mn 30% CPO 18 mn 30% CPO 20 mn 40% CPO 15 mn 40% CPO 18 mn 40% CPO 20 mn 50% CPO 15 mn 50% CPO 18 mn 50% CPO 20 mn baking_loss
Statistic df Sig. Statistic df Sig.
Kolmogorov-Smirnova Shapiro-Wilk
This is a lower bound of the true significance. *.
Lilliefors Significance Correction a.
Normalitas Uji Kimia Hari ke-7
Tests of Normality
.167 6 .200* .981 6 .956
.167 6 .200* .982 6 .960
.296 6 .109 .905 6 .406
.165 6 .200* .976 6 .933
.115 6 .200* .996 6 .998
.167 6 .200* .960 6 .817
.238 6 .200* .950 6 .737
.183 6 .200* .940 6 .660
.163 6 .200* .930 6 .577
.167 6 .200* .928 6 .565
.149 6 .200* .969 6 .888
.202 6 .200* .898 6 .362
perlakuan kontrol 18 30% 18 40% 18 50% 18 kontrol 18 30% 18 40% 18 50% 18 kontrol 18 30% 18 40% 18 50% 18 vit_A
angka_TBA
antioksidan
Statistic df Sig. Statistic df Sig.
Kolmogorov-Smirnova Shapiro-Wilk
This is a lower bound of the true significance. *.
Lilliefors Significance Correction a.
Normalitas Uji Kimia Hari ke-14
Tests of Normality
.230 6 .200* .953 6 .763
.273 6 .184 .823 6 .094
.170 6 .200* .952 6 .760
.157 6 .200* .967 6 .874
.122 6 .200* .982 6 .961
.248 6 .200* .871 6 .230
.302 6 .092 .867 6 .215
.172 6 .200* .954 6 .772
.270 6 .195 .923 6 .529
.301 6 .094 .865 6 .205
.223 6 .200* .891 6 .322
.150 6 .200* .977 6 .937
perlakuan kontrol 18 30% 18 40% 18 50% 18 kontrol 18 30% 18 40% 18 50% 18 kontrol 18 30% 18 40% 18 50% 18 vit_A
angka_TBA
antioksidan
Statistic df Sig. Statistic df Sig.
Kolmogorov-Smirnova Shapiro-Wilk
This is a lower bound of the true significance. *.
Lilliefors Significance Correction a.
Normalitas Uji Kimia Hari ke-21
Tests of Normality
.226 6 .200* .878 6 .260
.214 6 .200* .958 6 .804
.167 6 .200* .941 6 .671
.193 6 .200* .947 6 .718
.215 6 .200* .901 6 .380
.289 6 .128 .853 6 .165
.197 6 .200* .861 6 .194
.204 6 .200* .918 6 .493
.174 6 .200* .962 6 .838
.243 6 .200* .962 6 .834
.146 6 .200* .988 6 .983
.101 6 .200* .996 6 .999
perlakuan kontrol 18 30% 18 40% 18 50% 18 kontrol 18 30% 18 40% 18 50% 18 kontrol 18 30% 18 40% 18 50% 18 vit_A
angka_TBA
antioksidan
Statistic df Sig. Statistic df Sig.
Kolmogorov-Smirnova Shapiro-Wilk
This is a lower bound of the true significance. *.
Lilliefors Significance Correction a.
Normalitas Uji Kimia Hari ke-28
Tests of Normality
.216 6 .200* .938 6 .643
.257 6 .200* .867 6 .214
.241 6 .200* .903 6 .389
.164 6 .200* .939 6 .648
.143 6 .200* .989 6 .987
.187 6 .200* .969 6 .885
.219 6 .200* .941 6 .667
.121 6 .200* .983 6 .964
.117 6 .200* .984 6 .969
.220 6 .200* .859 6 .184
.161 6 .200* .957 6 .797
.196 6 .200* .918 6 .489
perlakuan kontrol 18 30% 18 40% 18 50% 18 kontrol 18 30% 18 40% 18 50% 18 kontrol 18 30% 18 40% 18 50% 18 vit_A
angka_TBA
antioksidan
Statistic df Sig. Statistic df Sig.
Kolmogorov-Smirnova Shapiro-Wilk
This is a lower bound of the true significance. *.
Lilliefors Significance Correction a.
Vitamin A
Tests of Between-Subjects Effects
Dependent Variable: vitamin_A
1967622.161a 6 327937.027 1923.925 .000
14166373.3 1 14166373.31 83110.602 .000 1902475.467 3 634158.489 3720.451 .000 65146.694 3 21715.565 127.400 .000 15170.233 89 170.452
16149165.7 96 1982792.394 95 Source
Corrected Model Intercept persen_CPO waktu_oven Error Total
Corrected Total
Type III Sum
of Squares df Mean Square F Sig.
R Squared = .992 (Adjusted R Squared = .992) a.
Post Hoc Tests
persen_CPO
Homogeneous Subsets
vitamin_A
Duncan a,b
24 151.69096
24 409.54238
24 447.95463
24 527.38688
1.000 1.000 1.000 1.000
persen_CPO 0% 30% 40% 50% Sig.
N 1 2 3 4
Subset
Means for groups in homogeneous subsets are displayed. Based on Type III Sum of Squares
The error term is Mean Square(Error) = 170.452. Uses Harmonic Mean Sample Size = 24.000. a.
waktu_oven
Homogeneous Subsets
vitamin_A
Duncana,b
24 352.54792
24 368.64871
24 394.13763
24 421.24058 1.000 1.000 1.000 1.000 waktu_oven
20 mnt 18 mnt 15 mnt 0 mnt Sig.
N 1 2 3 4
Subset
Means for groups in homogeneous subsets are displayed. Based on Type III Sum of Squares
The error term is Mean Square(Error) = 170.452. Uses Harmonic Mean Sample Size = 24.000. a.
Alpha = .05. b.
Aktivitas Antioksidan
Tests of Between-Subjects Effects
Dependent Variable: antioksidan
6115.574a 6 1019.262 1550.475 .000
88716.442 1 88716.442 134953.1 .000
5529.226 3 1843.075 2803.638 .000
586.348 3 195.449 297.312 .000
58.507 89 .657
94890.523 96
6174.081 95
Source
Corrected Model Intercept persen_CPO waktu_oven Error Total
Corrected Total
Type III Sum
of Squares df Mean Square F Sig.
R Squared = .991 (Adjusted R Squared = .990) a.
Post Hoc Tests
persen_CPO
Homogeneous Subsets
antioksidan
Duncan a,b
24 21.61529
24 24.52413
24 35.35754
24 40.10104
1.000 1.000 1.000 1.000
persen_CPO 0%
30% 40% 50% Sig.
N 1 2 3 4
Subset
Means for groups in homogeneous subsets are displayed. Based on Type III Sum of Squares
The error term is Mean Square(Error) = .657. Uses Harmonic Mean Sample Size = 24.000. a.
Alpha = .05. b.
aktu_oven
s Subsets
w
Homogeneou
antioksidan
Duncana,b
24 27.08613
24 29.41504
24 31.27408
24 33.82275
1.000 1.000 1.000 1.000 waktu_oven
20 mnt 18 mnt 15 mnt 0 mnt Sig.
N 1 2 3
Subset
4
Means for groups in homogeneous subsets are displayed. Based on Type III Sum of Squares
The error term is Mean Square(Error) = .657. Uses Harmonic Mean Sample Size = 24.000. a.
Alpha = .05. b.
Lemak
Tests of Between-Subjects Effects
Dependent Variable: lemak
25.722a 6 4.287 8.296 .000
31914.059 1 31914.059 61760.484 .000
11.285 3 3.762 7.280 .000
14.437 3 4.812 9.313 .000
45.990 89 .517
31985.771 96
71.712 95
Source
Corrected Model Intercept persen_CPO waktu_oven Error Total
Corrected Total
Type III Sum
of Squares df Mean Square F Sig.
R Squared = .359 (Adjusted R Squared = .315) a.
Post Hoc Tests
persen_CPO
Homogeneous Subsets
lemak
Duncana,b
24 17.85725
24 18.01213 18.01213 24 18.30467
24 18.75750 .457 .162 1.000 persen_CPO
0% 30% 40% 50% Sig.
N 1 2
Subset
3
Means for groups in homogeneous subsets are displayed. Based on Type III Sum of Squares
The error term is Mean Square(Error) = .517. Uses Harmonic Mean Sample Size = 24.000. a.
waktu_oven
Homogeneous Subsets
lemak
Duncan a,b
24 17.59996
24 18.30558
24 18.37383
24 18.65217
1.000 .118
waktu_oven 0 mnt 15 mnt 18 mnt 20 mnt Sig.
N 1 2
Subset
Means for groups in homogeneous subsets are displayed. Based on Type III Sum of Squares
The error term is Mean Square(Error) = .517. Uses Harmonic Mean Sample Size = 24.000. a.
Alpha = .05. b.
Angka TBA
Tests of Between-Subjects Effects
Dependent Variable: angka_TBA
.518a 6 .086 80.729 .000
3.766 1 3.766 3517.803 .000
.108 3 .036 33.635 .000
.410 3 .137 127.823 .000
.095 89 .001
4.379 96
.614 95
Source
Corrected Model Intercept persen_CPO waktu_oven Error Total
Corrected Total
Type III Sum
of Squares df Mean Square F Sig.
R Squared = .845 (Adjusted R Squared = .834) a.
Post Hoc Tests
persen_CPO
Homogeneous Subsets
angka_TBA
Duncan a,b
24 .14004
24 .21475
24 .21746
24 .21996
1.000 .608
persen_CPO 30% 50% 0% 40% Sig.
N 1 2
Subset
Means for groups in homogeneous subsets are displayed. Based on Type III Sum of Squares
The error term is Mean Square(Error) = .001. Uses Harmonic Mean Sample Size = 24.000. a.
Homogeneous Subsets
waktu_oven
angka_TBA
Duncana,b
24 .11638
24 .15725
24 .23413
24 .28446
1.000 1.000 1.000 1.000 waktu_oven
0 mnt 18 mnt 15 mnt 20 mnt Sig.
N 1 2 3 4
Subset
Means for groups in homogeneous subsets are displayed. Based on Type III Sum of Squares
The error term is Mean Square(Error) = .001. Uses Harmonic Mean Sample Size = 24.000. a.
Alpha = .05. b.
Vitamin A selama Penyimpanan
Tests of Between-Subjects Effects
Dependent Variable: vitamin_A
2072212.115a 7 296030.302 976.517 .000
13496226.5 1 13496226.50 44520.076 .000
1965911.202 3 655303.734 2161.654 .000
106300.912 4 26575.228 87.664 .000
33952.713 112 303.149
15602391.3 120
2106164.828 119
Source
Corrected Model Intercept persen_CPO umur.simpan Error Total
Corrected Total
Type III Sum
of Squares df Mean Square F Sig.
R Squared = .984 (Adjusted R Squared = .983) a.
Post Hoc Tests
persen_CPO
Homogeneous Subsets
vitamin_A
Duncan a,b
30 128.97543
30 338.23883
30 403.82157
30 470.41743
1.000 1.000 1.000 1.000
persen_CPO 0% 30% 40% 50% Sig.
N 1 2 3 4
Subset
Means for groups in homogeneous subsets are displayed. Based on Type III Sum of Squares
The error term is Mean Square(Error) = 303.149. Uses Harmonic Mean Sample Size = 30.000. a.
waktu.simpan
Homogeneous Subsets
vitamin_A
Duncan a,b
24 290.09192
24 315.48300
24 337.71654
24 364.87642
24 368.64871
1.000 1.000 1.000 .455
umur.simpan hari ke 28 hari ke 21 hari ke 14 hari ke 7 hari ke 0 Sig.
N 1 2 3 4
Subset
Means for groups in homogeneous subsets are displayed. Based on Type III Sum of Squares
The error term is Mean Square(Error) = 303.149. Uses Harmonic Mean Sample Size = 24.000. a.
Alpha = .05. b.
nyimpanan Aktivitas Antioksidan selama Pe
Tests of Between-Subjects Effects
Dependent Variable: antioxidan
11246.323a 7 1606.618 177.037 .000
13166.216 1 13166.216 1450.813 .000
456.979 3 152.326 16.785 .000
10789.344 4 2697.336 297.225 .000
1016.407 112 9.075
25428.946 120
12262.730 119
Source
Corrected Model Intercept persen_CPO umur.simpan Error Total
Corrected Total
Type III Sum
of Squares df Mean Square F Sig.
R Squared = .917 (Adjusted R Squared = .912) a.
Post Hoc Tests
persen_CPO
Homogeneous Subsets
antioxidan
Duncan a,b
30 8.05613
30 9.17763
30 11.70060
30 12.96427
.152 .107
persen_CPO 0% 30% 40% 50% Sig.
N 1 2
Subset
Means for groups in homogeneous subsets are displayed. Based on Type III Sum of Squares
The error term is Mean Square(Error) = 9.075. Uses Harmonic Mean Sample Size = 30.000. a.
waktu.simpan
Homogeneous Subsets
antioxidan
Duncan a,b
24 5.05292
24 5.50021
24 5.90604
24 6.49908
24 29.41504
.133 1.000
umur.simpan hari ke 28 hari ke 21 hari ke 14 hari ke 7 hari ke 0 Sig.
N 1 2
Subset
Means for groups in homogeneous subsets are displayed. Based on Type III Sum of Squares
The error term is Mean Square(Error) = 9.075.
Uses Harmonic Mean Sample Size = 24.000. a.
Alpha = .05. b.
Angka TBA selama Penyimpanan
Tests of Between-Subjects Effects
Dependent Variable: angka_TBA
9.830a 7 1.404 25.635 .000
20.142 1 20.142 367.694 .000
3.607 3 1.202 21.947 .000
6.223 4 1.556 28.402 .000
6.135 112 .055
36.108 120
15.966 119
Source
Corrected Model Intercept persen_CPO umur.simpan Error Total
Corrected Total
Type III Sum
of Squares df Mean Square F Sig.
R Squared = .616 (Adjusted R Squared = .592) a.
Post Hoc Tests
Homogeneous Subsets
persen_CPO
angka_TBA
Duncana,b
30 .22647
30 .33113 .33113 30 .38860
30 .69260
.086 .344 1.000 persen_CPO
50% 30% 40% 0% Sig.
N 1 2 3
Subset
Means for groups in homogeneous subsets are displayed. Based on Type III Sum of Squares
The error term is Mean Square(Error) = .055. Uses Harmonic Mea
a. n Sample Size = 30.000.
Homogeneous Subsets
waktu.simpan
angka_TBA
Duncana,b
24 .15725
24 .24217
24 .28829
24 .62463
24 .73617
.069 .102
umur.simpan hari ke 0 hari ke 7 hari ke 14 hari ke 21 hari ke 28 Sig.
N 1 2
Subset
Means for groups in homogeneous subsets are displayed. Based on Type III Sum of Squares
The error term is Mean Square(Error) = .055. Uses Harmonic M
a. ean Sample Size = 24.000.
Alpha = .05. b.
Variabel Hardness
Tests of Between-Subjects Effects
Dependent Variable: hardness
152720865a 6 25453477.55 91.902 .000
332438285 1 332438284.7 1200.302 .000 9557050.342 3 3185683.447 11.502 .000 143163815 3 47721271.65 172.302 .000 24649634.1 89 276962.181
509808784 96 177370499 95 Source
Corrected Model Intercept persen_CPO waktu_oven Error Total
Corrected Total
Type III Sum
of Squares df Mean Square F Sig.
R Squared = .861 (Adjusted R Squared = .852) a.
Post Hoc Tests
hardness
Duncan a,b
24 1536.012
24 1761.603
24 1762.439
24 2383.493
.164 1.000
persen_CPO
Subset
N 1 2
50% 30% 40% 0% Sig.
Means for groups in homogeneous subsets are displayed. Based on Type III Sum of Squares
The error term is Mean Square(Error) = 276962.181. Uses Harmonic Mean Sample Size = 24.000. a.
Alpha = .05. b.
waktu_oven
Homogeneous Subsets
hardness
Duncana,b
24 330.67788
24 1230.794
24 2272.773
24 3609.301
1.000 1.000 1.000 1.000
waktu_oven 0 mnt 15 mnt 18 mnt 20 mnt Sig.
N 1 2 3
Subset
4
Means for groups in homogeneous subsets are displayed. Based on Type III Sum of Squares
The error term is Mean Square(Error) = 276962.181. Uses Harmonic Mean Sample Size = 24.000. a.
Alpha = .05. b.
ariabel Baking Loss V
Tests of Between-Subjects Effects
Dependent Variable: baking_loss
230.004a 5 46.001 5441.610 .000
3729.068 1 3729.068 441126.6 .000
2.979 3 .993 117.478 .000
227.024 2 113.512 13427.809 .000
.558 66 .008
3959.629 72
230.561 71
Source
Corrected Model Intercept persen_CPO waktu_oven Error Total
Corrected Total
Type III Sum
of Squares df Mean Square F Sig.
R Squared = .998 (Adjusted R Squared = .997) a.
Post Hoc Tests
ubsets
persen_CPO
baking_loss
Duncana,b
18 6.91111
18 7.13250
18 7.27506
18 7.46817
1.000 1.000 1.000 1.000 persen_CPO
50% 40% 30% 0% Sig.
N 1 2 3
Subset
4
Means for groups in homogeneous subsets are displayed. Based on Type III Sum of Squares
The error term is Mean Square(Error) = .008. Uses Harmonic Mean Sample Size = 18.000. a.
Alpha = .05. b.
waktu_oven
s Subsets
Homogeneou
baking_loss
Duncana,b
24 5.60833
24 6.30642
24 9.67538
1.000 1.000 1.000
waktu_oven 15 mnt 18 mnt 20 mnt Sig.
N 1 2
Subset
3
Means for groups in homogeneous subsets are displayed. Based on Type III Sum of Squares
The error term is Mean Square(Error) = .008. Uses Harmonic Mean Sample Size = 24.000. a.
Alpha = .05. b.
Uji Warnasecara Fisik untuk Variabel lightness
Tests of Between-Subjects Effects
Dependent Variable: lightness
2482.771a 6 413.795 98.635 .000
493445.139 1 493445.139 117621.2 .000
53.107 3 17.702 4.220 .008
2429.664 3 809.888 193.051 .000
373.373 89 4.195
496301.283 96
2856.144 95
Source
Corrected Model Intercept persen_CPO waktu_oven Error Total
Corrected Total
Type III Sum
of Squares df Mean Square F Sig.
R Squared = .869 (Adjusted R Squared = .860) a.
Post Hoc Tests
persen_CPO
lightness
Duncana,b
24 70.79500 24 71.26083
24 71.95500 71.95500 24 72.76583 .066 .174 persen_CPO
Subset
N 1 2
30% 40% 50% 0% Sig.
Means for groups in homogeneous subsets are displayed. Based on Type III Sum of Squares
The error term is Mean Square(Error) = 4.195. Uses Harmonic Mean Sample Size = 24.000. a.
Alpha = .05. b.
waktu_oven
s Subsets
Homogeneou
lightness
Duncana,b
24 63.03708
24 73.65500
24 74.92792
24 75.15667
1.000 1.000 .700
waktu_oven 0 mnt 20 mnt 18 mnt 15 mnt Sig.
N 1 2
Subset
3
Means for groups in homogeneous subsets are displayed. Based on Type III Sum of Squares
The error term is Mean Square(Error) = 4.195. Uses Harmonic Mean Sample Size = 24.000. a.
Alpha = .05. b.
secara Fisik untuk Variabel a (tingkat kemerahan) Uji Warna
Tests of Between-Subjects Effects
Dependent Variable: a
76.037a 6 12.673 25.722 .000 1610.236 1 1610.236 3268.279 .000 26.727 3 8.909 18.082 .000 49.310 3 16.437 33.361 .000 43.849 89 .493
1730.122 96 119.886 95 Source
Corrected Model Intercept waktu_oven persen_CPO Error Total
Corrected Total
Type III Sum
of Squares df Mean Square F Sig.
R Squared = .634 (Adjusted R Squared = .610) a.
Post Hoc Tests
s Subsets
persen_CPO
a
Duncana,b
24 3.08208
24 3.76250
24 4.69750
24 4.84000
1.000 1.000 .484
persen_CPO 0%
30% 40% 50% Sig.
N 1 2
Subset
3
Means for groups in homogeneous subsets are displayed. Based on Type III Sum of Squares
The error term is Mean Square(Error) = .493. Uses Harmonic Mean Sample Size = 24.000. a.
Alpha = .05. b.
aktu_oven
s Subsets
w
Homogeneou
a
Duncana,b
24 3.55083
24 3.80667 3.80667 24 4.07292
24 4.95167 .210 .192 1.000 waktu_oven
15 mnt 0 mnt 18 mnt 20 mnt Sig.
N 1 2
Subset
3
Means for groups in homogeneous subsets are displayed. Based on Type III Sum of Squares
The error term is Mean Square(Error) = .493. Uses Harmonic Mean Sample Size = 24.000. a.
Alpha = .05. b.
ji Warnasecara Fisik untuk Variabel b (tingkat kekuningan) U
Tests of Between-Subjects Effects
Dependent Variable: b
3958.185a 6 659.697 116.731 .000
107368.484 1 107368.484 18998.412 .000 2268.295 3 756.098 133.788 .000 1689.890 3 563.297 99.673 .000
502.979 89 5.651 111829.647 96
4461.163 95 Source
Corrected Model Intercept persen_CPO waktu_oven Error Total
Corrected Total
Type III Sum
of Squares df Mean Square F Sig.
Post Hoc Tests
persen_CPO
Homogeneous Subsets
b
Duncan a,b
24 25.61917
24 33.14958
24 37.13042
24 37.87208
1.000 1.000 .283
persen_CPO 0% 30% 40% 50% Sig.
N 1 2 3
Subset
Means for groups in homogeneous subsets are displayed. Based on Type III Sum of Squares
The error term is Mean Square(Error) = 5.651. Uses Harmonic Mean Sample Size = 24.000. a.
Alpha = .05. b.
waktu_oven
Homogeneous Subsets
b
Duncana,b
24 29.89583
24 31.27667
24 32.00875
24 40.59000
1.000 .289 1.000
waktu_oven 15 mnt 20 mnt 18 mnt 0 mnt Sig.
N 1 2 3
Subset
Means for groups in homogeneous subsets are displayed. Based on Type III Sum of Squares
The error term is Mean Square(Error) = 5.651.
Uses Harmonic Mean Sample Size = 24.000. a.
Alpha = .05. b.
Uji Friedman Variabel Warna
Ranks
1.87 2.90 2.47 2.77 kontrol
tigapuluh.persen empatpuluh.persen limapuluh.persen
Mean Rank
Test Statisticsa
30 11.400 3 .010 N
Chi-Square df
Asymp. Sig.
Friedman Test a.
Uji Friedman Variabel Rasa
Ranks
2.67 2.37 2.47 2.50 kontrol
tigapuluh.persen empatpuluh.persen limapuluh.persen
Mean Rank
Test Statisticsa
30 .840 3 .840 N
Chi-Square df
Asymp. Sig.
Friedman Test a.
Uji Friedman Variabel Aroma
Ranks
2.80 2.37 2.23 2.60 kontrol
tigapuluh.persen empatpuluh.persen limapuluh.persen
Mean Rank
Test Statisticsa
30 3.400 3 .334 N
Chi-Square df
Asymp. Sig.
Friedman Test a.
Uji Friedman Variabel Tekstur
Ranks
2.57 2.37 2.33 2.73 kontrol
tigapuluh.persen empatpuluh.persen limapuluh.persen
Mean Rank
Test Statisticsa
30 1.880 3 .598 N
Chi-Square df
Asymp. Sig.
Friedman Test a.
Uji Friedman Variabel Overall
Ranks
2.80 1.97 2.47 2.77 kontrol
tigapuluh.persen empatpuluh.persen limapuluh.persen
Mean Rank
Test Statisticsa
30 8.040 3 .045 N
Chi-Square df
Asymp. Sig.
Friedman Test a.
Lampiran 6. Analisa Uji LSD Tingkat Kesukaan Secara Sensoris
Uji LSD rank (manual) = tα/2, ∞ x √p x t x (t+1) : 6
Keterangan : tα/2, ∞ pada tingkat kepercayaan 95% adalah 1,960
p = jumlah panelis t = jumlah perlakuan
ANALISA UJI LSD COOKIES substitusi CPO untuk variabel WARNA Uji LSD rank (manual) = 1,960 x √ 30 x 4 x 5 : 6 = 19,60
Nilai LSD rank = 19,60 RA = CPO 0% = 56 RB = CPO 30% = 87 RC = CPO 40% = 74 RD = CPO 50% = 83
RB – RA = 31, > LSD rank Æ A ≠ B, cookies 0% CPO ≠cookies 30% CPO RB – RC = 13, < LSD rank Æ B = C, cookies 30% CPO = cookies 40% CPO RB – RD = 4 , < LSD rank Æ B = D, cookies 30% CPO = cookies 50% CPO RC – RA = 18, < LSD rank Æ A = C, cookies 0% CPO = cookies 40% CPO RD – RA = 27, > LSD rank Æ A ≠ D, cookies 0% CPO ≠cookies 50% CPO RD – RC = 9 , < LSD rank Æ C = D, cookies 40% CPO = cookies 50% CPO A C B D
ANALISA UJI LSD COOKIES substitusi CPO untuk variabel OVERALL
Uji LSD rank (manual) = 1,960 x √ 30 x 4 x 5 : 6 = 19,60 Nilai LSD rank = 19,60
RA = CPO 0% = 84 RB = CPO 30% = 59 RC = CPO 40% = 74 RD = CPO 50% = 83
RA – RB = 25, > LSD rank Æ A ≠ B, cookies 0% CPO ≠cookies 30% CPO RA – RC = 10, < LSD rank Æ A = C, cookies 0% CPO = cookies 40% CPO RA – RD = 1 , < LSD rank Æ A = D, cookies 0% CPO = cookies 50% CPO RC – RB = 15, < LSD rank Æ B = C, cookies 30% CPO = cookies 40% CPO RD – RB = 24, > LSD rank Æ B ≠ D, cookies 30% CPO ≠cookies 50% CPO RD – RC = 9 , < LSD rank Æ C = D, cookies 40% CPO = cookies 50% CPO
A D C B