JMK 4 (1) 2019, 17-31 ISSN 2477-3166
Alamat korespondensi :
Sekolah Tinggi Ilmu Ekonomi AAS Surakarta
Jl. Slamet Riyadi No. 361 Windan, Makamhaji, Kartasura, Sukoharjo. Jawa Tengah, Indonesia
Forecasting Sales Cotton and Polyester Yarn at
PT. Agung Sejahtera Sukaraharja Karanganyar
𝐑𝐮𝐤𝐦𝐢𝐧𝐢
Sekolah Tinggi Ilmu Ekonomi AAS Surakarta rukminidra@yahoo. co. id
Abstract
This study aims to determine the sales forecasting and polyester cotton yarn in January 2015 by using the Least Square Method and Method of Quadratic Trend. As well as to determine the most efficient methods of forecasting to predict sales of cotton yarn and polyester products at PT Agung Sejahtera. From the results of analysis based on the calculation of sales forecasts yarn products with sales data from January to December 2014 using the least squares method and quadratic trend method, in which the quadratic trend method is more suitable because it has a value of SKP lows while the predictive value of product sales yarn using trend quadratic result of cotton yarn 40 weaving of 1,538 ball, cotton yarn 40 amounted to 597.504 ball spandex, polyster yarn weaving amounted 411.348 40 ball, 30 Weaving Polyester yarn ball at 336.588.
Keywords:sales forecasting, least square, quadratic trend.
Abstrak
Penelitian ini bertujuan untuk mengetahui peramalan penjualan benang cotton dan polyester pada bulan Januari 2015 dengan menggunakan Metode Least Square dan Metode Trend Kuadratik. Serta untuk mengetahui metode peramalan yang paling efisien untuk meramalkan penjualan produk benang cotton dan polyster pada PT Agung Sejahtera. Dari hasil analisis diketahui berdasarkan perhitungan ramalan penjualan produk benang dengan data penjualan Januari-Desember 2014 yang menggunakan metode least square dan metode trend kuadratik, dimana metode trend kuadratik lebih cocok digunakan karena memiliki nilai SKP terendah sedangkan dari nilai ramalan penjualan produk benang dengan menggunakan metode trend kuadratik diperoleh hasil Benang cotton 40 weaving sebesar 1.538 ball, benang cotton 40 spandex sebesar 597,504 ball, benang polyster 40 weaving sebesar 411,348 ball, benang Polyester 30 Weaving sebesar 336,588 ball.
Kata kunci: peramalan penjualan, least square, trend kuadratik
Permalink/DOI : http://dx.doi.org/10.32503/jmk.v4i1.357
Cara mengutip : Rukmini. (2019). Forecasting Sales Cotton and Polyester Yarn at PT. Agung Sejahtera Sukaraharja Karanganyar. JMK (Jurnal Manajemen dan Kewirausahaan), 4(1), 17-31
doi:http://dx.doi.org/10.32503/jmk.v4i1.357
Sejarah Artikel : Artikel diterima : 4 Januari 2019; direvisi 11 Januari 2019; disetujui 15 Januari 2019
Introduction
An established company has a goal to produce goods and services into consumer needs and at the same time could make a profit from the venture. Besides being able to make a profit, it also aims to assist the government in reducing the unemployment rate, to create new jobs and aims to maintain and improve the viability of the company in the future. To make this happen, the leadership of the company must establish a proper policy in managing the company. Good management will increase the value of the goods. Goods produced by a company will compete with other companies, so that there will be competition. Industry competition becomes more intense and competitive. Globalization and technological developments into aspects affecting the quality of an industry position. Technology provides many positive effects and globalization provide easy access for industry around the world where globalization has penetrated into various aspects of life of both the cultural, economic, and industry.
Currently, many changes have occurred, among others, the development of technology and information. Which led to come a lot of companies, so there is competition between companies of the business with other companies. Every company is trying to win the competition by offering high quality production to the consumer, The goal of a business organization is to produce goods and services that can satisfy consumers (MT, 2011). Companies need to create a strategy in order to maintain consumer loyalty to the company. To overcome these problems, the company uses a way to
improve the quality of the production process in order to create a good product quality. Good quality products will increase the selling value of the product. Aside from how the company needs to know the planing / plans regarding the sale of products in the future. Companies also should consider this aspect because it is one of the effective means used. One plan that can be realized is forecasting to product sales by using past data.
Forecasting is one very important element in the decision process. Forecasting is done generally based on past then analyzed using the methods or certain ways. Past data is collected, studied, analyzed and linked with the passage of time, due to the time factor, the data from the analysis, we can try to say something happening in the future. In this case we are faced with a state of uncertainty, so there will be accuracy or dissimilarity factor to be reckoned with. Forecasting is always intended that the prediction made to minimize forecast error means the difference between reality with the forecast is not too much because the forecast will not be "Perfect", nevertheless forecasting results will provide direction for planning. Good forecasts are predictions closer to reality. Therefore, forecasting is used as a reference in the decision making good forecasts are needed.
Common problems faced by managers is how to forecast sales of goods in the future based on the data that has been recorded previously. Forecasting is very influential on the manager's decision to determine the amount of production of goods that must be provided by the company.
PT. Agung Sejahtera is one company that is engaged in yarn spinning industry. The company manufactures and distributes products yarn with a local marketing and export include Solo, Yogyakarta, Jakarta, Bandung and for export to China, India, Thailand, Columbia, and Japan. Type of yarn produced, among others: Cotton Yarn, Rayon, Polyester and others.
Due to some products produced by PT. Agung Sejahtera very attentive to market demands and desires of consumers. With the method of forecasting, it is expected that the company can determine the number of products to be sold at a particular time.
Forecasting
According Heizer and Render (2006: 46) forecasting is the art and science that predicts future events. Forecasting requires retrieval of historical data and project it into the future. Ishak (2010: 104) Forecasting is thinking on a large scale, for example, the demand for one or more products in the coming period.
According to Nasution (2003: 25) Forecasting is predicting several future needs which includes the need to measure the quantity, quality, when and where needed in order to meet the demand for goods or services.
According to Hendra Poerwanto Sales forecasting is technically estimates or projections of potential consumer demand for a certain time with a range of assumptions. Sales forecasting is an estimate of something that has not happened. Sales forecasting is a budget that contains those estimates on activities of the company within a certain period to come, and contain those estimates on the
state or financial position of the company at some time to come.
Forecasting Objectives
The purpose of forecasting is to obtain information about changes in the future that will affect the implementation of the policies and their consequences, the following are the steps to their forecasting, namely: 1.To determine policies in the problems of constructing a budgets; 2.To monitor the supply of a product to be sold; 3.To assist the planning and supervision of the reproduction of goods and services; 4.To conduct surveillance for the expenditure of the company; and 5.To draw up policies that effectively and efficiently.
Characteristics of a Good Forecasting
Good forecasting has several important criteria, such as accuracy, cost, dankemudahan. The explanation of these criteria are as follows: 1.accuracy of the results of forecasting is measured by results and the consistency of the forecasting habits. The result of said bias when forecasting forecasting is too high or low compared with the fact that actually happened. Forecasting results is said to be consistent if the relatively small size of the forecast error; 2.The cost required in making a prediction is dependent on the number of items that are foreseen, the length of the forecast period, and the forecasting method used. These three factors trigger these costs will affect how much data is needed, how the processing of data (manual or computerized), how the data storage, and who seconded experts; 3.The use of forecasting methods that are simple, easy to make and easy to apply will benefit the company. Useless wearing a
sophisticated method, but it can not be applied to the company's system because of limited funds, human resources, as well as technological equipment.
Nature of Forecasting Results
In making the forecast or apply the results of a prediction, then there are several things to be considered, namely: 1.Exact predictions contains an error means that forecasters could only reduce the uncertainty that occurs, but can not eliminate this uncertainty; 2.Forecasting should provide information about how the size of the error, means for forecasting certainly contains errors, it is important for the psychic to tell you how big a mistake that might occur; 3.Short-term forecasting is more accurate than the long-term forecasting. This is due to the short-term forecasting, the factors that affect the demand is still relatively constant, whereas the longer the forecasting period, the greater the possibility that changes in the factors affecting demand.
Type Forecasting
According to Render & Heizer (2001: 46), forecasting can be divided into three types, namely: 1.Economic Forecasting: explain the business cycle to predict the rate of inflation, the availability of money, the funds needed to build housing and other planning indicator; 2.Forecasting Technology: considering the level of technology that can launch exciting new products, requiring new plants and equipment; 3.Demand Forecasting: the projected demand for the products or services of a company. This prediction is also called sales forecasting, which controls production, capacity and scheduling system and becomes an input
for financial planning, marketing and human resources.
Types of Forecasting
Here are some forecasting methods that can be used for the benefit of sales forecasting: 1. Qualitative Forecasting Methods, 2. Quantitative Model (Statistics / Statistic Method) and 3. Custom Models. Qualitative Forecast is based on the opinion (judgment method). Used to compile the forecast sales and forecast of business conditions in general. Opinions were used as a basis for Forecast is: a.Opinion Salesman. Salesman asked to measure whether there is progress or regress all things associated with the level of sales in their respective regions; b.Opinions Sales Manager. In general, estimates of head of sales can be more objective because it takes many factors. It is also due to the relatively higher education and broader experience in the field of sales; c.Expert opinion. Sometimes estimates made by the salesman and sales manager for any contradiction. Companies need to employ consultants in the company; d.Consumer survey. If the opinion of the three parts of the above it is less then the company needs to ask the opinion of the consumer. By conducting surveys or research to consumers.
Quantitative Model (Statistics / Statistic Method). Forecasting requires a blend of quantitative scientific analysis using statistics as a primary tool in making the forecast. Here are some methods of forecasting using statistical approaches are: a.Free trend. In general, smoking trends tend dignakan method as the preliminary analysis that will provide a preliminary picture of a problem that is faced. Free trend method trying to see data
patterns through the scattered observations of pairs of data points panjualan at any time; b.Trend Half Average. Spring average trend method can be used for forecast to form an equation such as regression analysis. This method can be used if the data amount is even, so it can be divided into two groups of equal size; c.Mathematically trend. Here are various methods of mathematical trend, namely: 1)Trend Method of Moment. A moment trend analysis method that can be used for forecasting by forming the equation Y = a + bX. In application of this method does not require the amount of data must be an even number. The difference with the trend Methods semi Average score value lies in giving his X. In this case X starts giving scores of 0,1,2 and so on.
2)Least Square method. In this case the data do the division into two groups. For data that is odd number or even number, namely: Even, then score the value of X is ..., -5, -3, -1,1,3,5, .... Odd, then score the value of X is ..., -2, -1,0,1,2, ....
3)Trend method Quadratic. Quadratic trend method is used for forecasting analysis to establish the equation Y = a + bX + CX2. In application of this method requires that the amount of data even or odd. In this case the score X Award as the least squares method.
4)Regression methods. Correlation and regression analysis showed a relationship between one variable with one or more other variables. With the correlation analysis can know the relationship of the variable-variable concern while the regression analysis hubngan form of variables that concern. By regression analysis the magnitude of the changes
sought variables when other factors affecting these variables change.
Custom Models. This particular method is a special way to forecast sales by market share analysis, analysis of product line, and end-user analysis. Model quantitative (statistics), in reality the overall usage is still less reliable results. Here's an explanation of sorts - kind of specific methods are: a.Industry analysis. In this analysis is more emphasis on "Market Share" owned by the company. This analysis connects the potential sale of the company with the industry in general (volume, position in competition). Stages in the use industriyaitu analysis: 1)Creating industrial demand projections. 2)Assessing the company's position in the competition. b.Analysis Product Line. Generally, analysis of product line used in a company that produces some sort and do not have in common, thus making forecasting should be separate. c.Analysis of End Use. For companies that produce semi-finished products, still require further processing into finished products ready for consumption, hence in making forecasting determined by end use in connection with the resulting product
Previous Research
1.Rita Budi Hastuti Research in the title Evaluation Budgeting Sales in the printing and publishing division PD Anindya Yogyakarta in 2004 with the results show that the company does not take into account the moment method. But the company is using a calculation budget with an increase of 10% per month, and with the realization of 75% of the sales budget. 2.Herry Anggita Research in the title Study Implementation of the sales budget as a tool of Control Sales (Case
Study at PT Perkebunan Nusantara IX Surakarta) with the results of the process of drafting budgets of sales at PT Perkebunan Nusantara IX has been inadequate, due to the characteristics of the budget, terms of Personality tanggaran, the functioning anggran sales. In addition, the sales budget function sebaga isebagai control device sales, because there is a phase control stage very effective sales.
Methods
Use descriptive research design techniques to create a picture or description of a systematic, factual and accurate information on an object under study (Sumarni and Wahyuni, 2006: 52). Object of research conducted at PT. Agung Sejahtera Sukaraharja located on Highway 7 KM Solo-Sragen, Karanganyar. The data used is secondary data. Subagyo (2002), secondary data is data that is obtained in the form of ready-made, had collected other people, either individuals or organizations that later quoted by the author. In this case, which is included in the secondary data, data on the number of office employees, data on the number of employees, production and sales data yarns during the period January to December 2014, which will be used to forecast sales in 2015.
Data Collection Technique
1.Observation techniques. Resear-chers conduct direct observation of something that is researched and keep records of what has been observed. 2.Literature review. Researchers studying the books and other articles that may help solve the underlying problem of research. 3.Documentation. Performed by recording and copying the data in the company as a source of research information.
Data analysis
After collecting the data will be analyzed using the least squares method and the method of quadratic trend.
a.Least Square method. If the number / odd number of data then the value of X of data amid zero (0). While the data on it (previous data) is negative and the value of the underlying (data thereafter) is positive. 1)Establish a table to find the value of X, X ², and XY. 2)Finding the value of a and b to get the equation Y = a + bX. 3)Including the value of X in accordance year to be searched.
If the number / amount of data even then the second X value of data amid worth -1. While the data on it (previous data) is negative odd number and the value of the underlying (data thereafter) is positive odd.
1)Establish a table to find the value of X, X2, and XY. 2)Finding the value of a and b to get the equation Y = a + bX. 3)Including the value of X in accordance year to be searched.
b.Trend method Quadratic
If the number / odd number of data then the value of X of data amid zero (0). While the data on it (previous data) is negative and the value of the underlying (data thereafter) is positive.
1)Tabulated like to find the value of X, X ², XY, X2Y, and X4. 2)Finding the value of a, b and c of the equation Y = a + bX + CX2. 3)Including the value of X in accordance year to be searched.
If the number / amount of data even then the second X value of data amid worth -1 and 1. While the data on it (previous data) is negative odd number and the value
of the underlying (data thereafter) is positive odd.
1)Establish a table to find the value of X, X ², XY, X2Y, and X4. 2)Finding the value of a, b and c of the equation Y = a + bX + CX2. 3)Including the value of X in accordance year to be searched.
Having in mind the results of any of the above methods it uses standard forecasting error by the
formula:
Note: X: real sales Y: Sales Forecast n: data
Discussion
PT. Agung Sejahtera perform sales forecasting activities have not been using a
method. However, simply using customized estimates with sales data Polyester and Cotton in the previous period. For this type of Polyester and Cotton yarn is 40 Weaving Polyester (PE 40 WV), Polyester 30 Weaving (PE 30 WV), Cotton 40 Weaving (CT 40 WV), and Cotton 40 Spandex (CT 40 SPDX)
In conducting the sales forecast, first prepare the data that will be used to predict which sales data Polyester yarn and Cotton in the previous year, then choose forecasting methods to be used, in this case the method to be used is twofold method of Least Square and Methods Trend Quadratic ,
By comparing the forecasting results of both methods, it is expected to obtain the smallest error rate, which can be used as a guide for forecasting the next period.
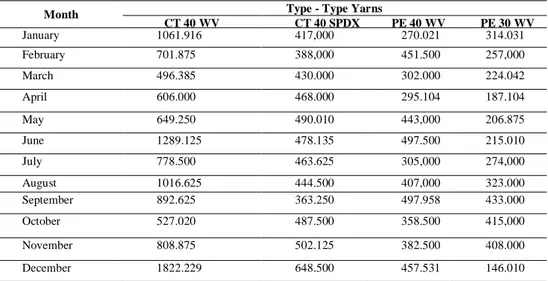
Tabel 1. Sales Data Polyester and Cotton in 2014 (the ball)
Month Type - Type Yarns
CT 40 WV CT 40 SPDX PE 40 WV PE 30 WV January 1061.916 417,000 270.021 314.031 February 701.875 388,000 451.500 257,000 March 496.385 430.000 302.000 224.042 April 606.000 468.000 295.104 187.104 May 649.250 490.010 443,000 206.875 June 1289.125 478.135 497.500 215.010 July 778.500 463.625 305,000 274,000 August 1016.625 444.500 407,000 323.000 September 892.625 363.250 497.958 433.000 October 527.020 487.500 358.500 415,000 November 808.875 502.125 382.500 408.000 December 1822.229 648.500 457.531 146.010
(Data Source: PT. Agung Sejahtera Sukaraharja, 2014)
Analysis of Cotton Yarn Sales Forecasting by Least Square method
Analysis using the least squares method is similar to the trend of the moment method. However, in contrast to the use of the X value, because in this
method differentiated analysis of the data is split between odd and even. The following analysis of Polyester and Cotton yarn sales at PT. Agung Sejahtera.
Sales Forecasting 40 Weaving Cotton Yarn
Value forecasting sales of cotton yarn 40 weaving obtained by finding the value of support to form the forecasting function with the least squares method. In the table below will look for the value of the number of X, Y amount, number and amount X2 XY.
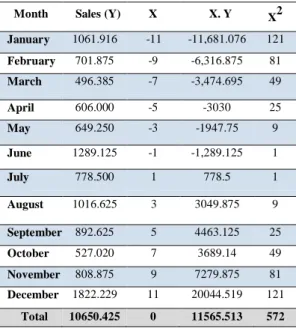
Tabel 2. Calculation of cotton yarn sales forecasting 40 Weaving.
Month Sales (Y) X X. Y X2
January 1061.916 -11 -11,681.076 121 February 701.875 -9 -6,316.875 81 March 496.385 -7 -3,474.695 49 April 606.000 -5 -3030 25 May 649.250 -3 -1947.75 9 June 1289.125 -1 -1,289.125 1 July 778.500 1 778.5 1 August 1016.625 3 3049.875 9 September 892.625 5 4463.125 25 October 527.020 7 3689.14 49 November 808.875 9 7279.875 81 December 1822.229 11 20044.519 121 Total 10650.425 0 11565.513 572
(Data Source: PT. Agung Sejahtera Sukaraharja, 2014) Table 2. shows the value of the number of X, Y amount, the number of XY and the amount X2, the next calculation
will be done to look for forecasting equation is: Y = a + bX
By using the above formula is obtained: 𝑎 = ∑ 𝑌 𝑁 = 10.650,425 12 = 887,535 𝑏 = ∑ 𝑋𝑌 ∑ 𝑋2 = 11.565,513 572 = 20,219
Cotton sales forecasting equation 40 Weaving is Y = a + bX
Y = 887.535 + 20.219 X
From the equation above can be searched value forecasting for the month of January 2015 by entering the value X =
13 (because the value of X in December 2014 was 11), then Y = 887.535 + 20.219 (13) = 1150.282. So in January 2015 the value of sales forecasting is 1150.282 ball.
Sales Forecasting Cotton 40 Spandex Yarn
Value sales forecasting spandex cotton yarn 40 obtained by finding the value of support to form the forecasting function with the least squares method. In the table below will look for the value of the number of X, Y amount, number and amount X2 XY.
Tabel 3. Calculation of cotton yarn sales forecasting 40 Spandex.
Month Sales (Y) X X. Y X2
January 417,000 -11 -4587 121 February 388,000 -9 -3492 81 March 430.000 -7 -3010 49 April 468.000 -5 -2340 25 May 490.010 -3 -1470.03 9 June 478.135 -1 -478.135 1 July 463.625 1 463.625 1 August 444.500 3 1333.5 9 September 363.250 5 1816.25 25 October 487.500 7 3412.5 49 November 502.125 9 4519.125 81 December 648.500 11 7133.5 121 Total 5580.645 0 3301.335 572
(Data Source: PT. Agung Sejahtera Sukaraharja, 2014) Table 3 shows the value of the number of X, Y amount, the number of XY and the amount X2, the next calculation
will be done to look for forecasting equation is: Y = a + bX. By using the above formula is obtained: 𝑎 = ∑ 𝑌 𝑁 = 5.580,645 12 = 465,054 𝑏 = ∑ 𝑋𝑌 ∑ 𝑋2 = 3.301,335 572 = 5,772
Sales forecasting equation Cotton 40 Spandex is Y = a + bX
Y= 465.054 + 5.772 X
From the equation above can be searched value forecasting for the month of January 2015 by entering the value X = 13 (because the value of X in December 2014 was 11), then Y = 465.054 + 5.772 (13) = 540.09. So the value of forecasting sales in January 2015 was 540.09 ball.
Analysis of Polyester Yarn Sales Forecasting Method of Least Square Polyester Yarn Sales Forecasting 40 Weaving
Value sales forecasting polyester yarn 40 weaving obtained by finding the value of support to form the forecasting function with the least squares method. In the table below will look for the value of the number of X, Y amount, number and amount X2, XY.
Table 4 sales forecasting calculations polyester yarn 40 weaving.
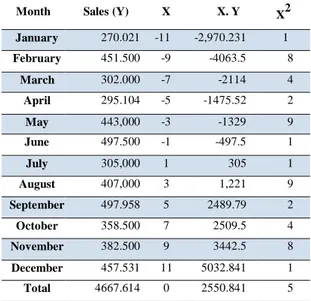
Month Sales (Y) X X. Y X2
January 270.021 -11 -2,970.231 1 2 1 February 451.500 -9 -4063.5 8 1 March 302.000 -7 -2114 4 9 April 295.104 -5 -1475.52 2 5 May 443,000 -3 -1329 9 June 497.500 -1 -497.5 1 July 305,000 1 305 1 August 407,000 3 1,221 9 September 497.958 5 2489.79 2 5 October 358.500 7 2509.5 4 9 November 382.500 9 3442.5 8 1 December 457.531 11 5032.841 1 2 1 Total 4667.614 0 2550.841 5 7 2 (Data Source: PT. Agung Sejahtera Sukaraharja, 2014)
Table.4 shows the value of the number of X, Y amount, the number of XY and the amount X2, the next calculation
will be done to look for forecasting equation is: Y = a + bX.
By using the above formula is obtained: 𝑎 = ∑ 𝑌 𝑁 = 4.667,614 12 = 388,968 𝑏 = ∑ 𝑋𝑌 ∑ 𝑋2 = 2.550,841 572 = 4,460
Equation 40 weaving polyester sales forecasting is Y = a + bX
Y = 388.968 + 4.460 X
From the equation above can be searched value forecasting for the month of January 2015 by entering the value X = 13 (because the value of X in December 2014 was 11), then Y = 388.968 + 4.460 (13) = 446.948.
So the value of forecasting sales of January 2015 is 446.948 ball.
Polyester Yarn Sales Forecasting 30 Weaving
Value sales forecasting polyester yarn 30 weaving obtained by finding the value of support to form the forecasting function with the least squares method. In the table below will look for the value of the number of X, Y amount, number and amount X2, XY.
Table 5 shows the value of the number of X, Y amount, the number of XY and the amount X2, the next calculation
will be done to look for forecasting equation is: Y = a + bX.
By using the above formula is obtained: 𝑎 = ∑ 𝑌 𝑁 = 3.403,072 12 = 283,589 𝑏 = ∑ 𝑋𝑌 ∑ 𝑋2 = 2.484,320 572 = 4,343
Table 5 sales forecasting calculations polyester yarn 30 weaving.
Month Sales (Y) X X. Y X2
January 314.031 -11 -3,454.341 121 February 257,000 -9 -2313 81 March 224.042 -7 -1,568.294 49 April 187.104 -5 -935.52 25 May 206.875 -3 -620.625 9 June 215.010 -1 -215.01 1 July 274,000 1 274 1 August 323.000 3 969 9 September 433.000 5 2165 25 October 415,000 7 2905 49 November 408.000 9 3672 81 December 146.010 11 1606.11 121 Total 3403.072 0 02,484.320 572
(Data Source: PT. Agung Sejahtera Sukaraharja, 2014) Equation 40 weaving polyester sales forecasting is Y = a + bX
Y = 283.589 + 4.343 X
From the equation above can be searched value forecasting for the month of January 2015 by entering the value X = 13 (because the value of X in December 2014 was 11), then Y = 283.589 + 4.343 (13) = 340.048. So the value of forecasting sales of January 2015 is 340.048 ball.
Analysis of Cotton Yarn Sales Forecasting Method of Trend quadratic Sales Forecasting 40 Weaving Cotton Yarn
Value forecasting sales of cotton yarn 40 weaving obtained by finding the value of support to form functions quadratic trend forecasting method. In the table below will look for the value of the number of X, Y amount, the number of XY, the number of X2, X4 and total number
X2Y.
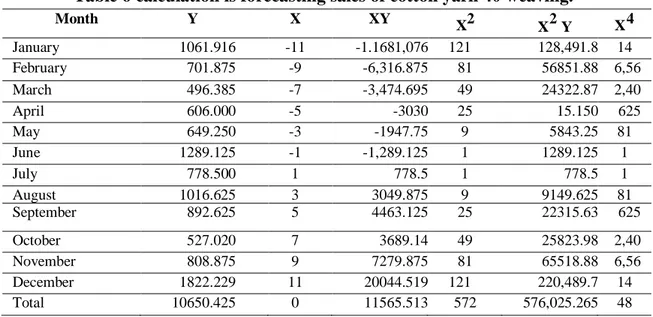
Table 6 calculation is forecasting sales of cotton yarn 40 weaving.
Month Y X XY X2 X2 Y X4 January 1061.916 -11 -1.1681,076 121 128,491.8 14 641 February 701.875 -9 -6,316.875 81 56851.88 6,56 1 March 496.385 -7 -3,474.695 49 24322.87 2,40 1 April 606.000 -5 -3030 25 15.150 625 May 649.250 -3 -1947.75 9 5843.25 81 June 1289.125 -1 -1,289.125 1 1289.125 1 July 778.500 1 778.5 1 778.5 1 August 1016.625 3 3049.875 9 9149.625 81 September 892.625 5 4463.125 25 22315.63 625 October 527.020 7 3689.14 49 25823.98 2,40 1 November 808.875 9 7279.875 81 65518.88 6,56 1 December 1822.229 11 20044.519 121 220,489.7 14 61 Total 10650.425 0 11565.513 572 576,025.265 48 620
(Data Source: PT. Agung Sejahtera Sukaraharja, 2014) Table 6 shows the value of the number of X, Y amount, the number of XY, X2 amount, number and amount X2.Y X4, the next calculation will be done to look for forecasting equation, namely:
Y = a + bX + CX2
By using the above formula can be obtained values of a, b and c:
Sales forecasting equation Weaving Polyester 40 is Y = a + bX + CX2
Y = 734.957 + 20.219 + 3.201 X X2 From the equation above can be searched value forecasting for the month of January 2015 by entering the value X = 13 (because the value of X in December 2014 was 11), then Y = 734.957 + 20.219 (13) + 3.201 (13) 2 = 1538.769. So in January 2015 the value of sales forecasting is 1538.769 ball.
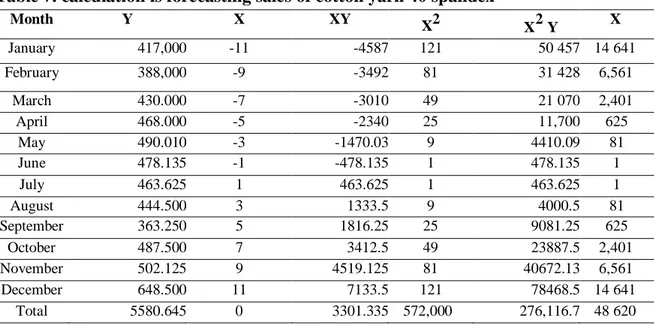
Sales Forecasting Cotton 40 Spandex Yarn
Value sales forecasting spandex cotton yarn 40 obtained by finding the value of support to form functions quadratic trend forecasting method. In the table below will look for the value of the number of X, Y amount, the number of XY, the number of X2, X4 and total number X2.Y.
Table 7. calculation is forecasting sales of cotton yarn 40 spandex
Month Y X XY X2 X2 Y X 4 January 417,000 -11 -4587 121 50 457 14 641 February 388,000 -9 -3492 81 31 428 6,561 March 430.000 -7 -3010 49 21 070 2,401 April 468.000 -5 -2340 25 11,700 625 May 490.010 -3 -1470.03 9 4410.09 81 June 478.135 -1 -478.135 1 478.135 1 July 463.625 1 463.625 1 463.625 1 August 444.500 3 1333.5 9 4000.5 81 September 363.250 5 1816.25 25 9081.25 625 October 487.500 7 3412.5 49 23887.5 2,401 November 502.125 9 4519.125 81 40672.13 6,561 December 648.500 11 7133.5 121 78468.5 14 641 Total 5580.645 0 3301.335 572,000 276,116.7 48 620
(Data Source: PT. Agung Sejahtera Sukaraharja, 2014) Table 7. shows the value of the number of X, Y amount, the number of XY, X2 amount, number and amount X2.Y X4, the next calculation will be done to look for forecasting equation, namely:
Y = a + bX + CX2.
By using the above formula can be obtained values of a, b and c
12a+572c=10.650,425 X 143 1.716a+81.796c=1.523.011,775 572a+48620b=576.025,265 X 3 1.716a+145.860c=1.728.075,795
Sales forecasting equation Polyester 40 Spandex is
Y = a + bX + CX2 = 442.496 + 5.772 X + 0.473 X2
From the equation above can be searched value forecasting for the month of January 2015 by entering the value X = 13 (because the value of X
December 2014 is 11), then Y = 442.496 + 5.772 (13) + 0.473 (13) 2 = 597.504. So the value of forecasting sales of January 2015 is 597.504 ball.
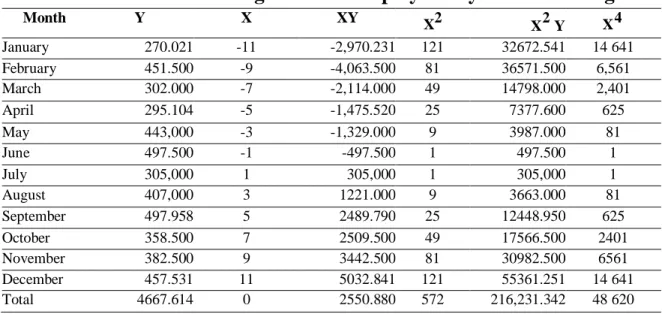
Analysis of Polyester Yarn Sales Forecasting Method trend Quadratic Polyester Yarn Sales Forecasting 40 Weaving
Value sales forecasting polyester yarn 40 weaving obtained by finding the value of support to form functions quadratic trend forecasting method. In the table below will look for the value of the number of X, Y amount, the number of XY, the number of X2, X4 and total number X2.Y.
Table 8 sales forecasting calculations polyester yarn 40 weaving.
Month Y X XY X2 X2 Y X4 January 270.021 -11 -2,970.231 121 32672.541 14 641 February 451.500 -9 -4,063.500 81 36571.500 6,561 March 302.000 -7 -2,114.000 49 14798.000 2,401 April 295.104 -5 -1,475.520 25 7377.600 625 May 443,000 -3 -1,329.000 9 3987.000 81 June 497.500 -1 -497.500 1 497.500 1 July 305,000 1 305,000 1 305,000 1 August 407,000 3 1221.000 9 3663.000 81 September 497.958 5 2489.790 25 12448.950 625 October 358.500 7 2509.500 49 17566.500 2401 November 382.500 9 3442.500 81 30982.500 6561 December 457.531 11 5032.841 121 55361.251 14 641 Total 4667.614 0 2550.880 572 216,231.342 48 620
(Data Source: PT. Agung Sejahtera Sukaraharja, 2014) Table 8 shows the value of the number of X, Y amount, the number of XY, X2 amount, number and amount X2.Y X4, the next calculation will be done to
look for forecasting equation is: Y = a + bX + CX2
By using the above formula can be obtained values of a, b and c:
12a+572c=5.580,645 X 143 1.716a+81.796c=798.032,235
Sales forecasting equation Weaving Polyester 40 is
Y = a + bX + CX2 = 402.937 + 4.460 X - 0,293 X2
From the equation above can be searched value forecasting for the month of January 2015 by entering the value X = 13 (because the value of X in December 2014 was 11), then Y = 402.937 + 4.460 (13) - 0,293 (13) 2 = 411.348. So the value
of forecasting sales of January 2015 is 411.348 ball.
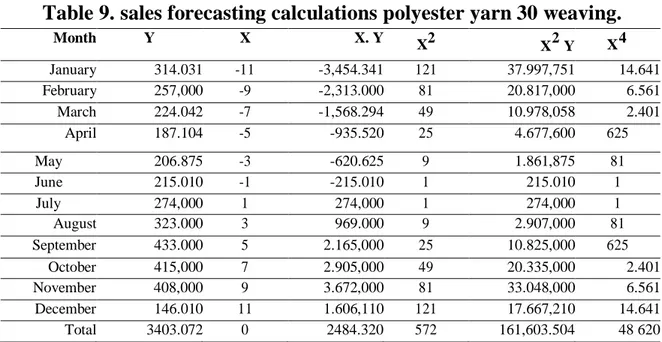
Polyester Yarn Sales Forecasting 30 Weaving
Value sales forecasting polyester yarn 30 weaving obtained by finding the value of support to form functions quadratic trend forecasting method. In the table below will look for the value of the number of X, Y amount, the number of XY, the number of X2, X4 and total number X2.Y.
Table 9. sales forecasting calculations polyester yarn 30 weaving.
Month Y X X. Y X2 X2 Y X4 January 314.031 -11 -3,454.341 121 37.997,751 14.641 February 257,000 -9 -2,313.000 81 20.817,000 6.561 March 224.042 -7 -1,568.294 49 10.978,058 2.401 April 187.104 -5 -935.520 25 4.677,600 625 May 206.875 -3 -620.625 9 1.861,875 81 June 215.010 -1 -215.010 1 215.010 1 July 274,000 1 274,000 1 274,000 1 August 323.000 3 969.000 9 2.907,000 81 September 433.000 5 2.165,000 25 10.825,000 625 October 415,000 7 2.905,000 49 20.335,000 2.401 November 408,000 9 3.672,000 81 33.048,000 6.561 December 146.010 11 1.606,110 121 17.667,210 14.641 Total 3403.072 0 2484.320 572 161,603.504 48 620
(Data Source: PT. Agung Sejahtera Sukaraharja, 2014) Table 9 shows the value of the number of X, Y amount, the number of XY, X2 amount, number and amount X2.Y X4, the next calculation will be done to
look for forecasting equation is: Y = a + bX + CX2.
By using the above formula can be obtained values of a, b and c:
12a+572c=4667.614 X 143 1.716a+81.796c=667468.802
Sales forecasting equation Weaving Polyester 30 is Y = a + bX + CX2.
From the equation above can be searched value forecasting for the month of January 2015 by entering the value X = 13 (because the value of X
December 2014 is 11), then Y = a + bX + cX = 284.950 + 4.343 X - 0.029 X2. So the value of forecasting sales of January 2015 is 336.588 ball.
Comparative Analysis
Forecasting great value is the value that is approximately correct predictions and has the smallest error. In this comparative analysis conducted analysis to compare the value of forecasting by the least squares method and the method of quadratic trend in all four types of yarn. The following table states the forecast value comparison with the actual values.
Table 10. forecasting value and the actual value of the yarn sales in January
2015 (in units of ball).
Cotton 40 WV cotton 40 SPD X polyester 40 WV polyester 30 W V
methods Least Square 1150.282 540.09 446.948 340.048
methods Trend quadratic 1538.769 597.504 411.348 336.588
Actual Data 1457.125 577.000 418,000 324,000
(Data Source: PT. Agung Sejahtera Sukaraharja, 2014) From the data obtained over the forecast values obtained from Trend Quadratic of the actual sales value. But it can not be as a measure in the selection of
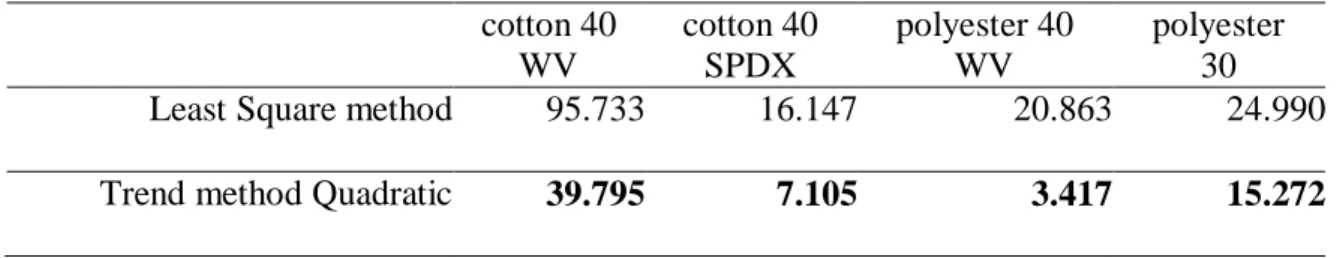
appropriate methods for forecasting sales. To find a good method used then tested the forecasting error standard (SKP). Large calculation errors of forecasting (in the appendix) can be seen in the table below:
Table 11 standard value error of two methods of forecasting
cotton 40 WV cotton 40 SPDX polyester 40 WV polyester 30 W VLeast Square method 95.733 16.147 20.863 24.990
Trend method Quadratic 39.795 7.105 3.417 15.272
(Data Source: PT. Agung Sejahtera Sukaraharja, 2014)
12a+572c=3403.072 X 143 1.716a+81.796c=486.639,296
From the test results obtained SKP forecasting of sales of cotton and polyester is better to use Quadratic Trend method because it has a value of SKP smaller than Least Square method.
Conclusion
Based on the calculation of sales forecasts yarn products with sales data from January to December 2014 using the least squares method and quadratic trend method, in which the quadratic trend method is more suitable because it has the lowest SKP.
Acquired value of product sales forecasts yarn using quadratic trend is: a.Cotton yarn 40 Weaving of 1.538,769 ball. b.Cotton 40 Spandex yarn ball at 597.504. c.Polyester yarn ball 40 Weaving at 411.348. d.Weaving yarn Polyester 30 amounted 336.588
References
Arsyat, L. (1997). Peramalan Bisnis.Edisi Pertama, BPFE Yogyakarta.
Charles W. Lamb, Joseph F. Hair, dan Carl Mcdaniel. (2001). Pemasaran. Edisi Pertama, Jakarta, Salemba Empat. Fred E, Halim dan Kenneth G. Mangun.
(1999). Do-it-Your-Self Advertising and Promotion – Beriklan dan Berpromosi Sendiri, Jakarta, Grasindo. Ishak, Aulia. (2010). Manajemen Operasi. Edisi Pertama. Graha Ilmu. Yogyakarta Kasali, R. (2001). Manajemen Periklanan
– Konsep dan Aplikasinya di Indonesia, Jakarta, Pustaka Utama Grafiti. Kotler, Philip dan Gary Armstrong.
(2008). Prinsip-Prinsip Pemasaran (Terjemahan Bob Sabran, MM). Edisi 12. Jilid 2. Jakarta : Erlangga.
Nasution, H. A. (2003). Perencanaan dan Pengendalian Produksi. Edisi Pertama. Guna Widya. Jakarta.
Prasetya, H & Lukiastuti, F. (2009). Manajemen Operasi.Edisi Pertama. Media Pressindo, Yogyakarta.
Render dan Heizer. (2005). Prinsip-Prinsip Manajemen Operasi.Salemba Empat, Jakarta.
Render, Barry dan Jay Heizer. (2006). Manajemen Operasi. Salemba Empat. Jakarta.
Subagyo, P. (2002). Forecasting Konsep dan Aplikasi. BPFE. Yogyakarta. Sumarni, Murti dan Wahyuni. 2006.
Metode Penelitian Bisnis. Yogyakarta. Sumayang, L. (2003). Dasar-Dasar
Manajemen Produksi dan
Operasi.Salemba Empat, Jakarta. Swastha, DH Basu dan Irawan. (2005).
Manajemen pemasaran modern edisi 12 Yogyakarta Liberty.
Tho’in, M. (2011). Pengaruh Faktor-faktor Kualitas Jasa terhadap Kepuasan Nasabah di Baitul Mal Wat Tamwil (BMT) Tekun Karanggede Boyolali. Muqtasid: Jurnal Ekonomi dan Perbankan Syariah, 2(1), 73-89.
Tjiptono, Fandi. (2000). Perspektif
Manajemen dan Pemasaran
Kontemporer, Edisi 1. Yogyakarta: Andi.
Tim Pengembangan Laboratorium Manajemen Menengah. (2006). Manajemen Operasional. Jakarta: Fakultas Ekonomi Gunadarma.