Indonesian Journal of Chemistry, 2004, 4 (3), 145 - 148
Suharso et al
145
GROWTH RATE DISPERSION (GRD) OF THE (010) FACE OF BORAX CRYSTALS
IN FLOWING SOLUTION
Suharso
Chemistry Department, Faculty of Mathematics and Natural Sciences University of Lampung, Bandarlampung
Gordon Parkinson and Mark Ogden
Nanochemistry Research Institute, Curtin University of Technology, Perth, Australia
Received 15 September 2004; Accepted 16 October 2004
ABSTRACT
The growth rates of borax crystals from aqueous solutions in the (010) direction at various flow rates were measured. The observed variations of the growth rate can be represented by a normal distribution. It was found that there is no correlation between growth rate distribution and solution flow under these experimental conditions.
Keywords:Growth rate dispersion (GRD), borax, flow rate
INTRODUCTION
The quality of sodium borate tetrahydrate, Na2B4O7.10H2O, (borax) is solely determined by grade and specifically shaped crystals of high purity [1]. According to Teodossiev and Kirkova [2] the quality of the high-purity product depends both on the concentrations of the impurities and the product appearance, which are mainly determined by the size and morphology of the crystals. Thus, knowledge about crystallization of borax is of direct relevance to the industrial production of borax. In addition, fundamental studies of borax crystallization will provide results of relevance to the crystallization of other economically important materials.
The phenomenon of growth rate dispersion (GRD) leads to size dispersion. Growth rate dispersion means that different crystals of the same size growing under the same external conditions of supersaturation, temperature, and hydrodynamic of solution, grow at different rates [3].
GRD has a significant influence on particle size distribution of the crystalline product in industrial crystallizers especially in the low size range. The consequence of GRD is an enlargement of the number of small slow growing crystals and therefore a reduction of the mean particle size [4].
This paper studies the growth rate dispersion of the (010) face of borax crystal by using in situ cell optical microscopy under various flow rates.
The in situcell optical microscopy was performed to determine the growth rates of the (010) face of borax crystals. The morphology of borax crystal can be seen in Figure 1.
EXPERIMENTAL SECTION
Solubility of borax in water
The driving force for crystallization is usually expressed as a supersaturation ratio, defined as [5]:
*
A
A
S
=
Where A and A* are the initial and the equilibrium solute concentrations. The solubility of borax in water used has been reported by Nies and Hulbert [6] and Sprague [7].
Fig. 1 The morphology of borax crystal [11-13] 100
010 110
001
111
Indonesian Journal of Chemistry, 2004, 4 (3), 145 - 148
Suharso et al
146
2 3 4 5 6 7 8 9 10
40 60 80 100 120 140 160 180
Initial Crystal Size (
µ
m)
Growth Rate (
m/min)
0 ml/min2.5 ml/min
5 ml/min
7.5 ml/min
10 ml/min
Experimental Set-up
In situ cell optical microscopy method described by Lee and Parkinson [8], Lowe et al. [9] and Suharso [10] was used. Optical microscopy in situ growth experiments were conducted using a set up that consists of a Nixon Optiphot-2 Microscope with automated video image capture, a Grant W14 (Grand Instruments Ltd.) circulating water bath, Pulnix TM-9701 Camera (Progresive Scanning Full Frame Shutter Camera), and a Pentium II Computer. The aim of this set up is to keep temperature and supersaturation constant. During the growth experiments, a digital thermometer (HANNA Instruments, HI 8424) monitored temperature in the sample solution compartment. The images of the growing seed crystals were recorded using the video camera and the Optimas Software, Version 6.2 (Optimas Corporation, Bothell, Wa, USA.).
Seed Preparation
The seed solution was prepared from 30 gram of Univar AR grade sodium tetraborate dissolved in 100 mL of Milli-Q water by heating up until 60 °C and filtering through filter paper. The solution was quickly cooled down into petri dish that covered by a transparent plastic, producing 40-200 µm well crystals. Only single seed crystals between 40 -120 µm in size were used to investigate the growth rate.
Preparation of Growth Solutions
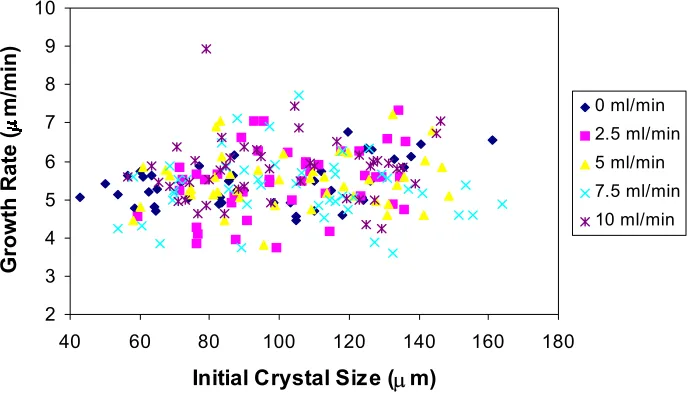
The growth solution was dissolved in 200 mL of Milli-Q water by heating up until 60 °C and filtering through a 0.45 µm filter membrane. The filtered solutions were placed into waterbath at temperature of 25 °C with covered plastic bottle for 3 hours before used. The growth solution was circulated through the cell via peristaltic pump at different flow rates in the range 0, 2.5, 5, 7.5, and 10 mL/min. The experiments were performed at temperature 25 °C and relative supersaturation 0.807. The initial size range of the seed crystals is approximately 40-200 µm. The number of the crystal observed is around 37-53 crystals.
RESULTS AND DISCUSSION
In order to investigate the effect of crystal size on the growth rate, initial crystal size was plotted against growth rate of crystal. Figure 2 shows the growth rates of the (010) face from borax crystals with initial crystal size between 40-160 µm at 25 °C and relative supersaturation of 0.807 under various solution flows. It is clearly seen that the growth rate of borax crystal on the (010) face is not dependent on their initial size or the solution flow, rather growth rates are quite dispersed.
In order to investigate the dispersion in growth rates, the standard errors of the slope of time against length of the crystal plot were calculated by Minitab software version 11. This software also can give descriptive statistics including average, standard deviation, variance, normality test, and so on.
Indonesian Journal of Chemistry, 2004, 4 (3), 145 - 148
Suharso et al
147
4 5 6 7
20 60 100 140 180
Crystal size (
µ
m)
Growth rate (
m/min)
(010) faceAverage
upper
lower
0 0.002 0.004 0.006 0.008 0.01 0.012 0.014
0 50 100 150 200 250 300
Crystal size (µm)
Normal distribution
0 mins
2 mins
4 mins
6 mins
8 mins
10 mins
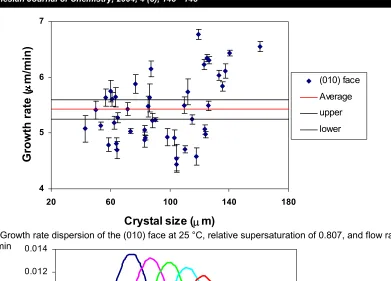
Fig. 3 Growth rate dispersion of the (010) face at 25 °C, relative supersaturation of 0.807, and flow rate of 0 mL/min
Fig. 4 Crystal size distribution measured perpendicular to the (010) face during 10 minutes of growth at 25 °C and relative supersaturation of 0.807.
Figure 3 shows the growth rate dispersion of the (010) face at relative supersaturation of 0.807, temperature of 25 °C, and solution flow of 0 mL/min with calculating error values and the upper and lower limits of confidences at 95% confidence interval (obtained from Minitab Software). The error bars on the growth rate represent ± standard error of the slope. As can be shown from this figure, the growth rate of crystals having an initial size between 100-140 µm can differ between 4.4 and 6.8 µm/min under identical condition.
It is known that growth rate dispersion has significant influence in the widening of particle size distribution of the crystalline product in industrial crystallizers. It is also possible to identify the same
widening in the size distribution from the crystals grown in the insitu cell. From the data in Figure 3, the widening in size distribution can be represented in Figure 4. The increasing of standard deviation as crystals grow can be seen in Table 1.
Indonesian Journal of Chemistry, 2004, 4 (3), 145 - 148
Suharso et al
148
Table 1 Average crystal size and standard deviation during 10 minutes of growth
Time (minutes) 0 2 4 6 8 10
Average size (µm) 94.5 118.3 141.6 163.7 184.4 204.8 Standard deviation
(µm) 29.21 30.12 31.00 32.15 34.12 36.48
Table 2Parameters of growth rate distribution of the (010) face at 25 °C, relative supersaturation of 0.807 under various flows
Flow rate (mL/min)
Parameters 0 2.5 5 7.5 10
N 44 43 44 45 45
GR( m/min) 5.424 5.469 5.476 5.307 5.705
S( m/min) 0.586 0.876 0.715 0.849 0.704
Skewness 0.414 -0.05 0.431 0.351 -0.098 Kurtosis -0.78 -0.54 0.168 0.474 -0.340
P-Value 0.262 0.652 0.260 0.321 0.735
As can be seen from Table 2, the growth rate distributions of the (010) face at different flow rates show normal distribution. All of the p-values are higher than 0.1. In addition, it was established that the coefficient of skewness and kurtosis did not substantially differ from zero. It was found that there is no correlation between growth rate distribution and solution flow under these experimental conditions.
CONCLUSION
1. The growth rate of the (010) face of borax crystal under various flow rates is not size-dependent.
2. The growth rate distribution of the (010) face of borax crystal under these experimental conditions is normal distribution.
3. It was found that there is no correlation between growth rate distribution and solution flow.
REFERENCES
1. Betekhtin, A., 1964, A Course of Mineralogy' Agol, V. and Gurevich, A. (ed), Peace Publishers, Moscow.
2. Dana, E.S., 1949, Minerals and How to Study Them, 3rd edition, John Wiley & sons, Inc., New York.
3. Dana, E.S., 1954, A Textbook of Mineralogy with An Extended Treatise on Crystallography and Physical Mineralogy, 4th edition, John Wiley and Sons, Inc., New York
4. Garret, D.E. and Rosenbaum, G.P., 1958,
American Potash & Chemical Corp, 50, 1681-1684.
5. Lowe, J., Ogden, M., Mc Kinon, A., and Parkinson, G., 2002, J. Cryst. Growth, 238. 6. Lee, M. and Parkinson, G. M., 1999, J Cryst.
Growth, 198/199, 270-274.
7. Mullin, J.W., 1993, Crystallization, third edition, Butterworth-Heinemann Ltd, Oxford.
8. Mitrovic, M.M., Zekic, A.A., and Petrusevski, Lj.S., 1999, J Cryst. Growth, 198/199, 687-691. 9. Nies, N.P., and Hulbert, R.W., 1967, J. Chem.
Eng. Data, 12 (3), 303-313.
10. Sprague, R.W., 1980, In Mellor’s Comprehensive Treatise on Inorganic and Theoritical Chemistry, Vol. 5, London and New York, Longman.
11. Suharso, 2003, Jurnal Penelitian Sains dan Teknologi, 9(2), 45-50.
12. Teodossiev, N. and Kirkova, E., 1982, On The Preparation of High-purity Boric Acid by Crystallization, North-Holland Publishing Company.
![Fig. 1 The morphology of borax crystal [11-13]](https://thumb-ap.123doks.com/thumbv2/123dok/3373896.1758622/1.612.332.512.545.688/fig-morphology-borax-crystal.webp)