TELECOM BIG DATA FOR URBAN TRANSPORT ANALYSIS – A CASE STUDY OF
SPLIT-DALMATIA COUNTY IN CROATIA
M. Baučić a, *, N. Jajac a, M. Bućan b
a Faculty of Civil Engineering, Architecture and Geodesy, University of Split, Matice hrvatske 15, 21000 Split, Croatia
- (martina.baucic, niksa.jajac)@gradst.hr
b Split-Dalmatia County, Domovinskog rata 2, 21 000 Split, Croatia - [email protected]
KEY WORDS: Telecom big data, Heat map, Urban transport, Tourism
ABSTRACT:
Today, big data has become widely available and the new technologies are being developed for big data storage architecture and big data analytics. An ongoing challenge is how to incorporate big data into GIS applications supporting the various domains. International Transport Forum explains how the arrival of big data and real-time data, together with new data processing algorithms lead to new insights and operational improvements of transport. Based on the telecom customer data, the Study of Tourist Movement and Traffic in Split-Dalmatia County in Croatia is carried out as a part of the “IPA Adriatic CBC//N.0086/INTERMODAL” project. This paper briefly explains the big data used in the study and the results of the study. Furthermore, this paper investigates the main considerations when using telecom customer big data: data privacy and data quality. The paper concludes with GIS visualisation and proposes the further use of big data used in the study.
*Corresponding author
1. INTRODUCTION
Today, big data has become widely available. From various sensor data to public and social media data, from historic data in digitized archives to real-time data, from unstructured to structured data, big data are characterised by volume, velocity and variety - the three Vs. (Laney, 2001). The Oxford English Dictionary defines big data as “Extremely large data sets that may be analysed computationally to reveal patterns, trends, and associations, especially relating to human behaviour and interactions.” (English Oxford Dictionary, 2017). Berkeley School of Information asked more than 40 leaders in various industry to define the phrase “big data” (Dutcher, 2014). The results reveal that it is not only about the size of data but also about the tools for retrieving meaningful information from raw data. Big data imposes new challenges to data management and analytics. Thus, the new technologies are being developed for big data storage architecture and big data analytics (NoSQL, Hadoop, Splunk etc.). Looking from the wider perspective, David Leonhardt stated: “Big Data is nothing more than a tool for capturing reality.” (Dutcher, 2014).
International Transport Forum, an intergovernmental organisation with 54 member countries in the Organisation for Economic Co-operation and Development (OECD), drafted a report “Big Data and Transport: Understanding and Assessing Options” (International transport forum, 2015). The basis for the report was desk research, expert inputs, and interviews including both practitioners and researchers. The report explains how arrival of big data and real-time data, together with new data processing algorithms lead to new insights and operational improvements of transport. In this paper, the second section briefly explains potentials of big data in relation to transport.
Based on the telecom customer data, the Study of Tourist Movement and Traffic in Split-Dalmatia County in Croatia
(Žnidarec et al., 2015) is carried out as a part of the “IPA Adriatic CBC//N.0086/INTERMODAL” project (INTERMODAL project, 2015). The project aims to develop intermodal and sustainable transport models in order to support tourism. One of the actions was to analyse demand and transport needs of tourism. This paper briefly explains the big data used in the study and the results of the study. Furthermore, this paper investigates potential use of big data analytics in GIS for urban areas and transport planning.
This paper is organized as follows. The second section briefly explains the use of big data for transport and main considerations when using telecom customer big data. The third section introduces the challenges imposed to urban and transport planning in Split-Dalmatia County. The fourth section describes the study based on telecom big data: description of big data used, retrieved big data analytics and final results of the study. The fifth section presents the use of big data analytics in GIS and proposes further use. Section 6 summarizes the findings and provides conclusions.
2. TELECOM BIG DATA FOR TRANSPORT
Using telecom big data raises a set of specific concerns, the following ones are addressed in this section: potentials of big data in transport, telecom big data services, data privacy and data quality issues.
Transport is about carrying people or goods from one location to another by any type of vehicle or by foot. Today, the paths of vehicles and people are tracked by mobile phones, GNSS devices, credit card transactions, Wi-Fi access, toll roads, social networks etc. The report “Big Data and Transport: Understanding and Assessing Options” (International transport forum, 2015) stresses that “location-based data may contribute to significant improvements in safety, traffic operations and transport planning”. That is because telecom big data are The International Archives of the Photogrammetry, Remote Sensing and Spatial Information Sciences, Volume XLII-4/W3, 2017
significantly increasing the amount of data describing the flow of people and vehicles and enabling data collection in real-time. In transportation safety, real-time data showing positions of vehicles can prevent car accidents. In traffic operations, use of big data enables analysis of the real-time usage of roads and
Telecom companies are collecting massive quantities of customer data and today they are monetizing their databases. This reveals the whole new world of data and data analytics: real-time data of human and vehicle movements, aggregated spatio-temporal data describing population, new types of analysis for urban and transportation planning etc. In brief, smart data for a smart city. Market research in (Mind Commerce, 2013) predicts that “big-data-driven telecom analytics market will grow nearly 50 percent from 2014 to 2019 and forecasts that by the end of 2019, the market will be up to $5.4 billion in annual revenue”. The largest telecom company in Croatia has a database containing 2,3 million customers (out of 4 million inhabitants) and three services based on big data analytics were developed in year 2015: Kupon2go, TV Beat and Heat Maps (Croatian Telecom, 2017). Kupon2go service uses actual location of the mobile phone users and sends offers with discounts via SMSs. TV Beat provides statistics of watching broadcasts by various categories and the number of spectators. Heat Maps service gives comprehensive profiles for the mobile users on the given geolocations, so called “points of interest”, during the given time. In this paper, the big data analytics from the Heat Maps service was used.
Customer databases contain personal data and using personal data reveals issues of customer privacy. Mobile phones are location tracking devices and telecom companies can map customers’ social, professional and private behaviours. Using mobile data showing “when and where he/she was/is” is covered by various regulations over the world. The Forrester’s Data Privacy Heat Map Report gives an overview of privacy and data protection by country (FTI Technology, 2015). The comprehensive report on international data privacy legislation is given in the Global Data Privacy Directory (Norton Rose Fulbright, 2014). In the USA, the telecom industry has to follow the Federal Telecommunications Act of 1996 stating that telecommunications carrier has a duty to protect the confidentiality of proprietary information of, and relating to customers. Also, the law restricts the use of certain customer data, but it permits the use of aggregate customer information (Telecommunications Act, 1996). In the EU, the e-Privacy Directive (e-Privacy Directive, 2009) regulates the processing of personal data and the protection of privacy in the electronic communications sector. The e-Privacy Directive ensures privacy for the content of communication and for metadata that include location and time of calls. The processing of metadata is allowed in case that metadata are made anonymous or in case that customers gave their consent. The current e-Privacy rules cover telecom providers and not the Internet messages and calls services. Thus, the EU is proposing new legislation to ensure confidentiality regardless of the technology used, while allowing companies to process data and develop new services. Still, keeping locations coupled into trajectories discovers daily patterns of person’s activities and can lead to identification of persons. In this paper, Croatian Telecom company produces
heat maps indicating the presence of tourists to help public authorities in transport planning.
Using big data imposes questions of data quality. There are international and national standards describing geospatial data quality aspects, such as ISO 19157 (International Organization for Standardization, 2013). One of the ISO 19157 data quality elements is Completeness (presence or absence of features, their attributes and relationships). Thus, the first question that arises from using customer databases for population studies is: How can the database containing customers only and not all inhabitants provide representative results? The market share taken by the company and exact numbers of customers in different demographic segments can help in interpreting the results. The second question relates to data sampling. In case of using mobile phone locations, the data is recorded only when customers are using mobile phones either for making calls, texting or sending e-mails, uploading photos or for on-line purchasing. Thus, recorded locations have various time sampling intervals: from minutes to hours, weeks or even months. Authors Lu et al in (Lu et al., 2017) undertook a comprehensive study of mobile phone location data on dataset of over 5 million customers and tested the representativeness of data for human mobility studies. Irregular and sparse sampling of location data causes underestimation of total travel distance, movement entropy and radius of gyration (Lu et al., 2017). The authors explain that the presented results could vary depending on urban environment and mobile phone usage habits. Regarding positional accuracy, the authors found that for studies covering urban areas with dense distribution of mobile phone towers, data quality satisfies the needs of human mobility studies. More accurate positional accuracy is retrieved from mobile phones equipped with GNSS and Wi-Fi able to locate phone within five meters (International transport forum, 2015).
3. TRANSPORT NEEDS FOR TOURISM IN SPLIT-DALMATIA COUNTY IN CROATIA
Seasonality in tourism in Croatia is very high which is undesirable because it imposes high demand on physical infrastructure, natural resources, medical and other services, fluctuations in labour demand etc. (Kožić et al., 2013). For illustration, the number of inhabitants in Split -Dalmatia County is 454.798 (Croatian Bureau of Statistics, 2011) and number of tourists was 105.332 on 16th July (Offero Prima, 2016). As the most of the tourists visit coastal area, the number of tourists may exceed the number of inhabitants, e.g. the number of inhabitants in the City of Hvar is 4.251 (Croatian Bureau of Statistics, 2011) and the number of tourists was 5.002 on 16th July (Offero Prima, 2016). Thus, the capacity of the systems such as transportation, water supply, waste disposal etc. significantly exceeds the needs of local population.
The challenge is how to plan and manage the systems to satisfy both population and tourists and to keep the systems financially, socially and environmentally sustainable. Regarding the transport system in Split-Dalmatia County, traffic congestions occur during the tourist season on the roads along the coastline, roads accessing the city centres and harbours, in the ferry harbours and at the airport (Hr turizam, 2015). “IPA Adriatic CBC//N.0086/INTERMODAL” project (INTERMODAL project, 2015) started various actions towards the development of intermodal and sustainable transport models in order to support tourism. Intermodal transport and environmental sustainability are seen as drivers of efficiency and facilitators of tourism. One of the actions was to analyse demand and The International Archives of the Photogrammetry, Remote Sensing and Spatial Information Sciences, Volume XLII-4/W3, 2017
transport needs of tourists. Thus, the Study of Tourist Movement and Traffic in Split-Dalmatia County in Croatia (Žnidarec et al., 2015) is undertaken as a part of the project. The following section briefly explains the big data used and the results of the study.
4. THE STUDY OF TOURIST MOVEMENT AND TRAFFIC IN SPLIT-DALMATIA COUNTY IN CROATIA
The Study of Tourist Movement and Traffic in Split-Dalmatia County in Croatia (Žnidarec et al., 2015) is undertaken as the part of “IPA Adriatic CBC//N.0086/INTERMODAL” project (INTERMODAL project, 2015). The Heat Maps service was used to analyse presence of tourists in the given locations and along the main roads.
The Heat Maps dashboard consists of three panels. In the first panel, a user defines ‘points of interest’ by giving points’ coordinates and radius. In the second panel, a user defines time period (starting and ending date and time) for data collecting and analytics. In the third panel, a user chooses data analytics, filtering and type of reporting, such as tables or charts. The big data analytics will aggregate data for mobile phones passing through the given area in the given time period, so called visitors. Visitors are classified into inhabitants, domestic and foreign tourists based on the residence of the mobile phone user.
The Heat Maps service (Croatian Telecom, 2017) is based on the Croatian Telecom customer database including company’s roaming partners. Signals from mobile phones are continuously registered and analysed. In Croatia, there are 104 SIM cards per 100 people and 90% of users carry their mobile with themselves during all 24 hours (Žnidarec et al., 2015). Data is anonymised and aggregated in one-hour, one-day and one-month time intervals. By use of individual mobile paths assigned to the road segments, the traffic volume is derived. Big data analytics use customer data (age, gender and residence) to produce demographic profiles which could be extrapolated to the whole population by use of census data. The big data analytics used in Heat Maps service is approved by the Croatian Personal Data Protection Agency (Žnidarec et al., 2015).
Comparing Heat Maps service data with the traditional methods of collecting tourist and traffic data, the situation in Croatia is as follows (Žnidarec et al., 2015). Tourist data are collected by Croatian Tourist Board and contains the number of tourists for the settlements aggregated in one-month time intervals. Data are published four times a year. Today, Heat Maps service provides the following data: number of tourists for any location aggregated in real-time in one-hour time intervals. Regarding road traffic data, Croatia is covered by 471 points equipped with sensors measuring number of vehicles. Data are aggregated in one-hour time intervals and published yearly. Today, Heat Maps service provides the following data: traffic data for any road segment aggregated in one-hour time intervals and available in real-time. Data contain the number of vehicles and passengers with demographic profiles. Still, Heat Maps are based on customer data extrapolated to the whole population.
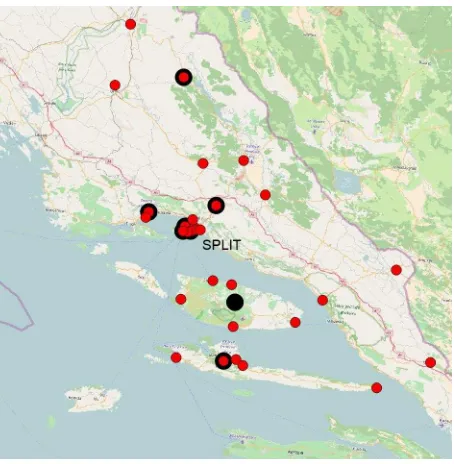
The Study of Tourist Movement and Traffic in Split-Dalmatia County in Croatia (Žnidarec et al., 2015) consists of two analyses. The first analysis includes 10 ‘points of interest’ in the time period from 1st March 2015 to 31st May 2015 (black circles on the Figure 1). The second analysis includes 31 ‘points of interest’ in the time period from 1st June 2015 to 31st August
2015 corresponding to the main tourist season (red circles on the Figure 1). The big data analytics performed is the following: segmentation of foreign tourists by citizenship, segmentation of domestic tourists by residence, segmentation of all visitors by gender and age, and traffic volume on roads’ segments. The following paragraphs give an overview of the main results.
Figure 1: Map showing locations of ‘points of interest’ (the first analysis - black circles, the second analysis - red
circles) (backdrop map © OpenStreetMap 2017)
The first analysis clearly shows that the number of foreign tourists significantly grows starting from the beginning of April with peaks during international events such as regatta, but it does not correlate with the start of cruiser season. For the city of Split and for the time period from April to May, the number of foreign tourist is the following: 30% of tourists are from Bosnia & Herzegovina, 24% from Germany, 9% from the United Kingdom, 8% from the Netherlands, 7% from Italy and 22% from all other countries. Regarding traffic data, the first analysis shows that traffic volume follows the same trend as tourist data on county roads to the airport and ferry harbour. For the main roads in the city of Split, the first analysis clearly differentiates the roads with traffic volume corresponding to the number of tourist and the roads following the pattern of inhabitants (e.g. traffic volume higher during working days than weekends).
The second analysis covers the period of the main tourist season from June to August and examines 31 ‘points of interest’. Figure 2 shows the average number of visitors per day for the city of Split, segmentation by age (time interval: 1st June – 31th August).
Tourists’ segmentation by age shows that in all tourist destinations most tourists belong to the age group of 46-65 years, presenting 35% of all tourists (an average from all analysed destinations). In comparison to the results from the first analysis, the age profile remains almost the same in pre-season and main pre-season only for the city of Split, while in other destinations there is an increase of younger population for approximately 12% (an average from all analysed destinations). The number of tourists has two significant peaks: the first one corresponds with the international music festival and the second The International Archives of the Photogrammetry, Remote Sensing and Spatial Information Sciences, Volume XLII-4/W3, 2017
one with the first weekend in August. Interestingly, the first peak appears in all examined locations regardless of the fact that the music festival is located in the city of Split. This clearly shows the positive effect of such events on the whole region. Regarding the tourist residence, the city of Split has visitors from 106 countries, the island of Hvar from 75 countries and the island of Brač from 53 countries. In comparison with the first analysis for the pre-season period, the number of foreign tourists from Bosnia and Herzegovina drops from 30% to 6% in the main tourist season.
Figure 2: City of Split: average number of visitors per day, segmentation by age (time interval: 1st June – 31th August)
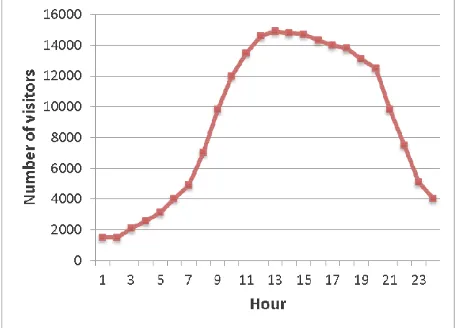
Figure 3: Poljička street: distribution of passengers by hour on 3rd August 2015.
Analysis of traffic data covers the main roads in Split-Dalmatia County and the main roads in the city of Split. For the county roads, the main result is: the number of inhabitants is approximately five times higher than the number of tourists, for the whole analysed time period and all county roads. As for the city of Split roads, the number of inhabitants is approximately ten times higher than the number of tourists in the analysed time period. From the big data, the total number of passengers on the ‘points of interest’ along the road segments is derived for every hour. For example, the main entrance point to the city centre has a total number of 220.000 passengers for 3rd August and achieving a peak between 11:00 and 12:00 (Figure 3). Hourly distribution of passengers on the city roads shows similar patterns during mornings but different patterns during afternoons.
The results described above clearly show the presence of tourists in the given locations and along the main roads. For the first time, the demographic profile differentiates visitors by gender, age and residence. Now, the public authorities have detailed data about tourist movement that can be used for urban and transport planning. Raw big data is not available, but aggregated data in one-hour time intervals and further aggregated per day, week and months is presented in the forms of tables and charts. The potential use of the data in GIS is briefly described in the following section.
5. GIS VISUALIZATION AND GEOSPATIAL ANALYSIS
The big data analytics used in The Study of Tourist Movement and Traffic in Split-Dalmatia County in Croatia is not described. The study gives the results in form of time series of geolocated data. For the 10 ‘points of interest’ in the first analysis and 31 ‘points of interest’ in the second analysis, various data describing visitors is collected and aggregated to the period of 1 hour. Thus, for each ‘point of interest’ data could be presented in one table composed of columns showing aggregated properties describing visitors (e.g. a number of visitors, average age, gender percentage etc.) and rows showing data for the particular dates and time (Table 1). In GIS, time series of geolocated data could be further visualised and used for geospatial analysis.
Date/time Latitude Longitude Number of visitors 01/06/2015 43,51180 16,48388 495634 08/06/2015 43,51180 16,48388 482694 15/06/2015 43,51180 16,48388 501322 22/06/2015 43,51180 16,48388 472859 29/06/2015 43,51180 16,48388 506883 06/07/2015 43,51180 16,48388 520890 13/07/2015 43,51180 16,48388 476334 20/07/2015 43,51180 16,48388 485772 27/07/2015 43,51180 16,48388 502283 03/08/2015 43,51180 16,48388 684891 10/08/2015 43,51180 16,48388 469377 17/08/2015 43,51180 16,48388 487732 Table 1. An excerpt for one ‘point of interest’ showing time
series data: aggregated number of visitors per week
The process of analysing telecom big data must tackle with the spatial distribution of a large number of points (locations of mobile phones) and thus the service is called Heat Maps (Perrot et al., 2017). The term ‘heat map’ could be described as a map showing the geographic density of a certain property, e.g. population by using red colours in the high-density areas and blue in the areas of the lowest density. Heat maps could be created by interpolating values from points and thus creating a continuous surface called the density surface. In the presented study, time series of geolocated data already represents the density of point features: number of mobile phones around the given location as aggregated numbers for given time intervals. Therefore, there is no rationale to create heat maps from the study data, to try to interpolate values and create the density surface. However, the heat map renderer is used to visualise the attribute data of point features.
Time series of geolocated data have been imported and visualised in QGIS (QGIS, 2017), an open-source desktop The International Archives of the Photogrammetry, Remote Sensing and Spatial Information Sciences, Volume XLII-4/W3, 2017
geographic information system. The following paragraphs describe the process.
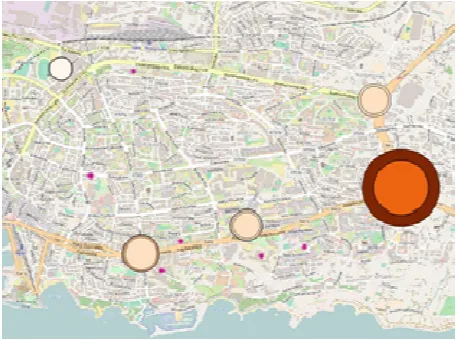
Time series of geolocated data are restructured and imported as comma separated values (CSV) files. For further processing, data is stored as ESRI shp file. Visualisation of time series data using point symbols with varying radius and colour (Figure 4) has not adequately presented the phenomena: the changing number of visitors in time. The heat map renderer is used together with Time Manager plug-in (TimeManager, 2017) in order to produce animations. Two animation snapshots are shown in Figures 5 and 6.
Figure 4: Point symbols showing the number of visitors per weeks (backdrop map © OpenStreetMap 2017)
Figures 4, 5 and 6 visualise one data attribute: the number of visitors. To visualise multiple attributes such as the number of visitors and the visitors’ classification into inhabitants and tourists, QGIS offers two options. The first option is to style points based on the multiple attributes and animate the layer with Time Manager. The second option is to create multiple layers each visualising one of the attributes and animate all the layers together in Time Manager. Several animations have been produced, e.g. using the radius of points representing the number of visitors, and intensity of colour for representing the percentage of tourists. It has been challenging to observe the two visual variables (size and colour) both varying in time, therefore further investigation should be performed in order to evaluate what information is conveyed to an observer. In the particular case where points are not moving but only the attribute values are changing, the use of multiple layers in Time Manager has caused overlapping of the symbols and again the same question arises: What information is conveyed to an observer?
For the purpose of the urban and transport planning, the above mentioned time-series of geolocated data could be overlapped with GIS data describing road networks, parking facilities, public transportation, traffic management, etc. Today, real-time data describing the actual capacity are collected on parking sites, the vehicles used in public transport are equipped with GNNS devices sending locations to the company’s database, traffic coordination data is held by the city’s or police’s departments, etc. Today’s challenge is to integrate the data and perform the spatio-temporal analysis. Real-time data and analysis could serve as a basis for innovative traffic and mobility management services with the aim of maximising
transport capacity using existing physical infrastructure. The ‘smarter’ use of the transport network is particularly important for the cities with the high seasonality in tourism, such as the city of Split. The study presented in the paper reveals the patterns of mobility and the use of roads by inhabitants and tourists. So, together with other urban data, it could serve urban planning purposes.
Figure 5: Animation snapshot: heat map renderer showing the number of visitors on 1st June 2015. (backdrop map ©
OpenStreetMap 2017)
Figure 6: Animation snapshot: heat map renderer showing the number of visitors on 20th July 2015. (backdrop map ©
OpenStreetMap 2017)
Dealing with the time series of geolocated data requires spatio-temporal models: for data, for relations, for operations, and for visualisation. Software should offer spatio-temporal structures for storing, algorithms for processing and tools for visualisation of spatio-temporal data. Besides technical challenges, the legal and institutional framework should be set-up for the use of data and for the coordinating efforts in urban and transport planning. The future research will focus on the modelling of spatio-temporal analysis of urban and transport planning. The challenge will be to plan transport systems to satisfy both population and tourists and to keep the systems financially, socially and environmentally sustainable.
6. CONCLUSIONS
There is much potential of big data in relation to transport. Telecom big data describe the flow of people and vehicles and thus provides urban dynamic in real-time. Data privacy legislations allow telecom companies to process customer data and develop new services, but the prerequisite is to make the data anonymous. Using telecom big data one should concern data quality issues, particularly completeness, data sampling intervals and positional accuracy. To analyse the demand and transport needs of tourists, The Study of Tourist Movement and Traffic in Split-Dalmatia County in Croatia is undertaken as the part of “IPA Adriatic CBC//N.0086/INTERMODAL” project. The Heat Maps service of the Croatian Telecom company was used to analyse the presence of tourists in 41 locations called ‘points of interest’. The big data analytics used by the Heat Maps service is not described. For the first time, the demographic profile differentiates visitors by gender, age, and residence. Raw big data is not available, but the results are presented in the form of time series of geolocated data aggregated per hour and further aggregated per day, week and months. Several GIS visualisations have been created using heat map renderer and Time Manager plug-in. It has been challenging to visualise the multiple attributes changing in time. For that reason, further research should be done to evaluate what information is conveyed to an observer. Today’s challenge is to integrate big data analytics into traffic and mobility management services and to achieve ‘smarter’ use of transport networks. Therefore, the future research will focus on the modelling of spatio-temporal analysis for urban and transport planning.
REFERENCES
Croatian Bureau of Statistics, 2011. Census 2011, Zagreb, Croatia http://www.dzs.hr/Hrv/censuses/census2011/results/htm /H01_01_01/h01_01_01_zup17.html (12 May 2017).
Croatian Telecom, 2017. Heat Maps, Zagreb, Croatia https://www.hrvatskitelekom.hr/poslovni/ict/medijske-digitalne-usluge/heat-maps (12 May 2017).
Dutcher, J., 2014. What Is Big Data? UC Berkeley School of Information, California, USA https://datascience.berkeley. edu/what-is-big-data/ (12 May 2017).
English Oxford Dictionary, 2017. https://en.oxforddictionaries. com/ (12 May 2017).
e-Privacy Directive, 2009. Council Directive 2002/58/EC of 12 July 2002 amended by Council Directive 2006/24/EC and Council Directive 2009/136/EC, Brussels, Belgium http://eur-lex.europa.eu/legal-content/EN/TXT/?uri=URISERV%3Al2412 0 (12 May 2017).
FTI Technology, 2015. The Forrester’s Data Privacy Heat Map Report, USA http://www.ftitechnology.com/resources/white-papers/forrester-research-data-privacy-heat-map (12 May 2017).
Hr turizam, 2015. Transport infrastructure stops tourist development, Split, Croatia http://hrturizam.hr/prometna-infrastruktura-koci-splitski-turisticki-razvoj/ (12 May 2017).
INTERMODAL project, 2015. IPA Adriatic CBC//N.0086/ INTERMODAL http://www.intermodality.eu/ project/summary-of-the-project (12 May 2017).
International Organization for Standardization, 2013. ISO 19157:2013 Geographic information - Data quality, Geneva, Switzerland https://www.iso.org/standard/32575.html (12 May 2017).
International transport forum, 2015. Big Data and Transport: Understanding and Assessing Options, Paris, France https://www.itf-oecd.org/sites/default/files/docs/15cpb_bigdata _0.pdf (12 May 2017).
Kožić, I., Krešić, D., Boranić-Živoder, S., 2013. Analiza sezonalnosti turizma u Hrvatskoj primjenom metode Gini koeficijenta. Ekonomski pregled, 64 (2), pp. 159-182.
Laney, D., 2001. 3D Data Management: Controlling Data Volume, Velocity, and Variety. Technical report, META Group
Lu, S., Fang, Z., Zhang, X., Shaw, S.-L., Yin, L., Zhao, Z. & Yang, X., 2017. Understanding the Representativeness of Mobile Phone Location Data in Characterizing Human Mobility Indicators, ISPRS International Journal of Geo-Information 6 (1), 7.
Mind Commerce, 2013. Big Data and Telecom Analytics Market: Business Case, Market Analysis & Forecasts 2014 – 2019, London, UK http://www.prweb.com/releases/2013/11/ prweb11359122.htm (12 May 2017).
Norton Rose Fulbright, 2014. Global Data Privacy Directory http://www.nortonrosefulbright.com/files/global-data-privacy-directory-52687.pdf (12 May 2017).
Offero Prima, 2016. Number of tourists: Hvar, Hvar, Croatia http://www.otok-hvar.com/hr/vijesti-najave/broj-turista-baska-voda-makarska-i-okrug-vode-hvar-deveti-682 (12 May 2017).
Perrot, A., Bourqui, R., Hanusse, N., Lalanne, F. & Auber, D., 2015. Large Interactive Visualization of Density Functions on Big Data Infrastructure. In: 5th IEEE Symposium on Large Data Analysis and Visualization, Oct 2015, Chicago, United States.
QGIS, 2017. QGIS - A Free and Open Source Geographic Information System http://www.qgis.org/en/site/ (12 May 2017).
Senseable City Laboratory, 2007. WikiCity Rome Project, Massachusetts Institute of Technology, Cambridge, USA http://senseable.mit.edu/wikicity/rome/ (12 May 2017).
Telecommunications Act, 1996. USA https://transition.fcc.gov/ Reports/1934new.pdf (12 May 2017).
TimeManager, 2017. TimeManager: Create animations visualizing spatio-temporal data. QGIS Python Plugins repository https://plugins.qgis.org/plugins/timemanager/ (12 May 2017).
Žnidarec, S., Marić, T., Turković, T., Bogadi, D. & Weber, N., 2015. Analitičko praćenje kretanja turista i prometa na području Splitsko-dalmatinske županije. Hrvatski Telekom Zagreb, Croatia.