Balancing the Load
An investigation into the reduction of peak electrical load using a
delay based appliance synchronization program within a domestic
context
By Cameron Beggs
Supervised by Dr Nick McCullen
Civil Engineering Dissertation
Department of Architecture and Civil Engineering University of Bath
April 2015
3
Abstract
The way electricity is produced in the UK is currently changing, with renewables being increasingly utilised and the concept of community energy schemes growing in popularity and feasibility. It therefore makes sense that the way electricity demand and supply are balanced should be reviewed. The large scale and reactive nature of current load balancing techniques are detrimental to the efficient of the system, which raises the question of whether it is possible to use smaller, community based schemes to reduce the load imbalances at source.
This paper intends to establish if there is any feasibility to using a de-centralised system that increases the load factor of domestic electrical demand at a local level, and therefore reducing the quantity of load balancing required. The proposed system will attempt to improve the load factor and reduce the peak loading of groups of up to 100 houses by synchronising the electrical load signatures of suitable domestic appliances. The opportunity to synchronise will be created by allowing the use of a short delay on appliance operation, up to 15% of the appliance cycle length. For this research, the appliances deemed suitable were washing machines and dishwashers. In this paper, a model was developed to test the proposed system in a variety of scenarios in order to gain an understanding of the effectiveness of the concept. Factors tested included the number of houses and maximum length of delay period. The effects of profile variation was also investigated.
Results of these tests showed that the dishwasher was the most effective appliance and that peak load reduction of 20% could be achieved on appliance loads when maximising the delay period to 15%. The reliability of positive results improved with the maximisation of the delay period and by increasing the number of houses in the system to 100.
4
Acknowledgements
5
Contents
Abstract ... 3
Acknowledgements ... 4
Introduction ... 7
Literature Review ... 8
Introduction ... 8
Current UK load balancing ... 8
Demand Side Balancing Services ... 9
Domestic DSM systems ... 10
Appliance re-programming ... 10
Load factors ... 11
Dynamic Demand Response ... 11
Additional benefits of DSM ... 12
Literature Review Conclusion ... 13
Research ... 14
Study Objectives and Proposed System ... 14
Data Selection ... 14
Load Profile Data ... 14
Probability Data ... 15
Validation of data ... 15
Investigation into suitable appliances ... 15
Analysis ... 15
Results ... 17
Methodology ... 18
Measuring the effectiveness of the system ... 18
Stage 1 – Single house and single appliance ... 18
Model Coding ... 18
Stage Two – Single Appliance Type in Multiple Houses... 19
Model Coding ... 19
Testing Summary ... 20
Test One – Number of Houses within the system ... 21
Test Two – Appliance load profile variation ... 21
Test Three – Delay period variation ... 21
Test Four – Load profile inaccuracy test ... 21
Results ... 22
6
Test Two – Appliance load profile variation ... 23
Test Three – Delay period variation ... 23
Test Four – Load profile inaccuracy test ... 24
Discussion ... 25
Analysis of Results ... 25
Occasional Peak Load Increase – Negative Results ... 25
Results shown without whole house load ... 25
Test 1 – Number of Houses within the system ... 25
Test 2 – Appliance load profile variation ... 27
Test 3 – Delay period variation ... 28
Test 4 – Load profile inaccuracy test ... 28
Model Limitations and Assumptions ... 30
No Variation ... 30
Program Selection ... 30
Discussion of synchronisation method ... 30
Verification of data ... 30
Practical Limitations ... 31
Communication between appliances ... 31
Delay control ... 31
Financial motivation ... 31
Conclusions ... 33
Further research opportunities... 34
7
Introduction
Electricity is fundamental to the development and growth of most countries, not least in the UK. It is used in almost every aspect of society and it is therefore essential that the electric supply is constant and reliable. Electrical load balancing is a vital aspect of maintaining a reliable electricity supply with the effects of mishandling load balancing resulting in power cuts, and the financial and social costs associated with this[1].
Currently, electrical load balancing is predominately achieved by matching electricity generation with electrical demand at all times. In practise, this means predicting the upcoming electrical demand of the consumers and ensuring the correct amount of electricity generation is on supply at the right time. This is an ongoing process that all large scale electrical networks must undertake to ensure reliability of supply. In the UK, the balancing of the entire national electricity network is a service undertaken by National Grid[2].
There are several issues with this centralised, top down approach to electrical load balancing, especially as renewable sources become an increasingly large proportion of the energy supply. The passive approach of only controlling the generation of electricity causes the need for significant back-up generation capability and spinning reserve, power stations generating but not connected, to react to changes in electricity demand. Secondly the centralised nature of the system means that the imbalances are measured and corrected at national scale where they have been compounded to significant levels[3].
More recently, National Grid have started to implementing methods of controlling the demand of electricity as well as controlling the generation. Current schemes used by the National Grid are discussed in the literature review section of this paper, however again they are notably top down approaches. This control of electricity demand is referred to as demand side management (DSM).
This raises the question as to whether a de-centralised, bottom-up load balancing system could be employed to fully or partially balance energy demand and generation in order to reduce the amount of reserve generation that is on standby at all times. Either demand side management or generation side principles could be employed at local levels. There is currently a lot of research into the use of micro-renewables and energy storage systems to balance load however there have been less research into dynamic demand side management systems to actively balance load. This paper will therefore focus on investigating a de-centralised load balancing system that uses demand side management.
The use of DSM systems can also have other benefits including social, financial and environmental benefits, as discussed by Ofgem in their review of non-traditional business models in the energy sector[4]. One such benefit of some DSM systems is the reduction in peak loading which can help increase the spare capacity in an electrical network[5]. This is discussed further in section 2.4 of the literature review.
8
Literature Review
Introduction
This literature review will focus on building an understand of the methods and schemes currently used to balance electrical supply and demand in the UK, and what research has been undertaken on DSM to date.
Current UK load balancing
Up to 53GW of electricity is consumed across the UK at any one time and the responsibility of balancing the generation of power with the level of consumption on a day to day basis is undertaken by National Grid[6]. National Grid constantly monitors the electrical supply and uses a number of different services/controls to ensure the network remains balanced[7].
Load balancing is undertaken using several different methods, at several different time scales. It is important to recognise that load balancing is not just a near immediate demand response issue. Load balancing is a long, medium and short term problem that requires constant action at each timescale. Predicting the UK’s energy demand in decades to come is essential in understanding what new power sources need to be planned, designed and constructed. This will increasingly become a larger problem as more renewable energy source are implemented into the energy network and supplies become more unreliable and less flexible[8].
In the long term National Grid use historic data and event analysis, to forecast electrical demand for coming days, weeks and months. This allows them to schedule additional power sources if and when required[2]. In the short term, a number of different methods are utilised and a summary of these is shown in Table 1.
Table 1: A summary of short term load balancing schemes operated by the National Grid[9]
Load Balancing
Power stations operating off grid are connected to increase generation. Some large electricity consumers, such as aluminium smelters[5], are also turned off as a response to the frequency. Fast reserve 2 minutes This activates on
receipt of an
20 minutes This activates on receipt of an
electronic instruction from National Grid
Backup generators are started and large electrical consumers, who are again contracted, shutdown energy intensive processes.
9
Figure 1: Timeline of the load balancing actions used in the UK. Shown against typical time required for planning and impletmentation[9]
Demand Side Balancing Services
The term ‘demand side’ refers to services that operate by altering or affecting the demand of the electrical supply.
This is opposed to ‘load side’ services that are essentially affecting the quantity of electricity generated[8]. The one limitation with current load balancing systems and services in the UK is described by the review paper named “Demand side management: Demand response, intelligent energy systems, and smart loads”, where it states “The classical modus operandi of electric energy systems is unidirectional and top-down oriented.”[10]
This suggests that there may be scope to tackle electrical load imbalances at source rather than at a national scale where the effects have been compounded.
One of demand side management’s main advantages is that it is often less expensive to control demand to an extent rather than build new power stations or energy storage devices in the pursuit of a balanced energy network[10].
In the paper, Palensky and Dietrich also note a number of problems associated with the use of some demand side management (DSM) techniques, such as the risk of damaging the quality of processes involved in the system. For example the curtailing of particular building comfort systems, heating, ventilation or lighting, simply for the benefit of reducing load for a short period.
An addition knock on effect is identified in the form of overcompensation after the peak reduction period has been completed, to the extent that a greater peak is created afterwards. Since most appliances and building service processes are programmed to operate in the most efficient way, the effect of delaying a device process for a period may prevent optimum operation and cause the device to work more intensely, after the period has finished, to return to its design parameters. Not only could this cause greater peaking but also increase the overall energy consumption of the process as it is pushed from its optimised cycle.
The paper “The concept of demand-side management for electric utilities” categorises the various ways in which DSM can operate and are shown graphically in Figure 2 in the form of load profile alterations[10][11].
10
Figure 2: Demand side management electrical load balancing categories shown in the form of load profile graphs with electrical consumption shown against time[11].
Peak clipping – Reducing loading at peak periods. This effect can be generated by turning off non essential devices and processes at peak loading times.
Valley filling – Opposite of peak clipping, valley filling means increasing load at energy demand low points during the day. This can be achieved by turning appliances on during the relevant periods.
Load shifting – This method redistributes electricity demand, specifically moving energy load at peak times to demand periods of low demand. It therefore has the combined effect of peak clipping and valley filling.
Strategic conservation – This essentially refers to programs that not only help to reduce peak demand but also overall demand. It has the effect of smoothing out peaks. It is manifested in improved efficiency of industrial processes or electrical devices.
Strategic load growth – This refers to the changing of load profiles in order to assist in Valley filling. A
major example would be that of switching from ‘other fuel’ based heating to electrical heating. This would potentially increase electrical loading during low electrical demand periods, thus smoothly out load profiles.
Flexible load shape – This refer to load profiles which consist of load generated from flexible sources, where there is no detrimental effect caused by the device operating in any manner.
Domestic DSM systems
This section will focus on existing research of DSM systems applied to the domestic sector, where load imbalances can be corrected at source. If peaks generated by everyday domestic appliances, such as kettles and ovens, could
be “offset” or coordinated at the generation source then the peaks created within single dwellings may be significantly reduced. For example if two appliances with heating elements synchronised their modulated heating
cycles so that as one was operating the other was in its ‘off’ section of its cycle then the combined consumption
at any time would not exceed the consumption of just a single appliance. This peak reduction would then be passed on to the electrical network and prevent that particular peak event from being imposed on central UK load balancing services. Several research papers have investigated different approaches to this.
Appliance re-programming
A research paper by Newborough and Augood named “Demand-side management opportunities for the UK domestic
11
For example, appliances such as kettles are designed to heat water as rapidly as possible for the user. This results in sharp peaks that may only last a few minutes. This is also applies to the heating elements in ovens which create sharp peaks on a cycle as they heat up the air within the oven. The fact that ovens operate by cycling their heating elements on and off rather than by maintaining the elements consistently on means that there is potential for offsetting the cycle peaks using other appliances that operate on a cycle by alternating the “on” periods of each appliances.
Newborough and Augood note that in general the load generated by the heating requirements within an appliance are ten times higher than the appliances other uses. Significantly, this may suggest that by operating the heating cycle of two appliances alternately, the peak load could be almost halved.
It states that the loads generated from non-heating appliances, such as TV or radios are often relatively low and therefore any reprogramming would not result in worthwhile peak load reductions. Lighting is also difficult to modulate due to its essential nature. It therefore concentrates on appliances with heating elements since that’s where the largest improvements could be made[3].
Critically, although the philosophy behind the research is sound, the major issue with the scheme is that appliances have a set operation programs and altering these post production is not a viable option. However, as noted, it would be useful for manufacturers to adopt some of the load conscious programs outlined in the paper.
The paper also identifies quite simply that one of the easiest methods of reducing peak loading would be to target ovens and hobs, as the appliance causing the largest peak loads, and switch to a gas fuelled version.
It summarises by also suggesting that more load conscious tariff systems could be adopted by energy suppliers whereby customers are penalised for using large amount of electricity during peak periods. This would be similar
to the current ‘Economy 7’ tariff, however with shorter and more numerous peak periods.
Load factors
From a demand side management perspective the measurement for success in improve load balancing is to be producing a higher load factor for the profile in question. A load factor is essentially the ratio between the mean electrical consumption and the peak electrical load consumption. For any system the ideal load factor would be 100% (1.0), indicating that peak consumption was equal to the average consumption. It was found that domestic load factors ranged from 6-43%, typically lying between 8-15%[3]. This demonstrates quite clearly that each domestic property individually performs very poorly and that there is significant room for improvement. It must, however, be noted that the load factor of an individual property does not represent the profile of multiple properties, as the varying nature of resident’s habits (for example, eating times) means that simultaneous load generation is unlikely, therefore creating smoother profile is created.
Dynamic Demand Response
The paper “Potential for domestic dynamic demand-side management in the UK” by Infield and Short focuses on current research in dynamic demand response control whereby domestic appliances are used to respond directly to the frequency of the network[12].
12
Currently the frequency is monitored by National grid whose frequency response service ensures the frequency is kept with legal operational limits (49.2-50.2hz)[12].
In the paper, Infield and Short, analyse the benefits of a system that employs fridges and freezers in the UK to provide electrical frequency control in the first instance. It exploits the thermal storage properties of fridges and freezers to allow them to operate their compressors based on the frequency of the energy network at any point in time rather than based on a fixed cycle. In other words, due to fridges and freezers being thermally insulated, the compressor inside can be turned off for a length of time without a detrimental effect on its contents. By turning each fridge into an independent frequency regulator the research shows that savings can be made on the current balancing system used for immediate response.
The paper uses a national scale model with 40 million dynamic demand units, to estimate the effectiveness of the system and concludes that it would successful assist the frequency response of the UK electric supply[12]. It continues by suggesting that the system would also be financially viable, although it should be noted that the economic assessment is very brief with little detail.
The major disadvantage to this type of system is the consumption spike that lags behind after a response event has initiated. Infield and Short acknowledge this limitation and it is a well reported problem with many frequency response DSM techniques[13][9].
Additional benefits of DSM
Reducing the imbalances of the UK electrical network provides financial benefits to the National Grid, through a reduction in the scale of services they would need to provide. A proportion of these savings, could then be passed on to consumers. Currently, however, only 1% of consumers’ energy bills are related to the cost of load balancing services[2]. This is a relative small sum and uptake of a DSM system may prove slow, or even no existent, if financial benefit for the National Grid was the only motivation.
There are, however, a large number of other benefits to the use of DSM for distribution network operators (DNOs). DNOs are companies that build, own and maintain the UKs distribution level electrical networks. Their role, amongst other things, is to ensure that electrical networks have the capacity to supply the properties and infrastructure connected to their network. This means that as new developments and infrastructure are constructed they must recalculate the electrical demand that will be generated and determine if reinforcement is required to the existing network. This is potentially where the use of DSM system could reduce or eliminate the need of reinforcement. This principle was reiterated by Western Power Distribution during a talk at a Community Energy conference in January 2015[13].
13
By reducing the coincidence factor, spare capacity could be created within the network boundaries. This could have large benefits where new housing or commercial developments wish to be connected to the electricity network, by potentially preventing the need to reinforce the existing network infrastructure.
This is a concept that G.Strbac reiterates in “Demand side management: Benefits and challenges” by saying that the use
of DSM systems to reduce the pressure on electrical network nearing capacity has not been widely considered, in spite of the high costs of network reinforcement that it could prevent[5]. Adding further weight to the concept are the Electricity Networks Strategy Group (ENSG) who again support the investigation into new systems and technologies to assist in network capacity reinforcement and recognise that there are increasingly more opportunities for emerging solutions[16].
In addition, as the use of electric powered vehicles become more prominent there are concerns regarding the capacity of electrical network infrastructure[15]. The use of DSM systems may have an opportunity to form part of the solution to this concern.
There are however issues with the use of DSM in network capacity roles and Strbac notes that some DSM systems can have an actively negative effect on coincidence factors of electricity networks[5]. In systems that control the operation of appliances to correct load imbalances, this is because after many appliances have been turned off to reduce demand, they often simultaneously turn back on, to fulfil their primary function, and thus create another large peak in demand.
Literature Review Conclusion
The literature review has shown that although there is significant research being undertaken on domestic load balancing methods, little research has been carried out on de-centralised systems of appliances that interact with one another with the purpose of balancing load locally. Focuses have been on either centralised control of DSM or on the interaction and operation of individual devices, such as frequency response. Therefore it would seem reasonable to investigate a peak electrical load reduction system that allows appliances to interact and coordinate their operation and cycling.
From the research reviewed it can be interpreted that significant peak load reduction need not require complete appliance rescheduling but in fact just a synchronisation of appliance load signatures. The modularity of energy consumption that is typical of many domestic appliances is a characteristic of load profiles that has not been utilised by DSM techniques to date.
Acting in a de-centralised and localised manner also means that there is potential to reduce the design coincidence factor of electricity networks, thus adding an additional, and perhaps more financially robust, benefit.
14
Research
Study Objectives and Proposed System
This research will analyse the effectiveness of a demand side management system that uses appliance synchronisation to reduce peak electrical load a domestic context. The effectiveness will be assessed based on the peak load reduction and load factor increase achieved by the system in several simulated scenarios. The results will be compared with simulated scenarios where no peak reduction system is employed.
The system will utilised a short delay, in the form of a percentage of the appliance cycle length, to provide a range of start times for the appliance. Within this range the most optimum start time will be calculated and the appropriate delay put onto the appliance being synchronised. By undertaking this procedure on each appliance within the system the peak load and load factor will, in theory, decrease and increase respectively.
The system involves many variables that will be discussed and analysed throughout the methodology and discussion sections.
Data Selection
Load Profile Data
Accurate and high resolution data at both dwelling and appliance level was required to carry out the research. The data needed to be of high resolution to allow the proposed system to synchronise load profiles as accurately as possible and over potentially short periods of time.
Data from an open source was chosen to be used as it was, at the time of writing, the highest resolution open source data available of the UK domestic sector. The data was complied by Jack Kelly and William Knottenbelt and contained readings of every household appliance at a 6-second resolution over an approximately 1-2 year period. Data from two houses was selected for use and a summary of the study meta-data can be found in Table 2 below.
Dwelling information House 1 House 2
Type of dwelling End of terrace End of terrace
Year of construction 1905 1900
Number of occupants 4 2
Occupant description 2 adults, 2 young children (one born during metering), 1 dog
2 adults, 1 working out all day and the other sometimes at home.
First Measurement 2012-11-09 2013-02-17
Last Measurement 2015-01-05 2013-10-10
Total Duration 786 234
Table 2: Summary of open source meta data [17]
It is essential to understand the demographical characteristics of the profile data, as shown in Table 2, so that the probability data could be matched from similar properties to ensure accuracy of the modelling results. Due to the limited data available, it was not possible to match every characteristic. Number of occupants and type of occupant were considered the predominately important parameters, because appliances are typically driven directly by human behaviour, and therefore the probability data obtained matched these characteristics.
15
Probability Data
In addition, further data was obtained from a study undertaken by the University of Strathclyde that showed the probability of appliances being used at particular times of the day, as well as the average number of times an appliance was used per day. The data had been collected from a housing estate that contained a mixed demographic. Although the building type was not consistent with the load profile data it was deemed acceptable for use in the model because the demographic match was good, with the data from the 2 adult with 2 children section being used. This means that the accuracy of interactions and potential for synchronisation is as true to reality as possible with the data available[18].
Validation of data
The modelling script requires that all meter reading data be consistently at 6-second resolution. This means that if readings are missing from the appliance data then the error is carried onto each subsequent reading. For example, a 12 second gap between readings would cause each subsequent data point to represent a reading 6 seconds earlier than occurred in reality. Therefore, each piece of meter reading data is checked and validated before being included into the synchronisation model.
A validation script was written using MathWorks MATLAB[19] to perform this operation. When gaps in the data were discovered, the validation script inserted additional readings to maintain the 6-second resolution. The new values added were of equal value to the reading prior to the data gap. Since there is no way to know what the readings should have been as this was deemed the most suitable approach to repairing the data gaps.
Investigation into suitable appliances
In order for the proposed synchronisation system to work effectively it is first essential to understand the types of domestic appliances and the properties of their typical load signatures. This will help gain an initial understanding into which domestic appliances are more or less suitable for use in the scheme.
A number of appliance properties and factors were considered when determining the suitable appliances. These were as follows:
1. Level of peak loading reduction potential 2. User interaction level
3. Length of operating cycle
4. Likelihood and scale of load profile variation 5. Percentage ownership of appliance in UK
A shortlist of likely suitable appliances was made in order to begin the assessment. The appliances deemed to have merit in investigating were as follows:
Washing Machine, Dishwasher, Tumble dryer, Electric Oven, Microwave, Refrigerator, Kettle and Toaster.
All audio-visual appliances were disregarded due to their naturally high user interaction level, owing to their primary purpose of entertainment. Most audio-visual equipment also has relatively low peak electrical consumption in comparison to kitchen appliances. For example a typical laptop charging has a peak power consumption of 85W [20], compared to a dishwasher using 2000W at peak, meaning that its potential for peak load reduction is minimal regardless of the associate disruption that would be caused to consumers. This is supported by findings in the literature review [3].
Analysis
16
potential for the appliance to help reduce overall peaks if synchronised appropriately. For example, an electric oven modulates its heating cycle to maintain a temperature once it has been reached. This means it repeatedly turns its heating element on and off and since the heating element effectively represents the only load drawn then there is a high potential for other appliances to draw load during the oven off period.
For appliances of high peak load reduction potential the load factor should be as low as possible, as this represents the largest difference between peak and average loading and therefore provided the most potential for improvement to be made by aligning the load profile appropriately.
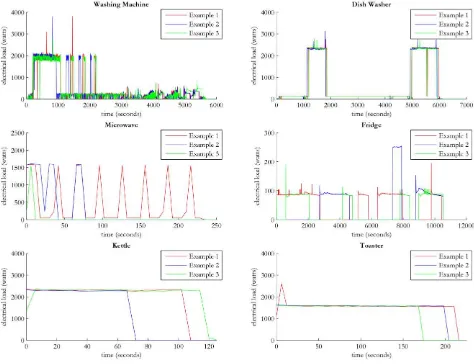
Figure 4 shows three example load signatures of each appliance being investigated. These provided the basis for the results shown in Table 3.
User interaction level is the level of direct and focussed attention the user has with the appliance. For example a TV is used with near constant user focus whereas a fridge has almost zero user interaction. Under this parameter, suitable devices would need to operate with very little or no direct user focus, to avoid user disruption or inconvenience.
Length of operating cycle is simply the length of time that the appliance takes to complete its operation. For example a kettle boils for around 3-5 minutes dependant on the quantity of water it holds. The length of any appliance operating cycle does not directly affect its suitability for the proposed system since peak consumption is not dependant on cycle length, however short operating cycles potentially reduce the delay length opportunity as users would reasonably expect these to complete their cycle faster.
17
Likelihood and scale of profile variation is the chance of an appliances typical load profile variation due to external conditions. These conditions could include temperature, illumination or user input. For example a washing machine set to cycle at 30°C will have a marginally shorter heating period if the mains water input is 6°C rather than 4°C.
UK ownership percentage of each appliance is also an important factor to consider since regardless of how appropriate an appliance may be to operate with a peak load reduction system if the appliance is not widely owned then it inclusion in the system may prove negligible.
These five factors form the basis for assessing if it is suitable to include an appliance in the proposed synchronisation based peak load reduction system.
Results
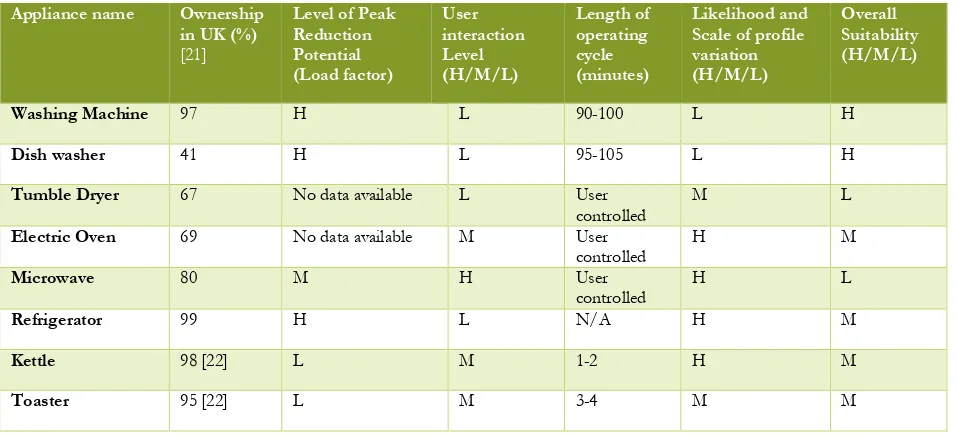
Table 3 summarises the results of the appliance suitability study. Some results have been obtained directly from the load profile data used for this study and some from two other sources, a survey undertaken by BRE on behalf of the Department of Energy and Climate Change in 2011[21] and from ‘Statistical Review of UK Residential
Sector Electrical Loads’ by Tsagarakis, Collin and Kiprakis [22].
Table 3: Summary of key domestic appliance characteristics
From Table 3 it can be seen that the most suitable appliances are the washing machine and dishwasher, with the refrigerator, kettle and toaster also offering potential. There are other appliances that may be suitable however since they are not as common in the UK domestic sector they have not been considered in this study.
18
Methodology
In order to investigate if the proposed system could effectively reduce peak electrical loading a model was produced that could simulate the effect of the system in a number of different scenarios, with the two selected appliances. The results could then be compared the results to the same scenarios without the use of the system. The modelling of such a system was undertaken using the MathWorks MATLAB[19] software package which enabled flexibility of programming for such a bespoke model.
This study has been broken down into two parts in order to simplify the modelling process. The first stage will focus on establishing the core synchronisation script that will calculate the optimum delay time of the appliance. This will then be analysed and tested using the load profiles of a single appliance and a single dwelling.
The second stage of modelling will aim to simulate and test the system applied to multiple appliances within a network of varying size. In this stage several different tests will be undertaken to assess the successfulness of the system.
Measuring the effectiveness of the system
Two performance indicators will be used to measure the effectiveness of the system, the percentage peak load reduction and the percentage load factor increase across a 24 hour day. The percentages showing the ratio between results with and without the synchronisation script.
It was decided that both indicators should be used as they each represent the successfulness of the system concerning each of the two major benefits. The percentage peak load reduction indicates the suitability with relation to increasing spare capacity in a network, and the percentage load factor increase indicates the benefit to load balancing.
Stage 1 – Single house and single appliance
Model Coding
The first step in building a working model was to import the load profile data for a single dwelling and for the appliance to be analysed. Hourly probability data of the selected appliance was then also imported from the University of Strathclyde study.
Next, a weighted random start time with the data’s 24 hour period was generated. This represented the time at which the appliance was turned on and was based on the probability data. By using a weighted start time the appliance load signature would be more likely to be inserted over periods of the day that the appliance would be used in reality, and therefore interact with the patterns of electricity consumption used at that time of the day. The start time was allocated by adding the equivalent number of elements, in 6 second intervals, to the start of the appliance load profile. Addition zero elements were added to the end of the array to ensure arrays were of consist length to ensure correct MATLAB syntax, as shown in Figure 5.
The model was then programmed to calculate the peak load and load factor of the combined load profile to represent the business-as-usual scenario, and therefore providing the comparison results.
It was decided that the best way to determine the optimum offset time was to simply analyse each possible offset time and select the best performing permutation. The load profile data was at 6-second resolution meaning each offset time at a 6-second interval within the maximum delay length was analysed. Figure 6 shows the insertion of new zero elements to model the delay of the appliance.
ApplianceIndividual = [zeros(1,starttimeMatrix(i)), Appliance
zeros(1,addedtimeMatrix(i))];
19
The load profile data was stored as two independent matrix, as shown in Figure 6 as ApplianceMatrix, which contained each occurrence of the appliance use in each row and the electrical consumption at each interval in each column. Therefore to offset the time to each interval a zero element was inserted at the start of the array, essentially shifting the data along by 6 seconds.
The script then calculated the performance indicators for that offset time, shown in Figure 7, before writing the result into an array for comparison once all other time intervals within the maximum delay time had been tested.
Once completed the model selected the optimum offset time by comparing the performance indicators written
into the ‘perf_vec_lf’ and ‘perf_vec_pk’ arrays, as shown in Figure 7. As two performance indicators were used
it was decided that the optimum offset time was the one with the highest load factor increase that also didn’t not
result in an overall increase in peak load. This concept is analysed further in the discussion section.
The results of a single simulation were highly variable and depended on the dwelling load profile at the selected start time. This was to be expect so in order to understand the aggregate performance of the system each simulation scenario was run 300 times, with the performance indicator results for the optimum delay time of each simulation stored in a CSV file. This data could then be statistically analysed to understand the variation of results and therefore provide a degree of certainly of the level of peak load reduction that could be achieved with each appliance.
Stage Two – Single Appliance Type in Multiple Houses
Model Coding
After stage one of the modelling it was decided that the assumption that the household dwelling load profile would be known for a full 24 hours was too implausible. Although the habitual behaviours of many households would allow a self-learning program to predict the total house load profile with reasonable accuracy, the precision required for the synchronisation script to operate productively would be unlikely to be reliably achieved.
Despite this, the stage one modelling created a successful profile synchronisation script which was therefore carried over the stage two modelling.
The decision was made to rework the model to only synchronise each appliance load signature against the demand generated by other appliances in the system. The system would detect and track the progress of appliances within the network, thus being able to accurately predict the load created by each appliance for the duration of appliance cycle beyond the present moment.
This means that, for example, when a dishwasher is started at 3pm the system know that in 1 hour 40 mins, at 4.40pm, there will be a large electrical load, lasting 20 minutes, due to the dishwasher drying its contents. Therefore when another dishwasher within the system is started at 3.10pm the system can see that there will be an overlap of 10 minutes where both dishwashers will be in the drying segment of their cycles. The system can
for j = 0:delaymax
trans = ApplianceMatrix (i,:); sync = [zeros(1,j),trans];
Figure 6: Extract of model showing load profile array adjustment
averageload_sync = sum(SyncMatrix,2)/numel(SyncMatrix); peakload_sync = max(SyncMatrix);
loadfactor_sync = averageload_sync/peakload_sync;
perf_vec_lf (j+1) = loadfactor_sync; perf_vec_pk (j+1) = peakload_sync;
20
then delay the second dishwashers operation by 10 minutes in order to prevent the overlapping of the electricity intensive drying periods. An example simulation from the model is shown in Figure 8 where the successful synchronisation of 25 dishwashers results in a 60.3% load factor increase and a 37.6% peak load reduction.
Figure 8: Showing an example of a successful synchronisation using 25 dishwashers
Multiple houses were added to the scripting to imitate the use of multiple devices within a 24-hour day. The complexity of programming a multi-appliance simulation was increased however this would more accurately represent the results that could be achieve in real situations by accounting for all appliances to be included in the proposed system.
Another difference from the stage one modelling was that data was handled using matrices instead of arrays. This meant that data such as the weighted random start times could be stored as a single variable where each row of data corresponding to an instance of an appliance operation. This allowed the system to use far fewer variables and therefore run at a faster speed.
Testing Summary
The second stage of modelling involved a number of tests to determine the effectiveness of the system. The tests are designed to examine a number of factors that the system would be exposed to under real life conditions. These factors include varying number of houses, and therefore appliances, within the system network, variations on the maximum delay time and varying the appliance load profile data used. Additionally it was considered important to analyse the effect of the system where the load profile produced after the optimisation occurred varied compared to the profile used in the synchronisation script. Each of these tests were performed with Washing Machines and Dishwashers individually as well as a combined scenario.
21
Test One
–
Number of Houses within the system
This test was designed to gain an understand as to how many houses, and therefore appliances, were required to be part of the system in order to produce effect peak load reduction. The simulations were run using the following number of houses, 5, 10, 25 and 100. This was based on the findings of the literature review, that coincidence factors had more potential to be reduced for networks with fewer than 100 houses. It was assumed that each house contained one appliance that would operate once over a 24 hour period, with a weighted start time, and with each operation producing the same load profiles. For this test, the maximum delay period was set at 10% of the cycle length.
Test Two
–
Appliance load profile variation
This test is designed to ensure that results obtained through test one are not simply due to the shape of the particular appliance load profile used and therefore to show that small variations in load profiles do not significantly affect the systems results. There are many manufacturers of appliances and therefore it was important to determine if the results are a property of all washing machines or just of the washing machine load profile used in test one. Load profiles used in this test were from the house two data set.
Test Three
–
Delay period variation
In this test the maximum delay period was varied to analyse the effect that it has on the performance indicator results. The maximum delay period was tested at 5%, 10% and 15%. These were undertaken assuming 25 houses and used the profile data from the house one data set.
Test Four
–
Load profile inaccuracy test
In reality the system would use a stored load signature of each appliance in order to carry out the synchronisation. The actual load profile produced by the appliance during operation would likely have small variations caused by external conditions. Therefore, test four is designed to determine what effect the load profile inaccuracy may have on the system performance. To implement this test, after the model has determined the optimum delay time, a new appliance load profile is used in place of the profile used to calculate the delay time. The model then continues as before and calculates the performance indicators.
22
Results
Test One
–
Number of Houses within the system
Test One was undertaken on both the washing machine and the dishwasher appliances separately. The aim was to understand what scale the system worked most productively at when using each of the appliances. They were each tested when using 5, 10, 25 and 100 houses and the simulation run 300 times for each number of houses. The results of the tests have been summarised in Table 4 and Table 5 below. It is important to note that the values shown are based only on the load generated by the appliance in being tested and not a whole house load.
Table 4: Results of the Washing Machine under test 1 conditions
The results of the washing machine tests show that the appliance is not completely suitable for use in the system. The average peak load reductions are moderate, between 7.9% and 3.2%, and show a high percentage of simulations causing an increase in peak load. The performance of the washing machine appears to improve with fewer houses, and at 99% confidence that the peak load can be reduced by at least 6.3% on average in 5 house systems. With 100 houses the equivalent figure is only 1.5% which very low. With 100 houses, the simulations show 80 out of 300 results showing an increase in peak loading.
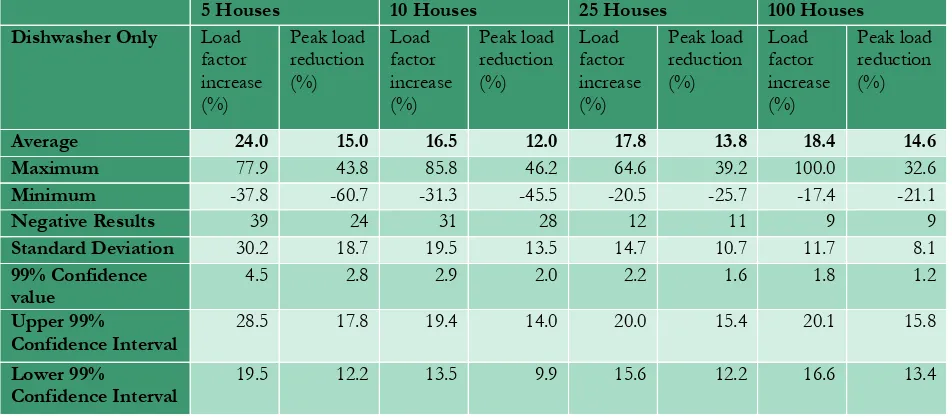
Table 5: Results of the Dishwasher under test 1 conditions
5 Houses 10 Houses 25 Houses 100 Houses produced a negative peak load reduction. The results are fairly consistence across the housing number variation
23
with 5 houses producing the largest average peak load reduction and the significantly largest load factor reduction. The number of negative results for both peak load and load factor decrease with increasing number of houses.
Test Two
–
Appliance load profile variation
Table 6: Summary of results for Test two, with both appliances from both of the load profile data sets.House 1 - appliance. The dishwasher profile from house two performed far worse than the profile from house one, with a drop in performance indicators and an increase in negative results. In contrast, the washing machine performance was better in house two.
Test Three
–
Delay period variation
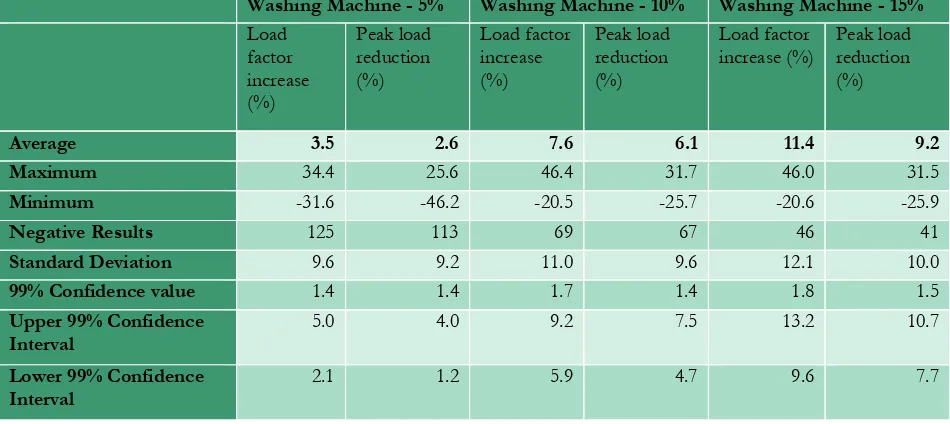
Test three was designed to show the effect of varying the maximum delay length of the synchronisation script. Three different maximum delay lengths were used on both the washing machine and dishwasher simulations. The delay length was a set as a percentage of the total cycle length of the appliance, with 5%, 10% and 15% being used in this test. Each was undertaken assuming 25 houses with the typical load signatures used in the model coming from house 1. The results can be seen in Table 7 and Table 8.
Table 7: Summary of results for Test 3 using a washing machine. Sorted by percentage maximum delay length
Washing Machine - 5% Washing Machine - 10% Washing Machine - 15%
24
The washing machine results show that as the percentage maximum delay length increases the average load factor increase and peak load reduction both also increase. The number of negative results also lessen as the delay length increases. This therefore shows that the synchronisation is more effective with a greater possible delay length.
Table 8: Summary of results for Test 3 using a dishwasher. Sorted by percentage maximum delay length
Dishwasher - 5% Dishwasher - 10% Dishwasher - 15%
The results from the dishwasher test show the same patterns as the washing machine results; that the effectiveness of the system increases with the maximum delay length of the appliance.
Test Four
–
Load profile inaccuracy test
The purpose of test 4 was to determine the effect of deviation of the actual load signature, produced by an appliance while operating, from the typical load profile that is used to synchronise with. During this test the variation in profiles was exhibited by using the load profiles from House 1 to synchronise with and then inserting the load profiles from House 2 to calculate the performance indicators. The simulations were undertaken assuming 25 houses with 10% maximum delay length. The results are shown in Table 9 below.
Table 9: Showing the results from Test 4. Only the deviated result sets are shown here. Comparison results are in Table 4 and Table 5.
Dishwasher – 25 Houses Washing Machine - 25 Houses
The results in Table 9 should be compared to the results where deviation was not accounted for in Table 4 and Table 5.
25
Discussion
This section of the dissertation will aim to analyse the results of the modelling to understand why the results were produced as they were and how they may be improved in future research. This section will also identify the assumptions and limitations of the modelling, and the issues that would surround the implementation of the system in reality.
Analysis of Results
Occasional Peak Load Increase
–
Negative Results
From the results it can be seen that the script sometimes causes the peak load to increase beyond the peak of the system if the synchronisation system had not been active, therefore creating negative results. This is due to limitation of the system only being able to synchronise based on information it has on the progress of the other appliances currently in use. The system cannot know what appliances will be turned on beyond the present moment and therefore it is possible for the system to delay an appliance that then inadvertently causes an overlap with another future appliance operation, thus creating a greater peak.
By creating a greater peak the system is not only failing to achieve its objective, but is in fact actively worsening it. The creation of greater peak loading, or lowering the load factor, is hugely damaging to the success of the scheme and should therefore be minimised whenever possible. In the following results it is important to note that the scale of the negative result should also be considered. These are shown for test one in Figure 10.
Results shown without whole house load
Although negative results should be avoided, the results produced by these tests are only properties of the electrical loading generated by the appliances being synchronised and not of the overall loading produced by a single dwelling. This therefore means that the results shown are exaggerated compared to the results that would be achieved for total domestic electricity consumption.
Test 1
–
Number of Houses within the system
The results from test one showed that the dishwasher produced better results than the washing machine. It also showed that by varying the number of houses, and therefore appliances, used within the network, the effectiveness of the system changes significantly. The trends generated by each appliance though were not the same, with the performance of the washing machine dropping with an increase in appliances within the system, while the dishwasher performance remained constant across all housing number variation. This suggests that there are some characteristics of the individual load signatures that cause the performance variation. The load profiles of both the dishwasher and washing machine are show in Figure 9.
26
Figure 9: Graph showing the electrical load profiles used in Test 1
Figure 10 below shows the test results of each simulation under each of the four housing number conditions for the dishwasher and washing machine tests. The simulations were ranked in order to demonstrate the number of simulations achieving different ranges of results.
Figure 10: Graph showing the peak load decrease of each test run after ranking from lowest to highest
-80
Test Number After Sorting by Peak Load Decrease
27
Figure 10 highlights how the variety of results appears in increase as the number of houses increases. With both appliances, the 100 house tests show a predominantly smoother trend whereas the 5 house tests show a number of significant steps. For example the dishwasher 5 house test shows a large step at the 193 test number where virtually no tests produced a peak load reduction between 8-24%. This is likely due to the shape of the profile and the fact that with just 5 houses few overlaps of intense energy use periods are likely to occur. This means that when no overlap occurs up to an 8% reduction is achieved and over 24% is likely to signify one or more overlaps. Where 100 houses, and therefore appliances, are used there are many more overlaps occurring in every simulation and therefore reductions are more evenly varied. The effect can also be seen in the washing machine results however as the results are less effective overall, the pattern is less pronounced.
It is also very important to highlight the importance of reliability of results. As can be seen from Table 5 as the number of houses used increased, the number of negative results drops off significantly. This is crucial to providing the benefits as both the increase in capacity in electrical networks, provided by reducing the peak loading, and the improved load balancing, provided by the increase in load factor, are determined by maximum parameters not average. Therefore the results show that using 100 dishwasher would be more suitable than 5, 10 or 25. This is not the case for the washing machine results as there is little pattern in the negative results. Overall, it can be deduced from the results of test 1 that the dishwasher produced more effective peak load reduction and load factor increase than the washing machine, across all house number variations. Based on the results gained it is possible to provide an approximately response as to what number of houses produces the best results although this varied with the appliances used. It can be considered that by using a greater number of houses the performance of the system using dishwashers is more reliable than with fewer houses. The results have shown that the system is can produce very good results when used in certain conditions. In this test, by using the dishwashers from 100 houses a 14.6% average peak load reduction was achieved with only 9 out of 300 tests resulting in negative performance. This proves there is scope for further research into the concept.
Test 2
–
Appliance load profile variation
The results from test 2 showed that typical load profiles of appliances of the same type but different model/program can have dramatic effects on the effectiveness of the system. For the house 2 washing machine the second test showed a significant improvement of the performance indicators, whereas for the dishwasher the test showed a drop in the indicators. Since the only factor changing between the two tests was the source of the typical load profile used it proves that the characteristics of the load signature were the cause of the variation. Figure 11 shows the two load profiles used for each appliance, one from house 1 and one from house 2. With regards to the washing machine signatures, the major difference is the absence of the large peak (around 4000W) in the house 2 profile that occurs at 1400 seconds in the house 1 data. This peak in the house 1 data clearly represents the peak load value of the appliance signature and therefore the synchronisation script will focus on minimising the overlap of this with the ongoing appliances. It is likely that this is to the detriment of the synchronisation of the main consumption block that ends just beyond 1000 seconds. Since the data from house 2 does not have any particular spike in consumption (its peak is around same level as the main consumption block, approximately 2200W), the synchronisation focuses more on the entire main block and therefore the performance indicator results improve.
28
Figure 11: Graph comparing the load profiles of the same appliance type but different models
Test 3
–
Delay period variation
The results from test 3 were as expected, by increasing the maximum delay time of the system the results improved. This is primarily because by increasing the percentage delay time the system simply had more possible delay intervals to analyse and optimise from, increasing the likelihood of finding a suitable offset time.
The results of the dishwasher test show good improvement at 15% maximum delay time. Considering the dishwasher cycle length was 103 minutes, this represents an additional 15 minutes taking the cycle length to 118 minutes. At this maximum delay period the average load factor increase was 29.8% with just 4 out of 300 simulations providing negative results.
By comparing these results with the results from test 1 it can be deduced that the maximum delay length of the scheme has a larger effect on the reliability of the system than the number of houses. This is because the number of negative results produced by each appliance increased as the maximum delay length decreased, whereas the only the dishwasher results in test 1 showed a similar pattern and this was less well defined.
These results help to provide further evidence of the large benefit the system can provide under the right parameters. The test suggests that the system should employ the longest maximum delay time possible, which under these conditions would mean a 15% delay length. Longer delay would likely improve the results further however it would be necessary to investigate how users would react to significantly longer delay periods as this would cause greater disruption to the user.
Test 4
–
Load profile inaccuracy test
29
the performance increased other than that it is due to the deviations between signatures. Further investigation into load profile deviation would be required to provide a conclusive answer.
Figure 12: A graph comparing the load signature used in the optimisation calculation with the load signature actually produced by appliance
The results of the dishwasher test did show a significant decrease in the performance indicators with the average load factor increase and average peak load decrease moving from 17.8% and 13.8% to 3.2% and 2.2% respectively. This is a large drop in effectiveness, almost to the extent that the system is no long having a benefit. This is backed up by the fact that over half the simulations for the dishwasher (156 out of 300) produced negative results.
30
Model Limitations and Assumptions
In order to produce a working model and to obtain meaningful and significant results in the time available, a number of assumptions were made to help simplify the modelling process. These are discussed in the following section.
No Variation
Despite being analysed in test 4, the absence of truly random variance in appliance load profiles is a large limitation of the model. In reality, many external factors have an influence on the length and consumption of an appliance’s operating cycle, however due to their complexity these were not included in the modelling. The impact of appliance load profile variation can not be quantified by this study however it is expected to be one of the largest limitations and this hypothesis is backed up by the results of test 4 which show large differences in results where the actual load profile varied from the one used in calculating the optimum offset time.
Variations in load profiles have an increasing effect along the length of an appliance cycle, with variations at the start of cycles affecting the effectiveness of synchronisation across the entire remaining cycle length. For example an extended water heating period in a washing machine by 10 seconds, due to low water temperature, would likely cause the remainder of the cycle to progress 10 seconds behind its typical cycle routine.
The effects of load profile variation could be reduced through a self-adapting synchronisation script which learns from each operation of the appliance, adjusting the stored interpretation of a typical load profile as each new cycle is run. Alternatively, a more advanced system could actively predict the small variations based on local conditions, detected by utilising the instruments available to the appliance, for example the thermostat in a washing machine.
Program Selection
Many modern washing machines and dishwashers have multiple programs which the user can chose from allowing to select the wash settings that best suit their requirements. Similar to the lack of load profile variation the model also only employs one load profile for device and therefore this source of variation is ignored by the model. This could also have a severe detrimental effect on the system results although this could be avoided by incorporating the programming of the system into the appliance circuitry itself. This is discussed further in the Practical Limitations, Delay Control section.
Discussion of synchronisation method
During the modelling of the system two performance indicators were used, the load factor increase and the peak load reduction. These were both used primarily to prevent the system from optimising one to the detriment of the other. This was achieved in the system coding by selecting the delay period for that individual appliance that produced the greatest load factor increase and that did not cause the peak load to increase (this should not be confused with the negative results which can occur due to future appliance operation). This coding decision therefore prioritises the load factor increase over the peak load decrease, although not greatly as the peak load is a component of the load factor anyway, to help improve the overall load balancing of the system.
The system could alternatively have been coded to prioritise the peak load reduction which may have produced different results.
Verification of data
31
Practical Limitations
There are a number of significant practical implementation limitations that would need to be overcome in order to successfully implement the system in a domestic context. A number of these issues are discussed below.
Communication between appliances
One of the most significant issues is the communication network required between appliances in the network. Communication would be essential between devices to allow the synchronisation script to understand the progress of all appliances operating at any particular time. Due to the large amount of research into Smart Metering many of the issues involved with developing a cost effective communication network of the type required for the proposed peak load reduction system have already been analysed and addressed. The UK government has made a commitment to ensuring smart metering is fully implemented in residential properties by 2020[23]. These networks will have the functionality and framework to support various features including
‘smart appliances’ and it therefore suggested that the system proposed by this study could use this network[24]. This may also allow users to interact with the system via the ‘in-home display unit’ used for smart metering, potentially helping to highlight the benefits of the system to the customer.
Delay control
The delay control maybe be very difficult to install retrospectively since many modern appliances rely on a simply user interface that remains on standby between operations. When a user issues a command to the appliance through the user interface the operation is entirely contained within the circuitry of the appliance. It would be technically challenging to design an external device that could detect a human interaction with the appliance and reliably delay the initiation of the command. This was also identified as an issue by Newborough and Augood in their investigation of DSM systems and as previously mentioned one solution would be to incorporate the control module into future appliance designs[3].
However, this solution removes a very large proportion of opportunities to install the system as appliances are rarely replaced on a regular basis. According to a BRE report approximately 46% of washing machines and 55% of dishwashers are older than 4 years old, suggesting that, if implemented, it would take several years before a significant proportion of housing stock had system suitable appliances with the control module installed[21].
Financial motivation
As with all non-traditional business models, the structure of the current electrical economic model would need to be altered to allow for the implementation of such a system from a financial perspective. In the UK electricity consumers are primarily charged based on the quantity of energy they use, whereas the proposed peak load reduction system would have no impact on the quantity of electricity used. In order to design a successful financial model the beneficiaries and their relationship which the end users need to be understood.
The main beneficiary would be the Distribution Network Operator (DNO) who own and maintain the electrical networks. Electrical networks are designed to accommodate particular peak design load and therefore once the design load has been reached no further new electrical connections can be made to that part of a network until reinforcing works have been completed. The process of reinforcing electrical networks is very costly and often causes significant disruption to local traffic and communities, and therefore DNO are keen to avoid this work [16]. DNOs such as Western Power Distribution (WPD) have been actively exploring the use of peak load reduction schemes. For example a partnership project between WPD and Centre for Sustainable Energy (CSE),
funded by Ofgem’s Low Carbon Networks Funding program, has been attempting to reduce peak demand
through community engagement and education.
32
Firstly, a contractual agreement between the DNO and the end user could be drawn up whereby the end user receives payment in return for them employing the peak load reduction system in their home. This method has been used recently for a pilot program in Scotland by Community Energy Scotland[25]. The main benefit of this technique is also the main limitation, the bypassing of the energy supplier. As it stands energy users have little or no contract with their local DNO with many consumers not understanding the DNO role or even, in some cases, that they exist altogether[13]. By deciding to develop a relationship, rather than using the relationship the energy supplier already has with the consumer, the additional costs associated with contracting in the energy supplier can be avoided. However, this means that initiating communication could prove difficult and slow as trust is built between the DNO and consumer.
33
Conclusions
This studied aimed to test the concept of a delay based appliance load profile synchronisation system in domestic properties. The system was designed to reduce peak electrical loading, helping to increase capacity on low voltage electric networks, and increase the load factor of electricity consumption to produce ‘smoother’ load profiles, thus helping to reduce the variability when balancing electrical demand and generation.
The study has shown that appliance load profile synchronisation can produce beneficial load balancing effects and reduce peak electrical loading within a domestic context, although the conditions needed to be careful considered to ensure these positive effects. By introducing a simple delay mechanism to appliances, the model results showed that peak load reductions of up to 20% could be achieved when delaying and synchronising the operation of appliances up to 15% of their cycle length, in groups of houses up to 100 units.
The investigation found that the reliability of results was essential to achieving the two primary benefits. The testing found that by using more houses within the system, as well as increasing the maximum delay time, the reliability increased and therefore these conditions produced the optimum results.
The appliance suitability investigation determined that appliances with fixed operational cycles, which have blocks of energy intensive periods and that are of relatively long length are the most appropriate for use in this system. Devices with high user interaction, such audio-visual and cooking appliances, are not suitable for use in the system, not only because of the disruption they would cause to users but also due to the unpredictability in usage length and unreliable load profiles. Appliances such as washing machine and dishwashers, as tested in this study, were found to be the most suitable.
34
Further research opportunities
As the investigation was an initial proof of concept there are several aspects of the research that were simplified or assumed. These would require further research to understand the issues in more detail and provide appropriate and specific solutions.
One of the most significant simplifications was that appliance load profiles do not deviate from the typical load signature expected and used in the optimisation. This is not true and therefore a detailed investigation into overall effects of this reality would provide clarification.
Another assumption was that a 5-15% maximum delay length would not disrupt users and would therefore be appropriate for the system. This concept should be investigated further to determine if it is true and if longer delay lengths would be possible as the results of this study suggest that longer delay lengths would further improve the performance of the scheme.
The modelling undertaken in this research only considered one type of appliance from each dwelling being included in the system network. It would be sensible to assume that several appliances could potentially be used from each property, potentially improving the effectiveness. It would be worthwhile investigating this limitation further.
![Table 1: A summary of short term load balancing schemes operated by the National Grid[9]](https://thumb-ap.123doks.com/thumbv2/123dok/2031373.1601365/8.595.58.507.412.603/table-summary-short-balancing-schemes-operated-national-grid.webp)
![Figure 1: Timeline of the load balancing actions used in the UK. Shown against typical time required for planning and impletmentation[9]](https://thumb-ap.123doks.com/thumbv2/123dok/2031373.1601365/9.595.59.515.107.252/figure-timeline-balancing-actions-typical-required-planning-impletmentation.webp)
![Figure 2: Demand side management electrical load balancing categories shown in the form of load profile graphs with electrical consumption shown against time[11]](https://thumb-ap.123doks.com/thumbv2/123dok/2031373.1601365/10.595.128.463.71.245/figure-demand-management-electrical-balancing-categories-electrical-consumption.webp)
![Figure 3: Showing the relationship between coincidence factor and number of properties connected to the downstream network.[5]](https://thumb-ap.123doks.com/thumbv2/123dok/2031373.1601365/13.595.161.447.73.238/figure-showing-relationship-coincidence-properties-connected-downstream-network.webp)
![Table 2: Summary of open source meta data [17]](https://thumb-ap.123doks.com/thumbv2/123dok/2031373.1601365/14.595.59.513.465.623/table-summary-open-source-meta-data.webp)