The Decline of Soil Infiltration Capacity Due To High Elevation
Groundwater
Isri Ronald Mangangka1
Abstract: Infiltration capacity of soil mainly depends on two factors; the particle size and the
moisture content of the soil. Groundwater increases the soil moisture, not only below the water table but also within the capillary zone, above the water table. Field experiment in a high groundwater area was conducted to understand the relationship among the groundwater, soil moisture and infiltration capacity. Using a single ring infiltrometer, the effect of groundwater in the infiltration rate was observed. This field experiment result shows that the groundwater influences significantly the infiltration capacity of the soil, and the infiltration rate follows a specific trendline.
Keywords: infiltration capacity, groundwater, ring infiltrometer.
Introduction
Infiltration is the entry of water into the ground. The rate and quantity of water which infiltrates into the ground is a function of soil type, soil moisture, soil permeability, ground cover, drainage conditions, depth to water table, and intensity and volume of precipitation. The soil type helps to identify the size and number of capillaries through which water may flow into the ground, while moisture content helps to identify capillary potential and relative conductivity. For soil with low moisture content, capillary potential is high and conductivity is low. Soil moisture will increase soil conductivity, but decrease capillary potential, therefore, reduces the infiltration capacity of the soil.
Groundwater affects the moisture content of the soil, not only below the water table but also above the water table where the capillary force can raise the water. It means that in higher water table condition, the potential infiltration volume may be limited. Furthermore, Griskhan (in Kovacs [1]) claimed that the infiltration rate is not only disturbed when the wetting front reaches the water table but also since the wetting front reaches the capillary zone. The effect of groundwater on the infiltration capacity of a sandy soil and the trend line of the infiltration rate in high water table condition were further studied in this research.
1 Department of Civil Engineering, Faculty of Engineering, Sam Ratulangi University–Manado, Indonesia
E-mail: [email protected]
Note: Discussion is expected before June, 1st 2008, and will be published in the “Civil Engineering Dimension” volume 10, number 2, September 2008.
Received 29 April 2007; revised 10 December 2007; accepted 17 December 2007.
A sandy soil, which contains almost uniform medium sand, was selected to investigate the effect of ground-water and its capillary zone to the infiltration capacity of the soil. A single ring infiltration test was conducted to understand this phenomenon.
Infiltration Models
Many methods have been developed to model the infiltration processes using both physical and empi-rical approaches. Among all the models, Kostiakov and Philip’s methods are the two models that are more frequently used because of the simplicity and the ease to calculate their parameters [2]. However, in recent researches, Philip’s method was the most popular [3, 4, 5, 6].
Kostiakov in 1932, instead of a constant infiltration rate, suggested a formula which assumes that at time
t = 0, the infiltration rate is infinite and at time t = ~, the rate approaches zero [7].
F(t) = a tb (1)
where:
F(t) = cumulative infiltration afterelapsed time t [L]
a, b = Kostiakov’s time and exponent coefficient term
t = elapsed time after ponding [T]
Kostiakov’s equation (1) has been modified to apply a certain minimum infiltration rate [7].
F(t) = c t + a tb (2)
where c is the infiltration rate at t = ~, and the infiltration rate f(t) at the time t can be formulated;
f(t) = c + ab tb-1 (3)
hand side represents the effect of soil suction head and the second term represents the gravity head.
I(t) = S t½ + A t (4)
where:
I(t) = cumulative infiltration afterelapsed time t [L]
t = elapsed time [T]
S = sorptivity, a parameter of the soil suction potential [LT-1/2].
A = soil water transmissivity, a constant that is related to the hydraulic conductivity of the soil [LT-1].
Philip’s formula above is for one-dimensional infil-tration. To include the horizontal flow due to capillary force for three-dimensional infiltration from a disk infiltrometer, this formula has been modified as [3]:
I3D = S t½ + (A+B) t (5)
where:
I3D = three-dimensional cumulative infiltration [L]
B = a constant, related with horizontal movement
dimensionless constant approximately equal to 0.75. By substituting equation 6, equation 5 can be rewritten as:
Equation 7 contains three terms on the right-hand side; the first term corresponds to the vertical capillary flow and dominates the infiltration during its early stage. The second term represents the vertical flow due to gravity force and the third corresponds to the component of lateral capillary flow. All of these parameters could be obtained by conducting an experimental work either using disk infiltrometer or ring infiltrometer.
Another infiltration formula was proposed by Green and Ampt in 1911 [10]. This alternative theory is based on more physical theory which assumes that there is a wetting front dividing soil with moisture content θ0below the wetting front and saturated soil
with moisture content θn above the wetting front. The
wetting front has penetrated to a depth L, so the infiltration depth can be formulated as:
F(t) = L (θn - θ0) (8)
where:
L = Depth of wetting front (wetted zone) [L]
θ0 = Initial water content
θn = final water content
Research Method and Experiment Proce-dures
The main experiment in this research is field infil-tration test. Using 20 cm diameter ring infiltrometer, the infiltration capacity of the selected soil was observed. A sandy soil, which contains almost uniform medium sand, was selected to be the object of the study. Other experiments both field and labora-tory experiments were also conducted to provide data required in model analysis, and to understand the relationship among soil infiltration, soil behaviour and groundwater level. These experiments are sieving analysis, field density test, particle density, water content and groundwater level measurement. Several methods to obtain soil infiltration rate are available, such as disk permeameter/disk infiltro-meter, single ring and double ring infiltrometer. To simplify and to include three dimensional infiltration flows, the single ring infiltration test has been chosen for this study.
This single ring infiltration test used falling head method by putting one litre of water inside the ring each time, and then the time taken of the water to infiltrate each time was recorded. The maximum head of water pond in the ring was maintained just less than 3.2 cm which is negligible. Before putting the ring, the top soil which usually contains organic matter, was removed until the actual soil to be tested is reached. Based on recorded elapsed time of the one litre amount of water which infiltrated, the infiltra-tion line could be generated. The groundwater level below the soil was recorded just before the test.
Just before the infiltration test was conducted, soil sample was also collected using a set of cure cutter. This undisturbed soil sample then was analysed in the laboratory to obtain the parameters of the soil. All of the experimental procedures in this study were referred to the Australian Standard of Soil Testing [11, 12, 13].
Result and Discussion
From the sieve analysis, it was known that the soil contains 95.86% sand (20.57% of coarse sand, 56.94% of medium sand, and 18.35% of fine sand), and 4.14% silt and clay with the coefficient of uniformity (Cu) of 3.5. The uniformity coefficient is the ratio of D60 and
The particle distribution of the soil which was obtained from sieving analysis, is shown in Figure 1.
0
Fig. 1. Soil particle size distributions
In the piezometers, the watertable was recorded at about 100cm below the infiltrometer. The result from the laboratory test showed that the initial water content (θ0) was 0.0974, while the porosity (η) was
0.4673. It is impossible that the soil becomes absolutely saturated during infiltration process, since the air bubble can not completely go away from the soil. The maximum degree of saturation is about 85% to 95% [14]. Therefore, the assumed value of final water content (θn) in this research was 90% x 0.4673
= 0.4197.
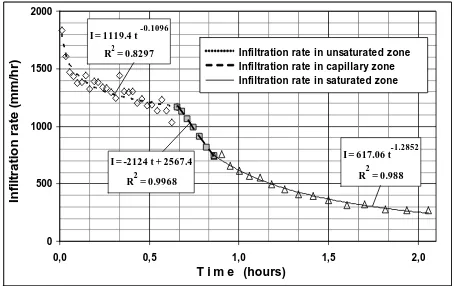
The ring infiltration test was conducted for two hours and three minutes, and the model result of saturated and unsaturated condition of this test is given in Figure 2.
Fig. 2. Three stages infiltration rate
As we can see, figure 2 suggests that the distribution of infiltration rate value can be divided into 3 trend lines (3 stages). The first stage represents the start of infiltration process when the wetting front was in the unsaturated zone. The results followed the theoreti-cal line (Kostiakov’s fitted line) up to 0.66 hour before the rate suddenly dropped by means the wetting front reached the capillary zone.
Using Philip formula (7), the three-dimensional infiltration depth were analysed, and then the amount of water which moved horizontally (6) was separated. Hence, it remained the vertical flow of infiltration depth due to capillary force and gravity force (one-dimensional infiltration depth) as stated by Equation 4. The depth of wetting front can be calculated using Equation 8. At hour 0.66, the depth of wetting front calculated with Equation 8 was 77 cm, or 23 cm above the watertable. Using value stated by Wasburn [15] that the rise of capillary head of a medium sand is about 20 cm to 25 cm above the phreatic line confirms that at hour 0.66 the wetting front reached the capillary zone is very reasonable.
In the second stage when wetting front entered the capillary zone, the infiltration rate dropped, affected by the increasing water content. The drop of the infiltration rate in this stage, according to the graph, is represented by a straight line. A new trend line begun at hour 0.86 when the infiltration process was further reduced and followed a new Kostiakov’s theoretical line. The change of this trend line suggests that there was a physical change in the infiltration process. The most reasonable reason is that the wetting front had reached the watertable, and the infiltration process entered the third stage.
Furthermore, using the best fit to Kostiakov’s formula, the infiltration rate without the influence of groundwater can be predicted up to the end of the test (Figure 3). The predicted infiltration rate without the influence of water table at the end of the test was more than 1000 mm/hour, while the field recorded data at the end of the test was just about 250 mm/hour or just about one fourth. According to the trend lines, the gap will be more for the longer elapsed time.
I = 1119,4x-0,1096
R2 = 0,8297
r) Infiltration rate in unsaturated zone and
its prediction up to the end of the test
Actual infiltration rate under influence of groundwater
Fig. 3. Predicted infiltration rate without groundwater and
actual data from the test
and 7. Fitted values calculated for Philip’s Equation (Equation 7) are:
S = 197.505 mm/h1/2
With standard error = 0.42% and coefficient of deter-mination = 0.9982
While the fitted values calculated for Kostiakov’s Equation (Equation 1) are:
a = 1271.81493
b = 0.91822
With standard error = 0.32% for a and 0.41% for b, and coefficient of determination = 0.9998.
Trend Line of
0,00 0,50 1,00 1,50 2,00 2,50 3,00 3,50 4,00 4,50 5,00
Time (hours)
Infiltration in unsaturated zone
Infiltration in capillary zoneI
Infiltration in saturated zone
Philip's 3D Formula (Equation 7)
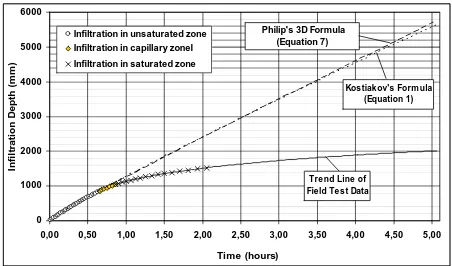
Fig. 4. Actual infiltration depth v.s. Philip’s and Kostiakov’s
unsaturated infiltration models, predicted up to 5 hours
Figure 4 shows the comparison between field results and the two models results. The Philip’s and Kos-tiakov’s models are used to forecast the infiltration depth up to five hours. The field data was obtained for all conditions; infiltration in unsaturated zone (stage 1), infiltration in capillary zone (stage 2) and infiltration in saturated zone (stage 3).
Figure 4 also confirms that the trend lines of Kostiakov’s and Philip’s model results are very close. The predicted value of infiltration depth after five hours from Philip’s and Kostiakov’s models is about 5,600 mm, while the trend line of field experiment data is just about 2,000 mm, or about one third of Philip and Kostiakov models.
The reason for higher values for Philip and Kostiakov’s models is that they only take account of unsaturated zone while the field data includes the capillary and the saturated zone as well.
CONCLUSION
Infiltration rate in the sandy soil with high ground-water condition can be divided into three stages. The first stage represents the infiltration in unsaturated zone; the second stage is when the wetting front
within the capillary zone and the third stage begins since the wetting front reaches the water table.
The result graph suggests the drop of the infiltration rate at the second stage follows a linear trend line, while at the first stage and third stage follow power trend lines (Kostiakov model lines). Furthermore, the experimental result also shows that the groundwater reduces significantly the infiltration capacity of the soil.
However, the results shown above are specific for sandy soil with the depth of groundwater 100 cm. The results need to be confirmed with different type of soil and different groundwater elevation.
References
1. Kovacs, G., Seepage hydraulics (Kovacs, K., Trans.), Elsevier Scientific Publishing Company, Amsterdam, 1981.
2. Mbagwu, J. S. C., Testing the goodness of fit of infiltration models for highly permeable soils under different tropical soil management sys-tems, Soil and Tillage Research, 34(3), 1995, pp, 199-205.
3. Vandervaere, J.P., Peugeot, C., Vauclin, M., Jaramillo, R. A., and Lebel, T., Estimating hydraulic conductivity of crusted soils using disc infiltrometers and minitensiometers, Journal of
Hydrology, 188-189 (1-4), 1997, pp, 203-223.
4. Minasny, B., and McBratney, A. B., Estimation of sorptivity from disc-permeameter measure-ments, Geoderma, 95(3-4), 2000, 305-324.
5. Zang, R., Determination of soil sorptivity and hydraulic conductivity from the disc infiltro-meter, Soil Sci. Soc. Am. J., 61, 1997, pp, 1024-1030.
6. Angulo-Jaramillo, R., Vandervaere, J.P., Roulier, S., Thony, J.L., Gaudet, J.P., and Vauclin, M, Field measurement of soil surface hydraulic properties by disc and ring infiltrometers; A review and recent developments, Soil and Tillage
Research, 55(1-2), 2000, pp, 1-29.
7. Marino, M.A., and Luthin, J.N., Seepage and
groundwater, Elsevier Scientific Publishing
Company, Amsterdam, 1982.
8. Philip, J. R., The theory of infiltration. Sorptivity and algebraic infiltration, Soil Sci., 84, 1957, pp, 257-264.
9. Haverkamp, R., Ross, P. J., Smettem, K. R. J., & Parlange, J. Y., Three dimensional analysis of infiltration from the disc infiltrometer. Part 2. Physically based infiltration equation, Water
10. Chow, V.T., Maidment, D.R., and Mays, L.W.,
Applied hydrology. New York: McGraw-Hill, Inc,
New York, 1988.
11. AS 1289.2.1.1., Determination of the moisture content of a soil – Oven drying method (standard method), Standards Australia, New South Wales, 2000.
12. AS 1289.3.1., Determination of the particle size distribution of a soil – Standard method of analy-sing by sieving, Standards Australia, New South Wales, 2000.
13. AS 1289.3.2., Determination of the particle size distribution of a soil – analysing by sieving in combination with hydrometer analysis (subsi-diary method), Standards Australia, New South Wales, 2001.
14. Hough, B. K., Basic soils engineering, The Ronald Press Company, New York, 1957.