Surface modi
fi
cation of graphite encapsulated iron nanoparticles by
plasma processing
☆
Teguh E. Saraswati, Takafumi Matsuda, Akihisa Ogino, Masaaki Nagatsu
⁎
Graduate School of Science and Technology, Shizuoka University, 3-5-1, Johoku, Naka-ku, Hamamatsu 432-8561, Japan
a b s t r a c t
The graphite encapsulated iron nanoparticles were fabricated by using arc discharge method. The synthesized nanoparticles were pre-treated by an inductively-coupled RF Ar plasma and then post-treated by NH3plasma
under various gas pressures and treatment times. Analyses of XPS spectra have been carried out to study the effect of the plasma treatment on the surface modification of nitrogen-containing groups. The morphological changes of the particles surface by plasma treatment have also been analyzed by using HR-TEM. Present results show that the highest values of N/C atomic ratio of 5.4 % is obtained by applying 10 min of Ar plasma pre-treatment and 2 min of NH3plasma post-treatment conducted in RF power of 80 W and gas pressure of
50 Pa.
© 2011 Elsevier B.V. All rights reserved.
1. Introduction
Iron nanoparticles have many great interests in potential to bio-application such as drug delivery system, hyperthermia treatments, magnetic resonance imaging contrast enhancement, etc[1–8]. The carbon-encapsulated metal nanoparticles were first synthesized as LaC in 1993 by Ruoff et al. [9]. So far, these particles have been commonly produced by conventional arc discharge[10–15], modified arc discharge[16,17], chemical vapor deposition (CVD), combustion, laser synthesis, ion beam sputtering[18], and annealing microporous carbon or diamond with metal nanoparticles[19]. Carbon coating of the magnetic nanoparticles can leave the toxicity out without detracting their magnetic properties. Moreover, the carbon coating not only stabilize the nanoparticles but can also be used for further functionalization, such as addition of the therapeutic agent, targeting agent orfluorophore, depending on the purposes.
Among various functional groups for bio-application, the introduc-tion of amino groups composed of primary amines to the particles surface achieves enhanced wettability and improves its adhesion. Some early work by I.H. Loh et al. reports the use of ammonia plasma, nitrogen and nitrogen/hydrogen mixtures on carbon black[20]. Recently, there are also several other papers studying about the amino functionalization for carbon nanotubes[21,22], amorphous carbon sheet[23], nanocrys-talline diamond[24,25], carbon nanoparticles[26], etc. However, this modification has not been deeply studied on carbon-encapsulated
magnetic nanoparticles. In fact very few information can be found on the topic of graphite encapsulated iron nanoparticles related to the plasma surface treatment in order to introduce nitrogen-containing group functionalities, such as amino group.
In this study, we mainly functionalize the graphite encapsulated iron nanoparticles using Ar and NH3 plasma performed by an
inductively-coupled radio frequency plasma. X-ray diffraction (XRD), X-ray photoelectron spectroscopy (XPS), high resolution-transmission electron microscopy (HR-TEM), and energy dispersive X-ray spectroscopy (EDS) elemental mapping were used to charac-terize and analyze the results.
2. Experimental details
The graphite encapsulated iron particles were prepared by using arc discharge method refers to Refs.[14,15]. The arc discharge was generated by applying a dc current of 150–200 A at about 20 V voltage between anode and cathode. Graphite electrodes molded with Fe2O3
powder by using graphibond-551R was used as anode. In the other side, graphite rod was used as cathode. Both of those electrodes were set with distance as near as possible in a stainless-steel vacuum chamber with 200 mm diameter. The chamber was evacuated to around 1 Pa by a rotary pump. A mixture gas of He:CH4with ratio 4:1
wasflown to the chamber until the pressure reached 1.3 × 10⁴Pa. Then, carrying a high current between the electrodes will provide lots of composite powders. The powders were directly deposited on silicon substrates set inside the chamber. In order to obtain crystallographic characteristics, X-ray diffraction (XRD) measurements were performed with a RIGAKU RINT Ultima. For structural characterization, observation using HR-TEM was performed by using a JEM-2100F equipped CCD camera. The TEM sample was prepared by dispersing the nanoparticles
–
☆ Presented at NDNC 2010, the 4th International Conference on New Diamond and Nano Carbons, Suzhou, China.
⁎Corresponding author.
E-mail address:[email protected](M. Nagatsu).
0925-9635/$–see front matter © 2011 Elsevier B.V. All rights reserved. doi:10.1016/j.diamond.2011.01.027
Contents lists available atScienceDirect
Diamond & Related Materials
in ethanol and dropped onto the carbon grid. The TEM observation was conducted at an accelerating voltage of 200 kV.
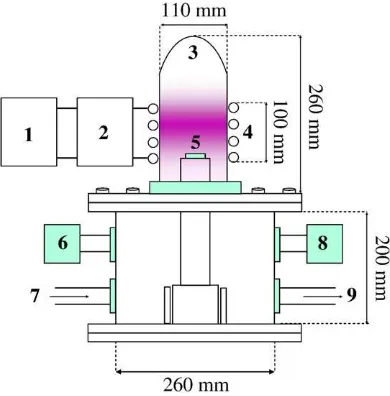
Following the nanoparticle synthesis step, the nanoparticles are treated by using an inductively-coupled radio frequency plasma device. The schematic view of the chamber is shown inFig. 1. The chamber is 200 mm both in diameter and height. The water-cooling copper pipe helical antenna, 100 mm in coil diameter and 20 mm in pipe diameter, was coupled to an RF power generator at 13.56 MHz via a matching net-work. Typical input RF power was about 80 W.
Samples were set in the glass dish placed on the stage inside the chamber. There are two-steps plasma treatment performed here. In the first step, pre-treatment was performed with Ar plasma and subsequently NH3 gas plasma was used as the post-treatment to
introduce the amino groups. The period time of plasma pre-treatment was performed for 10 min, while the period time of the post-treatment was varied to 2, 5 and 10 min. During the experiment, the gas pressure was varied as 5, 10 and 50 Pa at afixed gasflow rate of 50 sccm. After the plasma treatment, the treated samples are characterized by using XPS performed by Shimadzu ESCA-3400 with Mg KαX-Ray source and EDS elemental mapping performed by a JEM-2100F.
3. Results and discussion
The graphite encapsulated iron nanoparticles are successfully synthesized by arc discharge method. First, it is confirmed that the synthesized powders have a magnetic property, as shown inFig. 2a. The powders stirred in the purified water in the bottle are attracted by a permanent magnet, even when the magnet was located far from the bottle. In order to confirm their phase and structural characterization, XRD and HR-TEM analysis was carried out. The XRD profile presented inFig. 2b shows the presence of graphitic carbon (JCPDS 00-056-0159), crystallizedα-Fe (JCPDS 00-006-0696), iron carbides (Fe3C) (JCPDS 01-072-1110) and iron oxide (Fe2O3) (JCPDS 00-033-0664).
Typical TEM image of graphite encapsulated iron nanoparticles taken in high magnification is presented inFig. 2c. The diameters of particles are mainly around 10–50 nm in size measured from the outmost graphene layer. The spacing of the graphene layers is about 0.34 nm. To investigate the effect of chemical modification on the plasma-treated surfaces by Ar and NH3 plasma, XPS measurements were
carried out. The relative compositions of C 1s, N 1s, O 1s and Fe 2p, and atomic ratios of O/C and N/C of the samples before and after plasma treatment under different plasma conditions are listed inTable 1. The experimental results show that the relative composition of C 1s decreased after plasma treatment due to the ion bombardment of Ar plasma pre-treatment. With the Ar plasma pre-treatment, many free carbon bonding are expected to be created in the outmost of graphene layer and then react directly with NH3plasma to introduce the amino
group on the particle surface.
Comparing to the untreated sample, O/C atomic ratio of the samples after plasma treatment increased. The increase of O/C atomic ratio may be resulted from the following processes. First, carbon radicals are formed in the outermost shell of graphene layers by Ar plasma pre-treatment and NH3 plasma post-treatment, where the
sample surfaces are bombarded by electrons and ions and provide graphene layers with graphite bonding that would be lopped off to form carbon radicals. These radicals then can easily connect with
Fig. 1.Schematic view of experimental setup of inductively-coupled RF plasma. (1) RF powers supply, (2) Matching box, (3) Glass jar, (4) Cupper coil connected to the water-cooling system, (5) Sample place, (6) Pressure gauge, (7) Gas inlet, (8) Leaking valve, (9) Gas outlet connected to the turbo and rotary pump.
oxygen after opening to the atmosphere, which may result in the increasing of O/C atomic ratio.
The increase of N/C atomic ration indicates the formation of some nitrogen-containing groups on the outmost of graphene layers by NH3
plasma treatment. As for the treatment time, in the case of plasma condition at 5 Pa, the post-treatment time does not give a significant influence to the N/C atomic ratio. While the plasma condition at 10 Pa, the increase of post-treatment time will also make an increase their N/C atomic ratio. On the other hand, in the case of plasma condition at 50 Pa, the result is contrary. The highest enrichment of nitrogen-containing functionalities shown from N/C atomic ratio was obtained in the case of 2 min NH3plasma post-treatment at 50 Pa. The nitrogen percentage
decreased when the period time of post-treatment is longer than 2 min. This indicates that in the case of treatment in 50 Pa, NH3plasma
post-treatment time longer than 2 min is too long because the bound amino groups would be released by the electrons and ions existing in NH3
plasma. On the other hand, it is expected that opposite phenomena occur for plasma treatment performed in 10 Pa. The treatment times of 2 and 5 min at 10 Pa are still not optimum enough for linking nitrogen-containing groups.
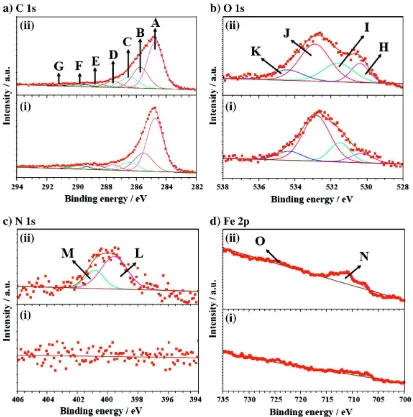
As shown in Fig. 3, the XPS spectra of both (i) untreated and (ii) treated sample of C 1s, O 1s, N 1s and Fe 2p regions are respectively
Table 1
Atomic composition of C 1s, O 1s, N 1s and Fe 2p peaks and atomic ratio of O/C and N/C taken from the XPS spectra before and after plasma treatment under various plasma conditions.
Sample Treatment period (min)
Atomic composition (%) Atomic ratio (%)
Pre-treatment
Post-treatment
C 1s O 1s N 1s Fe 2p 3/2
Fe 2p 1/2
O/C N/C
Untreated – – 87.91 10.68 0.00 0.82 0.59 12.15 0.00 80 W,
5 Pa
10 2 76.02 19.01 1.15 2.26 1.56 25.01 1.51
10 5 74.62 18.18 1.11 3.31 2.78 24.36 1.49
10 10 85.50 11.22 0.94 1.43 0.90 13.12 1.10 80 W,
10 Pa
10 2 81.02 14.72 1.02 2.24 1.01 18.17 1.26
10 5 80.15 16.05 1.73 1.67 0.40 20.02 2.16
10 10 76.93 16.12 3.51 1.58 1.87 20.95 4.56 80 W,
50 Pa
10 2 81.30 12.14 4.40 1.75 0.40 14.93 5.41
10 5 82.13 12.48 1.90 2.44 1.05 15.20 2.31
10 10 82.91 12.71 1.08 2.19 1.10 15.33 1.30
Plasma condition: Ar and NH3gasflow was kept on 50 sccm.
shown in Fig. 3a, b, c, and d, respectively. The treated sample shown in
Fig. 3corresponds to the treated sample with the highest enrichment of nitrogen-containing groups (80 W, 50 Pa, 10 min of pre-treatment and 2 min of post-treatment). Each of the spectra was deconvolved to several possible peaks based on the Refs.[21,27–37]. The C 1s spectrum shown inFig. 3a consists of several peaks, that are, graphitic carbon peak of C–C sp2at around 284.75 ± 0.01 eV (denoted by A)[35]; C
–C sp3at
around 285.63 ± 0.10 eV (B)[35]; carbon present in C–O and C–N at around 286.49 ± 0.01 eV (C); carbon present in C O at around 287.55 ± 0.01 eV (D); carbon present in O C–O and O C–N at around 288.75 ± 0.01 eV (E); carbon present in carbonate groups (–O2C O) at around
289.75 ± 0.01 eV (F) and typical π–π* shake-up satellite at around 291.49 ± 0.10 eV (G)[21,27,32,33,36,37]. The O 1s spectra shown in
Fig. 3bfitted to four component peaks: that corresponds to the lattice oxygen (O2−in FeO) at around 530.52 ± 0.14 eV (H)[28,30,31]; C O groups at around 532.09 ± 0.09 eV (I); C–OH and or C–O–C groups at around 533.23± 0.14 eV (J) and O C–O groups at around 534.34 ± 0.04 eV (K)[21,27,32,33]. InFig. 3c, a significant peak can be observed at around 400.0 eV in the N 1s spectra, which is possibly identified as nitrogen-containing functional group, such as–C–NH2at 399.56 eV (L)
and other substitutional sp2 nitrogen in the hexagonal rings of a
graphene structure at 400.84 eV (M)[27,29,34]. The highest atomic percentage of nitrogen is 4.40% increased from 0% of the control sample (untreated). Finally, in the Fe 2p region, there are two peaks slightly increase which represent to Fe 2p1/2(N) and Fe 2p3/2(O). The signals in
Fe 2p spectra can be allocated to be Fe0(before plasma treatment) and
Fe2O3and FeOOH (after plasma treatment)[28,31]. This change is the
consequence of the carbon etching due to radical and ion bombardment during plasma exposure.
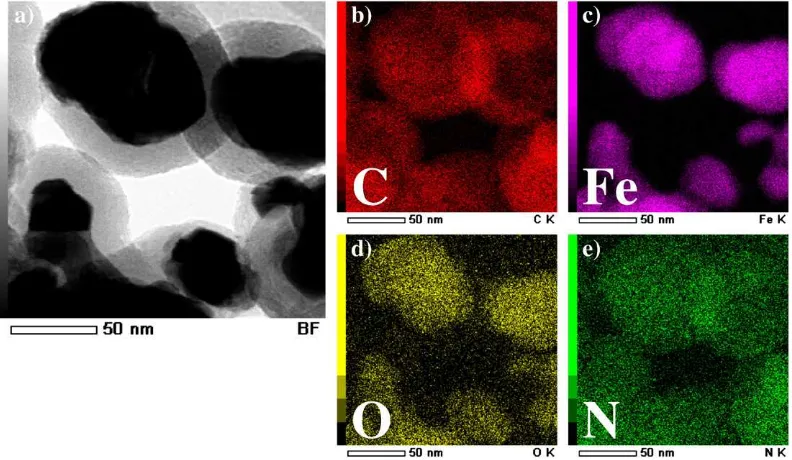
Beside the XPS spectra, the surface analysis of the treated sample is also carried out by the scanning TEM (STEM) image together with an energy dispersive X-ray spectroscopy (EDS) elemental mapping. After taking the STEM images, the EDS elemental mapping can be performed to address the element composition variation in the area of a STEM image. In Fig. 4, the left image (image in white and black color) represents to a STEM image of the treated sample while the four images in the right hand side represent to the EDS elemental mapping of C, Fe, O and N elements, respectively. For example, the map for C element shows the contrast area at the boundary side of particles which correspond to the graphene layers while the map for Fe element shows
the contrast area on the core part of particles which correspond to the iron core nanoparticles. The map of O element has a contrast area in the center of the particle but in less contrast compared to the map of Fe element. It indicates that the oxygen may be mainly found in the iron core nanoparticle rather than on the particle surfaces. On the other hand, the map of N element has a contrast area over the whole area of particles but in less contrast. It indicates that the nitrogen element is found on the whole surface area of the particles, which means that the surface modification successfully attach the nitrogen-containing groups on the outmost of particle surfaces. From the dominant signal at around 399.9 eV in N 1s region found in XPS spectra, it is considered that they are very likely to be amino group.
The proposed mechanism of the nitrogen groups attachment is explained as follows: during the plasma exposure, ion bombardment during the pre-treatment by argon plasma provides a sufficient energy to weaken and break the C–C bonds of the outmost of graphene layer, hence allowing the nitrogen-containing groups formed on the surface of graphene layers after post-treatment of NH3plasma. The nitrogen-containing groups formed during the
post-treatment plasma selectively attached on the outmost of particle surface (graphene layer). Furthermore, the structural of inner graphene layers and the iron core are still found in stable condition. This means that the ammonia plasma allows the efficient covalent functionalization of nitrogen-containing group to the surface particles without giving any destruction. These features are very analogous to the results of amino group addition on the carbon nanotube by ammonia plasma modification[21].
4. Conclusion
Based on the results and discussion described above, it can be concluded that the graphite encapsulated iron nanoparticles were successfully modified by plasma processing and characterized well using HR-TEM, XPS and EDS with elemental mapping. After the plasma treatment with experimental condition applied here, the surface of the outmost graphene layer was successfully covered by nitrogen-containing groups definitively assigned by XPS spectra and the STEM-EDS elemental mapping. The nitrogen-containing groups formed during the post-treatment plasma selectively attached on the outmost of graphene layer. The inner structure of inner graphene
layer and the iron core are still found in stable condition which means that the applied plasma condition allows the efficient covalent functionalization of nitrogen-containing group to the surface particles without any destruction.
Acknowledgement
This work has been supported in part by the Grants-in-Aid for Scientific Research and performed under Research and Education Funding for Research Promotion supported by MEXT.
References
[1] Q.A. Pankhurst, N.K.T. Thanh, S.K. Jones, J. Dobson, J. Phys. D Appl. Phys. 42 (2009) 224001.
[2] C.C. Berry, J. Phys. D Appl. Phys. 42 (2009) 224003.
[3] Q.A. Pankhurst, J. Connolly, S.K. Jones, J. Dobson, J. Phys. D Appl. Phys. (2003) R167.
[4] G. Pastorin, Pharm. Res. 26 (2009) 746.
[5] S. Kim, E. Shibata, R. Sergiienko, T. Nakamura, Carbon 46 (2008) 1523. [6] A. Ito, M. Shinkai, H. Honda, T. Kobayashi, J. Biosci. Bioeng. 100 (2005) 1. [7] A.-H. Lu, E.L. Salabas, F. Schuth, Angew. Chem. Int. Ed. 46 (2007) 1222. [8] C.C. Berry, A.S.G. Curtis, J. Phys. D Appl. Phys. (2003) R198.
[9] R.S. Ruoff, D.C. Lorents, B. Chan, R. Malhotra, S. Subramoney, Science 259 (1993) 346.
[10] M.E. McHenry, S.A. Majetich, J.O. Artman, M. DeGraef, S.W. Staley, Phys. Rev. B 49 (1994) 11358.
[11] Y. Saito, T. Yoshikawa, M. Okuda, N. Fujimoto, S. Yamamuro, K. Wakoh, K. Sumiyama, K. Suzuki, A. Kasuya, Y. Nishina, J. Appl. Phys. 75 (1994) 134.
[12] A.A. Setlur, J.Y. Dai, J.M. Lauerhaas, R.P.H. Chang, Carbon 36 (1998) 721. [13] Y. Yosida, S. Shida, T. Ohsuna, N. Shiraga, J. Appl. Phys. 76 (1994) 4533. [14] Y. Saito, T. Yoshikawa, M. Okuda, N. Fujimoto, S. Yamamuro, K. Wakoh, K. Sumiyama,
K. Suzuki, A. Kasuya, Y. Nishina, Chem. Phys. Lett. 212 (1993) 379.
[15] M. Nagatsu, T. Yoshida, M. Mesko, A. Ogino, T. Matsuda, T. Tanaka, H. Tatsuoka, K. Murakami, Carbon 44 (2006) 3336.
[16] V.P. Dravid, J.J. Host, M.H. Teng, B.E.J. Hwang, D.L. Johnson, T.O. Mason, J.R. Weertman, Nature 374 (1995) 602.
[17] J. Jiao, S. Seraphin, X. Wang, J.C. Withers, J. Appl. Phys. 80 (1996) 103. [18] T. Hayashi, S. Hirono, M. Tomita, S. Umemura, Nature 381 (1996) 772. [19] P.J.F. Harris, S.C. Tsang, Chem. Phys. Lett. 293 (1998) 53.
[20] I.H. Loh, R.E. Cohen, R.F. Baddour, J. Mater. Sci. 22 (1987) 2937.
[21] C. Chen, B. Liang, D. Lu, A. Ogino, X. Wang, M. Nagatsu, Carbon 48 (2010) 939. [22] A. Felten, C. Bittencourt, J.J. Pireaux, G. Van Lier, J.C. Charlier, J. Appl. Phys. 98
(2005) 074308.
[23] N. Inagaki, K. Narushima, H. Hashimoto, K. Tamura, Carbon 45 (2007) 797. [24] Z. Remes, A. Choukourov, J. Stuchlik, J. Potmesil, M. Vanecek, Diamond Relat.
Mater. 15 (2006) 745.
[25] Z. Remes, A. Kromka, M. Vanecek, A. Grinevich, H. Hartmannova, S. Kmoch, Diamond Relat. Mater. 16 (2007) 671.
[26] W.-K. Oh, H. Yoon, J. Jang, Diamond Relat. Mater. 18 (2009) 1316.
[27] G. Beamson, D. Briggs, High Resolution XPS of Organic Polymers: The Scienta ESCA 300 Database, John Wiley & Sons, Chichester, 1992.
[28] P. Graat, M.A.J. Somers, Surf. Interface Anal. 26 (1998) 773.
[29] K. Schroder, B. Finke, A. Ohl, in: R. D'Agostino, P. Favia, C. Oehr, M.R. Wertheimer (Eds.), Plasma Processes and Polymers: 16th International Symposium on Plasma Chemistry Taormina, Italy June 22–27, 2003, Wiley InterScience, Weinheim, 2005, p. 333.
[30] E. Sosa, R. Cabrera-Sierra, M.T. Oropeza, F. Hernandez, N. Casillas, R. Tremont, C. Cabrera, I. Gonzalez, Electrochim. Acta 48 (2003) 1665.
[31] S. Suzuki, K. Yanagihara, K. Hirokawa, Surf. Interface Anal. 30 (2000) 372. [32] Z.R. Yue, W. Jiang, L. Wang, S.D. Gardner, J.C.U. Pittman, Carbon 37 (1999) 1785. [33] J.-H. Zhou, Z.-J. Sui, J. Zhu, P. Li, D. Chen, Y.-C. Dai, W.-K. Yuan, Carbon 45 (2007)
785.
[34] S. Point, T. Minea, B. Bouchet-Fabre, A. Granier, G. Turban, Diamond Relat. Mater. 14 (2005) 891.
[35] S. Zhang, Y.Q. Fu, X.L. Bui, H.J. Du, Int. J. Nanosci. 3 (2004) 797.
[36] Y.-Q. Wang, H. Viswanathan, A.A. Audi, P.M.A. Sherwood, Chem. Mater. 12 (2000) 1100.