Lauri Luumi
Effect of weld defects on mechanical properties of spent
nuclear fuel copper canisters
Master’s thesis submitted in partial fulfillment of the requirements for the degree of Master of Science in Technology.
Espoo 2.6.2014
Supervisor: Professor Hannu Hänninen Advisor: Professor Pedro Vilaca
Diplomityön tiivistelmä
Tekijä Lauri Luumi
Työn nimi Hitsausvirheiden vaikutus käytetyn ydinpolttoaineen kuparikapselin mekaanisiin ominaisuuksiin
Laitos Koneenrakennustekniikan laitos
Professuuri Koneenrakennuksen materiaalitekniikka Professuurikoodi Kon-67 Työn valvoja Professori Hannu Hänninen
Työn ohjaaja(t)/Työntarkastaja(t) Professori Pedro Vilaca
Päivämäärä 2.6.2014 Sivumäärä 70 Kieli Englanti
Tiivistelmä
Tämä diplomityö on osa KYT-projektia, joka selvittää käytetyn ydinpolttoaineen loppu-sijoituskapselin turvallisuutta Suomessa. Nykyisen suunnitelman mukaan käytetty ydinpolttoaine sijoitetaan valurautaiseen sisäosaan kuparivaippaan. Tämä kapseli on ensisijainen este ydinjätteen ja ympäristön välillä ja se pitää hitsata tiiviiksi. Kahta hit-sausmenetelmää on tutkittu: kitkarappihitsausta (FSW) ensisijaisesti ja elektronisuih-kuhitsausta (EBW) varalla.
Virumiskokeet osoittavat kuparin murtumisvenymän alenevan pitkillä koeajoilla, ja että muodonmuutos paikallistuu etenkin EB-hitseihin. Kapselin tulee säilyä tiiviinä vähin-tään 100 000 vuotta. Pitkäaikainen turvallisuus voi vaarantua, jos virumisvenymä ale-nee liiaksi ja venymä paikallistuu hitsiin voimakkaasti.
Hitsausvirheiden vaikutusta kanisterin mekaanisiin ominaisuuksiin ja venymän paikal-listumiseen tutkittiin vetokokeilla ja optisella venymämittauksella ehjillä ja hitsausvir-heitä sisältävillä näytteillä. Käytetyt venymänopeudet olivat 10-5 ja 4*10-7 1/s.
Tulokset osoittavat matalamman venymänopeuden alentavan mekaanisia ominaisuuk-sia 4 %. Venymäarvot ovat melkein kaksi kertaa korkeammat FSW-hitsatuille näytteille kuin EB-hitsatuille. Venymä paikallistui välittömästi EB-hitseihin. Kahta hitsausvirheel-listä EB-hitsiä testattiin, joista toisen ominaisuudet olivat alemmat kuin ehjän, mutta toisen eivät. Madonreikä tyyppinen vika FSW-hitsissä alensi venymäarvoja 40 – 50 %. Yleinen oletus on ollut, että jännityskeskittymät aiheuttavat sitkeässä kuparissa vain tylpistymistä eikä huomattavaa mekaanisten ominaisuuksien laskua. Tämän tutkimuk-sen perusteella hitsausvirhetyypillä on merkittävä vaikutus mekaanisten ominaisuuksi-en heikkominaisuuksi-enemiseominaisuuksi-en.
www.aalto.fi
Abstract of master's thesis
Author Lauri Luumi
Title of thesis Effect of weld defects on mechanical properties of spent nuclear fuel copper canisters
Department Department of Engineering Design and Production
Professorship Engineering Materials Code of professorship Kon-67 Thesis supervisor Professor Hannu Hänninen
Thesis advisor(s) / Thesis examiner(s)) Professor Pedro Vilaca
Date 2.6.2014 Number of pages 70 Language English Abstract
This thesis is a part of the KYT-project which studies the safety of the disposal canister for spent nuclear fuel in Finland. The current plan is to encapsulate the spent nuclear fuel elements into a canister with a cast iron insert and a copper overpack. The canister is the primary barrier isolating the nuclear waste from the environment and it has to be welded. Two welding methods have been considered, friction stir welding (FSW) being the primary choice and electron beam welding (EBW) as back-up.
Creep tests indicate that fracture strain for copper reduces with time and that strain lo-calizes especially to EB-welds. The canister needs to stay intact at least 100 000 years in the repository. With enough reduction of creep strain and high enough strain localiza-tion to the weld, creep may threaten the long-term integrity of the overpack.
The effect of weld defects on mechanical properties of the overpack and strain localiza-tion is studied by conducting tensile tests with digital image correlalocaliza-tion using mock-up welds and defected specimens. Strain rates 10-5 and 4*10-7 1/s are used.
The results indicate that the lower strain rate has a negative effect of about 4 % on ten-sile properties. For FSW, the strain values are almost twice as high compared to EB. In the weld specimens, strain localized immediately to the weld. Two different EB-welds with defects were tested and one showed no reduction of tensile properties while the other one did. A wormhole defect in an FSW-weld reduced strain values by 40 – 50 %.
The general assumption has been that any stress concentration will be blunted by the ductile copper and not significantly decrease the mechanical properties. However, ac-cording to the present study, the defect type appears to have a significant effect on whether it reduces tensile properties.
Preface
This thesis has been carried out as part of the KYT-project at the Laboratory of Engi-neering Materials at Aalto University School of EngiEngi-neering.
I would like to acknowledge all the people who have been of assistance during the pro-ject. Most importantly, thanks go to my supervisor, professor Hannu Hänninen, for providing this great opportunity and for being patient. I thank Dr. Mykola Ivanchenko for showing the ropes of scientific research and working at the laboratory. I am grateful for professors Pedro Vilaca and Sven Bossuyt for all the help and support. I wish to express my gratitude towards professors Hiroyuki Kokawa and Yutaka Sato and their whole laboratory for welcoming me and supporting me in producing my weld speci-mens. I thank Kim Widell for conducting the tensile tests and optical strain measure-ments and Laura Tiainen for assisting with the samples. Special thanks go to Antti Forsström and all other coworkers for making work as painless as possible.
Lastly, I must thank my mother Leila for her unwavering faith and overwhelming sup-port, not only during this thesis work, but throughout my life.
Espoo 2.6.2014
Table of Contents
Abstract Preface
Table of Contents ... 1
1 Introduction ... 3
2 Electron Beam Welding ... 5
2.1 Principle ... 5
2.2 Equipment ... 7
2.3 Weld Properties ... 7
3 Friction Stir Welding ... 10
3.1 Principle ... 10
3.2 Welding Parameters ... 12
3.3 Weld Properties ... 14
3.4 Weld Defects ... 14
4 Copper Overpack Design ... 16
4.1 Copper as Base Material ... 16
4.2 Failure Mechanisms ... 17
4.3 Long-term Mechanical Properties ... 19
5 Digital Image Correlation ... 22
5.1 Introduction ... 22 5.2 Experimental Setup ... 22 5.3 Image Analysis ... 24 5.4 Error Sources ... 25 5.5 Applications ... 26 6 Experimental ... 28 6.1 Base Material ... 28 6.2 Welding Trials ... 28 6.2.1 FSW Mock-up ... 28 6.2.2 EBW Mock-up ... 30
6.2.3 Friction Stir Welds with Defects ... 32
6.2.4 Electron Beam Welds with Defects ... 36
7 Results ... 45
7.1 Tensile Tests ... 45
7.2 Strain Localization ... 47
8 Discussion and Conclusions ... 62
9 Recommended Further Research ... 63
1 Introduction
This thesis is a part of the KYT-project which studies the safety of the disposal canister for spent nuclear fuel in Finland. The current plan is to encapsulate the spent nuclear fuel rods into a canister with a cast iron insert and a 49 mm thick copper overpack. Fig-ure 1.1 shows the fuel rods inside the canister. The canisters will be deposited in the bedrock 500 meters underground surrounded by bentonite clay as shown in Figure 1.2. [Raiko 2013] [Cederqvist 2006]
Figure 1.2. Spent nuclear fuel repository. [Cederqvist 2006]
The canister is the primary barrier isolating the nuclear waste from the environment. Cast iron insert provides the necessary mechanical strength and the copper overpack the corrosion resistance. The lid and possibly also the bottom have to be welded to the cop-per tube in order to seal the canister. Two welding methods have been considered, fric-tion stir welding (FSW) being the primary choice and electron beam welding (EBW) as back-up. [Raiko 2013]
The main function of the copper overpack is to act as a corrosion barrier, but it has to withstand the mechanical loads intact to prevent the radioactive matter from reaching the environment. The welds are usually the weakest point in a welded structure and should be studied carefully. Even though according to modeling, stresses and strains in the welds should not become dangerously high, creep tests indicate that fracture strain for copper reduces with time and that strain localizes especially to EB-welds [Anders-son-Östling 2009] [Savolainen 2011]. The canister needs to last at least 10 000 years in the repository, according to the regulations [YVL D.5, Section 408], but design is based on 100 000 years [Raiko 2013]. With enough reduction of creep strain and high enough strain localization to the weld, it may threaten the long-term integrity of the overpack. The effect of weld defects on mechanical properties of the overpack and strain localiza-tion has not been studied earlier and the purpose of this thesis is to correct that.
2 Electron Beam Welding
2.1 Principle
Electron beam welding is based on heating the work piece using the kinetic energy of accelerated electrons. The velocity of electrons upon impact is in the order of two thirds of light speed. Since electrons have an electric charge, they can be manipulated with electric fields and magnetic lenses allowing focusing on a single spot. [Schultz 1993]
Electron source is a metallic cathode which is heated to loosen its outer electrons. High-er tempHigh-erature of the cathode provides more electrons so tungsten or anothHigh-er high melt-ing point metal is commonly chosen. An anode as the positive pole is used to accelerate free electrons from the surface of the cathode into a high-velocity beam. A generator provides the cathode new electrons in the form of electric current. The cathode is also the only part that wears but is easily replaced. An estimated life for a cathode is 20 hours. [Schultz 1993] [Cary 2005]
After acceleration through the anode, the divergent electron beam is converged with an electromagnetic lens. Typical diameter for the focal point is 0.1 – 1 mm. An illustration of a typical electron gun is shown in Figure 2.1. [Schultz 1993]
A vacuum is needed to prevent electrons from hitting air molecules and deflecting and to prevent oxidization of the high-temperature cathode. The vacuum is typically 10-4 mbar near the electron gun and can be up to around 10-2 mbar near the work piece. [Schultz 1993]
A deep weld characteristic to EBW is achieved through a very high power density. Electrons only heat the surface of the work piece but the heating is so high that the met-al not only melts but met-also vaporizes. This vaporization met-allows the electron beam to pene-trate deeper as the gas lets the electrons through. The gas formed in the metal also ex-pands and creates lateral forces to keep the molten metal on the sides. This leads to a so called keyhole which makes weld depths of over 50 mm possible (Figure 2.2). [Schultz 1993] [Cary 2005]
Figure 2.1. Typical components of the electron gun. [Schultz 1993]
2.2 Equipment
Typical EB-welding equipment consists of an EB-generator, vacuum chamber with ma-nipulators, vacuum pumps, high voltage supply and a controlling unit (Figure 2.3). The primary parameters are accelerating voltage, beam current, focus current and welding speed which are all numerically controlled. [Meuronen 2010]
Figure 2.3. Typical EB-welding equipment. [Meuronen 2010]
2.3 Weld Properties
One of the most important characteristics of EBW is the capability to produce deep and narrow weld profiles. Narrowness reduces residual stress and heat affected zone. EBW has high precision and distortions are minimal. There are no consumables; gases or fill-er metal and the process can be fully automated. [Meuronen 2010] [Schultz 1993]
Although high quality welds can be produced with proper preparation and parameters, voids and cavities are expected to be present in all EB welds. There is a higher risk for
welds that do not penetrate the work piece fully to leave sharp-edged cavities. Radio-graphic and ultrasonic testing is recommended to confirm adequate quality. [Schultz 1993]
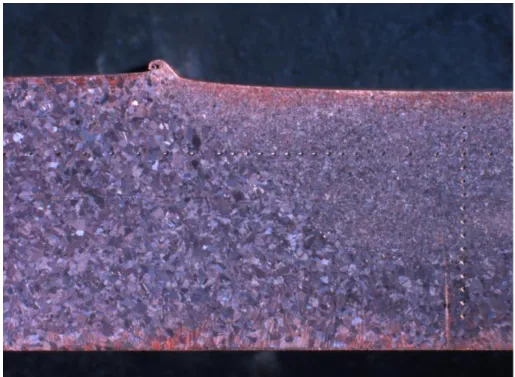
Electron beam welds for the spent nuclear fuel canister are not technically keyhole welds as they do not fully penetrate the work piece. Figure 2.4 shows a test weld for the canister with the clearance between the lid and the tube visible. Along with Figure 2.5, it also shows the grain size and orientation. Grains in the weld are visible to the naked eye and oriented in the welding direction [Savolainen 2011].
Figure 2.4. A transverse cut of a test weld for the canister. [Meuronen 2010]
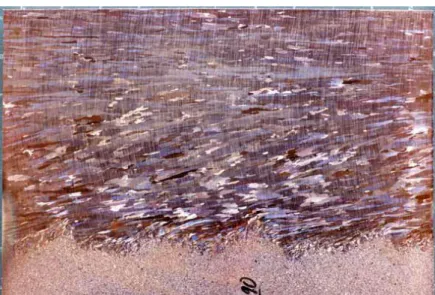
Figure 2.5. A longitudinal cut from the top of the weld with welding direction being to the right. [Meuronen 2010]
The most relevant defect types for the EBW of the capsule are presented in Figure 2.6. Spiking is an internal root cavity caused by improper weld parameters. Pores form through gases being trapped in the keyhole. Cavities are usually sharp and 3 – 4 mm long while pores are round and up to 0.5 mm which makes cavities more dangerous [Schultz 1993] [Bowyer 2000]. [Pitkänen 2010]
Gun discharge occurs when for example metal vapor enters the electron gun and inter-rupts the beam. This can cause serious damage but can be prevented by using an EBW machine that has a deflected beam. A too high or too low beam current can lead to de-fects on the weld crown or root called run out. [Pitkänen 2010]
3 Friction Stir Welding
3.1 Principle
Friction stir welding (FSW) process was invented by Wayne Thomas et al. and patented by The Welding Institute (TWI) in 1991 [Thomas 1991]. FSW is a solid-state joining process using a non-consumable tool made of material that is harder than the workpiece material being welded. FSW can be regarded as an autogeneous keyhole joining tech-nique without melting of the workpiece. [Vilaca 2012] [Arbegast 2006] [Savolainen 2012]
In FSW butt-welding, the rotating tool is plunged into the weld joint of two rigidly clamped plates and forced to traverse along the joint line. Friction between the tool and the workpiece produces heat near the tool. Shear deformation of the welded metal pro-duces heat further away from the tool. The heated and softened workpiece is extruded, forged and stirred to form a joint at the trailing edge. The basic principles and nomen-clature of the process are represented in Figure 3.1. [Vilaca 2012] [Arbegast 2006] [Savolainen 2012]
The base material is moved by the tool in a complex flow which depends on tool design, welding parameters, base material, and the contact condition between the tool and the base material. The material flow is very different on the advancing side as compared to the retreating side leading to an asymmetric process. This intense plastic deformation at elevated temperature results in fine and equiaxed recrystallized grains and a fine micro-structure with good mechanical properties. [Vilaca 2012] [De Vuyst 2006] [Savolainen 2012]
The typical transverse microstructure of a FSW-weld is comprised of four zones. The stir zone (SZ) or nugget is in the center. The stir zone forms in the wake of the probe and has undergone the most severe plastic deformation and the highest temperature. The stir zone is surrounded by the thermo-mechanically affected zone (TMAZ). In the TMAZ, strain and temperature are lower. TMAZ is followed by the heat-affected zone (HAZ), where the base material changes are only due to the temperature. Beyond this lies the unaffected base material. Figure 3.2 shows the zones in a 50 mm thick copper FSW-weld. [Källgren 2010] [Savolainen 2012]
Figure 3.2. Microstructural zones in a 50 mm thick copper FSW weld. [Källgren 2010]
Although still regarded as a novel process, FSW has made a significant contribution to the joining of light-weight metallic components and has become the first choice welding technique for certain applications. In addition to aluminum and copper, FSW can also
be used to weld, for example, magnesium [Kannan 2007], titanium [Fujii 2010] and even steels [Thomas 2009]. [Vilaca 2012]
3.2 Welding Parameters
The most important FSW-welding parameter is the tool. Tool geometries vary from a simple cylinder to complex shapes with multiple features like the triflute used to seal the spent nuclear fuel canisters (Figure 3.3). The complexity of the tool increases with workpiece thickness to ensure 3-dimensional flow of metal. The tool should efficiently plasticize the joint material while minimizing the forces required and increase the stir-ring effect of the workpieces to sufficiently fragment and disperse the oxide layer. The role of the probe is to thoroughly stir both sides of the joint together. The shoulder pro-vides frictional heat and constraint to the flow of the plasticized material. The tool needs to withstand the combinations of mechanical torsion, bending and vibration under ex-treme wear and temperature conditions. The essential and desired properties of the tool are presented in Table 3.1. [Vilaca 2012] [Colligan 2005] [Savolainen 2012]
Figure 3.3. The tool used by SKB to seal the spent nuclear fuel canisters with a 50 mm triflute probe and a CS4 shoulder. [Cederqvist 2011]
Table 3.1. Essential and desirable properties of the FSW tool material. [Threadgill 2003]
Tool material is designed to be non-consumable during the process to maintain tool ge-ometry and avoid contaminating the joint with tool material. Typically aluminum is welded with tools made of steel and superalloys [Miyake 2013], refractory metal alloys [Sato 2007] and ceramics [Steel 2012] are used to weld higher melting temperature metals. The tool used for sealing the spent nuclear fuel copper canisters is made of nick-el-based superalloy probe, tungsten alloy shoulder and the probe is coated with chromi-um nitride. [Threadgill 2003] [Cederqvist 2011] [Savolainen 2012] [Vilaca 2012]
Other key parameters in the welding set-up are the clamping, backing anvil and welding machine rigidity and tolerances. Clamping needs to be strong enough to keep the work-pieces stationary during welding. Backing anvil material and geometry along with the clamping system affect heat conduction. Low rigidity or high tolerances in the welding machine affect the tool movement and the process as a whole and result in high stresses in the probe. [Vilaca 2012] [Upadhyay 2012]
The process is usually controlled through tool rotation speed, axial load or plunge depth. Temperature can be measured and controlled as well and in production of sound welds,
temperature can be the most important parameter to control. Rotation speed is the most sensitive way to affect temperature. [Cederqvist 2011] [Vilaca 2012]
3.3 Weld Properties
FSW is a solid state joining method and therefore the defects of fusion welding due to the liquid state, such as solidification cracking, are avoided. Compatibility between fill-er metal and base matfill-erial does not need to be considfill-ered eithfill-er. It offfill-ers excellent weld quality with mechanical properties generally surpassing those produced with fusion welding methods and rivaling the base material. The gradient in joint properties and microstructure between the base material and the joint is less steep than with fusion welding. Additionally, it is safe, clean, and environmentally friendly. It does not require filler wires or high level of operator skill. [Savolainen 2012] [Vilaca 2012]
Other advantages claimed for the process include minimal distortion, hot forged micro-structure, low residual stress levels, environmentally friendly with absence of welding fumes, suitability for automation, good mechanical properties, not influenced by mag-netic forces and low hydrogen content in the joint. Limitations of FSW include the need for a backing anvil, presence of a keyhole at the end of each weld and requirement of rigid clamping of the workpiece. [Vilaca 2012]
3.4 Weld Defects
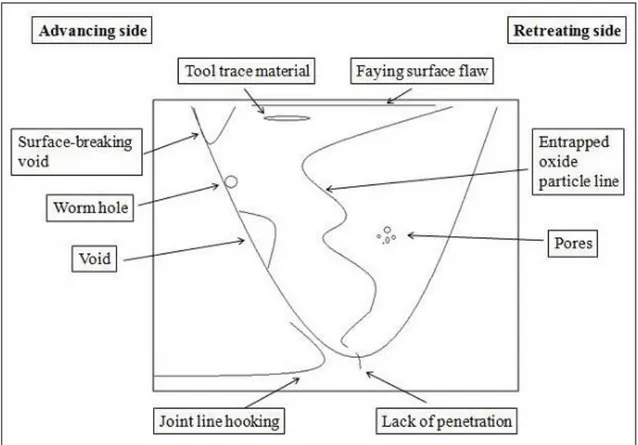
Savolainen (2012) characterized the possible weld flaw types and they are shown in Figure 3.4. The most relevant types in this thesis are voids and lack of penetration (LoP).
Voids and wormholes are volumetric areas lacking material and running continuously in the welding direction. They are often formed on the advancing side and caused by too cold welding conditions. This can be corrected by increasing rotation speed, plunge depth or axial force or decreasing traverse speed. They can be detected with radiograph-ic and ultrasonradiograph-ic testing. [Källgren 2010] [Pitkänen 2010] [Savolainen 2012]
Figure 3.4. A schematic presentation of the location of different welding defects in copper FSW welds. [Savolainen 2012]
Lack of penetration leaves the root of the weld disconnected. This is effectively a crack that causes a high stress concentration. Impact on tensile properties depends on its size. The main cause for LoP is the probe not reaching the root of the weld due to too low plunge depth or axial force or workpiece thickness variation. LoP can be detected with radiographic and ultrasonic testing but not completely reliably. [Savolainen 2012] [Zet-tler 2010] [Fuller 2007]
Joint line hooking is usually seen in lap joints but also in the spent nuclear fuel canister weld due to their joint geometry. It forms when the vertical joint line is pulled out in the horizontal direction by the material flow. It is caused by a too long tool probe or too deep plunge depth. The size of the defect has been reduced to the minimum of 1 mm. Joint line hooking can be easily detected using ultrasound but not with radiography. [Pitkänen 2010] [Savolainen 2012] [Ronneteg 2006]
4 Copper Overpack Design
4.1 Copper as Base Material
Radiation and Nuclear Safety Authority (STUK) requires that the engineered barriers prevent the release of radioactive substances into bedrock for at least 10 000 years [YVL D.5 Section 408]. The main function of the copper overpack is to act as a corro-sion barrier, but it also needs to withstand mechanical loads without breaking and leak-ing. [Raiko 2013]
Copper is selected as a corrosion protection layer due to its corrosion resistance. It is a noble metal, it is available at reasonable cost, and it does not require an oxide film on the surface to withstand the corrosion. The corrosion of oxygen-free copper in reposito-ry environment has been widely studied [King 2011] and it fulfills the design require-ment of staying intact in the conditions expected in the repository for well over 10 000 years. Copper is also an excellent conductor of heat which leads to an even temperature distribution on the canister and better heat conduction out of the canister. [Raiko 2013]
Copper has very good mechanical properties in that it can withstand the plastic defor-mation from hydrostatic pressure and tectonic movements in the repository. It has the fracture toughness against flaws from fabrication or welding and the necessary creep resistance. [Raiko 2013]
The material of the copper overpack is oxygen-free copper (Cu-OF) with an addition of 30 – 100 ppm of phosphorus making it Cu-OFP. The micro-alloying improves the creep strain properties of Cu-OF especially around 200 – 300 °C. This lowers the risk of cracking during hot deformation. The material for copper canisters shall fulfil the speci-fication in EN 1976:1998 for the grades Cu-OFE or Cu-OF1 with the following addi-tional requirements: O <5 ppm, P 30–100 ppm, H <0.6 ppm, S <8 ppm. Addiaddi-tionally, the grain size of the hot formed copper is limited to <360 μm to avoid excessive atten-uation in ultrasonic testing. [Raiko 2013]
The typical values for mechanical properties that are given are 69 MPa for the yield strength and 220 MPa for the tensile strength in soft condition. In the canister
produc-tion tests, yield strength values from 40 to 75 MPa have been obtained at normal strain rates for tensile testing. Tensile strength decreases with slower strain rates (Figure 4.1). [Sandström 2009]
Figure 4.1. Stress strain curves of Cu-OFP with different strain rates. [Sandström 2009]
4.2 Failure Mechanisms
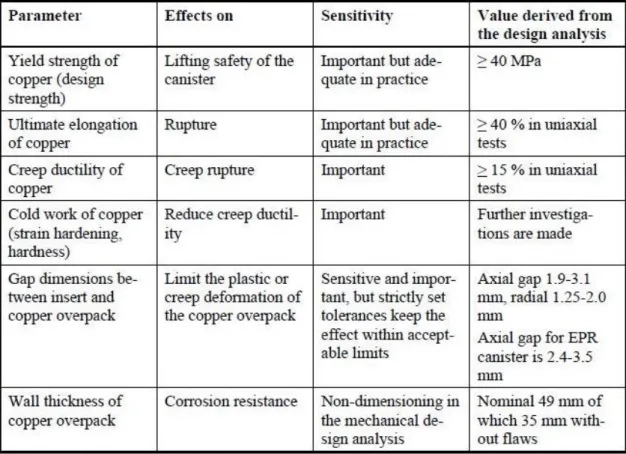
Possible failure mechanisms as evaluated by Posiva and SKB are presented with their respective governing parameters in Table 4.1. Brittle failure and creep crack growth have been excluded on the basis of sufficient ductility of copper to blunt all defects. This conclusion was attributed to a 2008 study by Wells but has yet to be published. Creep tests of notched specimens and compact tensile (CT) specimens in 20 – 75 °C show only blunting of the notch or crack without creep crack growth [Andersson-Östling 2009] [Wu 2011]. [SKB 2010] [Raiko 2013]
Corrosion depth is expected to be at most only 2 mm in a million years [King 2011] but stress corrosion cracking (SCC) has to be addressed. The three required components of SCC can be found as Cu-OFP has been shown to be susceptible to SCC in the estimated chemical environment in the repository. Tensile stress comes either from external hy-drostatic pressure or residual stress from welding. EBW produces much higher residual stresses than FSW [Raiko 2010] [Romppanen 2013] [Laakkonen 2013]. EBW produces larger grains, as well, which decreases resistance to SCC. The repository environment evolves towards conditions less susceptible to SCC with time, so detrimental SCC is considered unlikely. [King 2011] [Raiko 2013]
Table 4.1. Essential mechanical engineering parameters for the copper overpack. Elon-gation and creep ductility are in reduction of area. [Raiko 2013]
To assure conservativeness in regards to corrosion, the thickness of the intact oxygen-free copper overpack is selected to be at least 35 mm. The nominal wall thickness in the design is 49 mm. The excess dimension is reserved for manufacturing allowances and for postulated material imperfections in the base material or welds. [SKB 2010] [Meuronen 2010] [Raiko 2013]
Even though weld defects should not pose a threat, maximum allowed dimensions for indications in NDT have been determined and are shown in Table 4.2. The reasoning for these sizes comes from remaining wall thickness instead of stress concentration [Pitkänen 2010]. However, creep tests of canister welds with defects have shown creep crack propagation and reduction of ductility and life [Auerkari 2009].
Table 4.2. Types of weld defects with respective maximum allowable sizes. [Pitkänen 2010]
4.3 Long-term Mechanical Properties
The most relevant failure mechanism in the context of this thesis is creep rupture of the weld. Thus ductility with various strain rates becomes important. In tensile tests, base material and FS-welded Cu-OFP start to rupture at around 50 % elongation, 80 % re-duction of area or 160 % true strain which is the limit for plastic deformation. Savo-lainen (2012) used digital image correlation to measure elongation of the base material and mock-up FSW and EB welds at strain rates of 5*10-4, 10-5 and 10-6 1/s and found FSW to be comparable to base material at 60 % whereas the EBW achieved 40 % (Fig-ure 4.2). Strain rate did not have a significant effect in this range. [Holmström 2012] [Andersson-Östling 2009] [Savolainen 2012] [Andersson 2005]
Figure 4.2. Tensile test curves from mock-ups at strain rate of 5*10-4 1/s. [Savolainen 2012]
At 75 – 175 °C, elongation is over 50 % for the base material but around 30 % elonga-tion is achieved for EB-welded specimens. The reducelonga-tion of area stays at 80 % for the EBW which is explained by strong strain localization in the weld. Creep tests at 75 – 175 °C and 110 – 180 MPa indicate that the lowest values for creep ductility for the base material are about 40 %, for FSW over 30 % and for EBW over 20 %. Creep tests show a trend of reduced elongation with increasing time to rupture. [Andersson-Östling 2009] [Holmström 2012]
The deformation in slow strain rate tensile tests and creep tests localizes quickly to the weld in EBW specimens. The weakest points are the center of the weld and fusion line. The base material and FSW specimens strain uniformly much more before necking. Reportedly [Andersson-Östling 2009], for FSW cross-weld specimens, necking can occur on both heat affected zones simultaneously before fracture. It can also localize on a processing line or a line of entrapped oxide particles [Savolainen 2012]. [Holmström 2012]
Copper has the highest creep ductility with a grain size of 50 – 100 µm. Cu-OFP base material has a grain size of 60 – 75 μm, FSW produces about 60 μm grains while EBW
on average in the order of 2000 μm and up to 12 mm. It is assumed that this affects strength and ductility negatively. [Andersson-Östling 2009] [Savolainen 2012]
It is believed that grain size affects the segregation of sulfur to grain boundaries. Re-ports by SSM [Bowyer 2005] and SKB [Andersson-Östling 2009] estimate considerable reduction of ductility with grain sizes over 100 µm with at least 6 ppm of sulfur. The average grain size of EBW exceeds 100 µm significantly and 8 ppm of sulfur is allowed in the base material by Posiva.
5 Digital Image Correlation
5.1 Introduction
Digital image correlation (DIC) is a method for strain measurement akin to using strain gauges. Compared to strain gauges, though, DIC can give the strain information of the whole sample area instead of only one location, which allows the study of strain locali-zation.
DIC is an optical non-contact full-field displacement measurement technique that utiliz-es visual information from an object to calculate strains on the surface of the specimen. The most relevant feature of DIC regarding this work is that it is a full-field technique able to measure high strain heterogeneity in a welded structure [Lagattu 2004]. Non-homogenous materials and samples like welds often exhibit strain localization which cannot be measured with a basic strain gauge [Schmidt 2003].
In general, the implementation of two-dimensional DIC (2D DIC) comprises of three steps; specimen and experimental preparations, recording images of the specimen sur-face before, during and after loading and processing the acquired images using a com-puter program to obtain the desired displacement and strain information. [Pan 2009a]
5.2 Experimental Setup
Figure 5.1 shows the schematic illustration of a typical experimental setup using a cam-era for the 2D DIC method. The camcam-era is placed with its optical axis normal to the specimen surface. [Pan 2009a]
Figure 5.1. Schematic illustration of a typical 2D DIC experimental setup. [Pan 2009a]
The specimen surface must have a random gray intensity distribution (i.e. the random speckle pattern) which deforms together with the specimen surface as a carrier of de-formation inde-formation. The function of the pattern is to ensure that different defor-mations of the object result in different images, so that the defordefor-mations will be observ-able by measuring images. The ideal surface texture is non-repetitive, isotropic and has a high contrast [Helfrick 2008]. The speckle pattern can be the natural texture of the specimen surface or artificially made by, for example, spraying paint, abrading or ap-plying an optimized pattern [Bossuyt 2013]. [Pan 2009a, Quinta 2004, Puustinen 2012]
Spray paint is widely used since it is relatively easy to apply while being quite effective. Figure 5.2 shows a comparison between a cut surface and one with a layer of white paint with black speckles. Size distribution of the speckles is important since too large speckles can reduce spatial resolution considerably, and the digitized image cannot re-solve too small features. Randomized paint always leaves the possibility of there being large featureless areas without any information or features that are too small. Computer generated patterns optimized for DIC resolve this. [Helfrick 2008, Lawson 2011, Puustinen 2012]
Figure 5.2. Pattern before and after painting. [LaVision 2011]
In addition to having a gray intensity distribution, the specimen surface has to be flat and remain in the same plane parallel to the CCD sensor target during loading. Out-of-plane motion of the specimen leads to a change in magnification of the recorded images which yields additional in-plane displacements. This can be alleviated by using a tele-centric imaging system or placing the camera far from the specimen. [Pan 2009a, Sutton 2000]
5.3 Image Analysis
Two key assumptions are made when converting images into experimental measure-ments of specimen displacemeasure-ments and strains. Firstly, it is assumed that there is a direct correlation between the motion of points in the image and motion of points in the ob-ject. When this applies, continuum concepts are applicable to describe the relationship between points in an image subset as the object deforms. Secondly, it is assumed that each sub-region has sufficient contrast so that accurate matching can be performed. [Doyle 2008, Puustinen 2012]
DIC is based on optical correlation which is a strain-mapping technique that allows full-field strain mapping by comparing the images of the same region before and after de-formation. Instead of mapping strain directly, displacements are mapped and strains are then calculated from the measured displacements. [Quinta 2004, Puustinen 2012, Pan 2009a]
Usually, there are numerous pixels with the same intensity so a pixel region is used in-stead [Sutton 2009]. The DIC software tries to match these sub-regions from the same area from two different images. If the sub-regions from two images of the same object correlate, it is likely that those regions in the image correspond to the same sub-region on the object (Figure 5.3) [Helfrick 2008]. [Quinta 2004, Puustinen 2012, Pan 2009a]
Figure 5.3. Image correlation. [Peters 1982]
Digital images store the pattern distribution of light and dark features in the image. This can be represented by the gray-scale intensity distribution. The distribution in light in-tensity at a particular point can be described by a gray-scale matrix over a selected sub-region of the image. After the deformation of the surface, each point is assumed to exist at a new location. The surface displacement can be determined by finding the position of the light intensity distribution that resembles the original matrix most closely. [Zhang 2004, Puustinen 2012]
5.4 Error Sources
The measurement accuracy of 2D DIC relies heavily on the quality of the loading sys-tem, the perfection of the imaging system and the selection of a particular correlation algorithm. The errors related to various factors are given in Table 5.1. [Haddadi 2008, Pan 2009a]
Table 5.1. Error sources in DIC. [Pan 2009a]
The high contrast pattern must follow the deformations of the sample. DIC can only analyze the surface so the deformation of the surface should characterize the defor-mation of the sample. This does not apply to cracks and other discontinuities. Mechani-cal testing can also change the surface significantly, and an artificially applied pattern can delaminate or crack resulting in loss of correspondence between the motion of the image and the motion of the object. If the images are too different, the image correlation will fail. [LaVision 2011, Doyle 2008, Quinta 2004, Pan 2009a, Puustinen 2012]
5.5 Applications
2D DIC has numerous applications which can be divided into three main categories. Firstly, 2D DIC can be used to quantitatively determine the deformation field and char-acterize the deformation mechanism of various materials [Bastawros 2000, Chevalier 2001, Abanto-Bueno 2002, Perie 2002, Chiang 2008] (e.g. metal, composite, polymer, wood, biological materials) subjected to mechanical, thermal or other loading. Second-ly, various mechanical parameters of a material including Young’s modulus, Poisson’s ratio [Cho 2005], stress intensity factor [Roux 2006], residual stress [Sabate 2006] and thermal expansion coefficient [Pan 2009b] can be calculated using inverse methods. The third category is using the computed deformation fields to validate FEM [Avril 2008] or theoretical analysis [Sabate 2006]. [Pan 2009a]
In addition to materials science, DIC is commonly used for example in biomedical and vibration measurement. When testing biological tissues, the benefit of non-contact be-comes apparent, and with high-speed cameras, vibrations can be measured. [Puustinen 2012]
DIC can be performed in conjunction with an optical microscope, laser scanning confo-cal microscope, scanning electron microscope, atomic force microscopy or scanning tunneling microscope to achieve micro- and nano-scale deformation measurements. [Puustinen 2012, Pan 2009a]
6 Experimental
6.1 Base Material
All copper used in the experiments was Cu-OFP, which is electrolytically refined oxy-gen-free phosphorous-doped copper (Table 6.1). Notably there are less than 40 ppm impurities, less than 10 ppm oxygen and an addition of about 50 ppm phosphorous. Plates used for welds with defects were in hot-rolled condition and provided by Posiva Oy. [Savolainen 2012]
Table 6.1. Chemical composition of Cu-OFP used as base material. [Savolainen 2012]
6.2 Welding Trials
6.2.1 FSW Mock-up
Full-size FSW mock-up welds made by SKB in their Canister Laboratory at Os-karshamn were studied. Figure 6.1 illustrates the geometry and location of the weld in the canister.
Figure 6.1. Location of FSW weld in the canister.
The tool has a probe with a triflute and a CS4 shoulder and is made of Nimonic 105. Figure 6.2 shows the geometry of the tool and its chemical composition is in Table 6.2.
Figure 6.2. Geometry of the tool used in mock-up welds. [Cederqvist 2011]
Figure 6.2. Chemical composition of Nimonic 105 used in the FSW tool. [Special Metals]
6.2.2 EBW Mock-up
The EB mock-up welds were made by Posiva Oy. Figure 6.3 illustrates the location of the weld and tensile specimens in the canister.
6.2.3 Friction Stir Welds with Defects
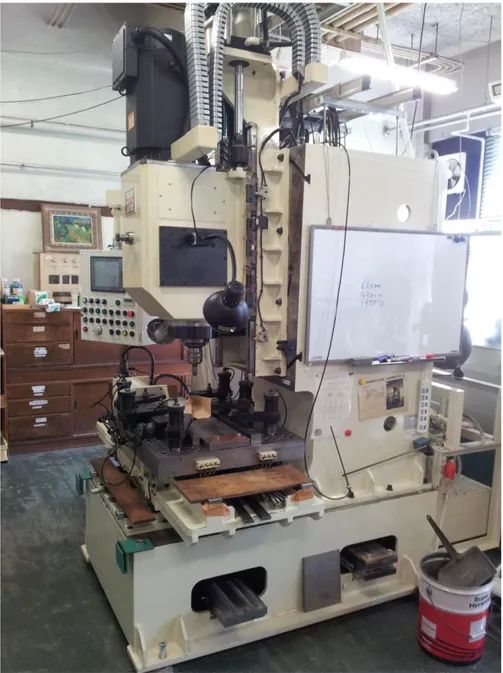
To study the effect of weld defects in friction stir welded copper, butt welds with de-fects were made at Tohoku University and Hitachi. The FSW machine at Tohoku Uni-versity is shown in Figure 6.4 and the tools in Figures 6.5 and 6.6. Tool material used in both is a proprietary precipitation-hardened Co-Al-W alloy of Hitachi [Miyake 2013].
Figure 6.4. Nitto Seiki numerically controlled FSW machine with hydraulic clamping and steel backing plate.
Figure 6.5. A photograph and the technical drawing of the tool used at Tohoku Univer-sity. [Savolainen 2012]
Figure 6.6. A photograph and the technical drawing of the tool used by Hitachi. [Hira-no 2012]
In the Tohoku University welds, rotation speed was 1300 RPM, traverse speed 200 mm/min, tilt angle 2° and plunge depth 5.7 mm. Tool probe length is 5.5 mm. Weld distance was 110 mm on 150x110x10 mm plates (Figure 6.7).
In the Hitachi made welds, rotation speed was 1000 RPM, traverse speed 100 mm/min, tilt angle 2° and plunge depth 9.1 mm. Weld distance was 250 mm on 300x100x10 mm plates (Figure 6.8). [Hirano 2012]
Both 1- and 2-sided welds were made. The 1-sided weld has a lack of penetration defect which leaves a sharp crack on the bottom of the weld (Figure 6.9). It was made without shielding gas or oxide removal. The 2-sided weld without shielding gas and oxide re-moval has a wormhole defect (Figure 6.10). The 2-sided weld with shielding gas and oxide removal has no defects. The 2nd sides of both 2-sided welds were made by turning over the work piece so that the weld direction stays the same on both passes. Only the largest pieces of flash were removed before welding the 2nd side which left the work piece slightly distorted as can be seen in Figure 6.10. The etching also distinguishes base material from the stir zone by grain size.
Figure 6.8. 1-sided FSW weld made by Hitachi without lack of penetration. [Hirano 2012]
Figure 6.9. 1-sided FSW-weld with lack of penetration. Hardness measurement indents are also visible.
Figure 6.10. 2-sided FSW weld with a wormhole defect on the advancing side. Welding direction is towards the page.
6.2.4 Electron Beam Welds with Defects
An EB weld with various weld defects made by Posiva Oy was used for studying the effect of weld defects on mechanical properties. 6 slices in total with dimensions of 120x65x5 mm were cut from the block in Figure 7.11 from 3 different locations. One sample from each location was tensile tested. Each slice had unique defects which were characterized by ultrasonic testing at VTT. One of the samples had a defect at the top of the weld, one had a defect in the root and one without any indications for reference. There were both surface breaking and volumetric defects. [Leskelä 2013]
Figure 6.11. EB weld with defects from which the specimens were cut.
Figure 6.12, 6.13 and 6.14 show the samples for investigating EB weld defects and their surface breaking flaws. Both sides were photographed and one of them etched with con-centrated nitric acid to show the location and shape of the EB weld. Etched side is marked as A and the other one as B. The top of the weld is at the bottom of the picture. Figure 6.15 shows the coordinate system for the indications which are tabulated in Ta-bles 6.3 to 6.6. The weld center is approximately at y = 60 mm. [Leskelä 2013]
Figure 6.12. Sample 75-80 and the surface breaking defects on it. [Leskelä 2013]
Figure 6.13. Sample 260-265 had no surface breaking defects. [Leskelä 2013]
Figure 6.14. Sample 405-410 with the surface breaking defect on side A. [Leskelä 2013]
Table 6.3. Indications from side A with 10 MHz probe. [Leskelä 2013]
Table 6.4. Indications from side B with 10 MHz probe. [Leskelä 2013]
Table 6.5. Indications from side A with 15 MHz probe. [Leskelä 2013]
Table 6.6. Indications from side B with 15 MHz probe. [Leskelä 2013]
6.3 Tensile Tests with Digital Image Correlation
Tensile tests were performed with optical strain measurement through digital image correlation (DIC) to determine deformation localization. A strain gauge was also used. The tensile test machine Zwick/Roell Z020 and LaVision StrainMaster Digital Image Correlation system were used. Table 6.7 shows the test matrix for the tensile tests. First group of specimens corresponds to the mockup welds and their base materials: L for lid and T for tube. Three specimens in the middle are EB welds with defects and the last ones are FSW welds with defects. “Clean” means the use of shielding gas and oxide removal.
Table 6.7. Test matrix for tensile tests. Specimen Strain rate [1/s] Defect
EB-1 10-5 EB-2 4,17*10-7 EB-T1 10-5 EB-L1 10-5 FSW-1 10-5 FSW-2 4,17*10-7 FSW-L1 10-5 FSW-L2 4,17*10-7 75-80 4,17*10-7 Yes 260-265 4,17*10-7 405-410 4,17*10-7 Yes 2-sided 10-5 Yes 2-sided 2 4,17*10-7 Yes 2-sided clean 10-5 2-sided clean 2 4,17*10-7 1-sided 1 10-5 Yes 1-sided 2 4,17*10-7 Yes Hitachi 1 10-5 Hitachi 2 4,17*10-7
Figure 6.16 shows the geometry of the tensile test specimens for FSW mock-ups, EB welds and base materials. Figures 6.5 and 6.7 show the locations of the specimens on the canister. Specimens were cut with EDM and the surface produced by it was used for DIC. Specimens 75-80 and 260-265 were thinned from the 5 mm thick plates to 3.5 mm. Figures 6.17-6.19 show the tensile specimens of EB welds with defects and their DIC surfaces.
Figure 6.16. Technical drawing of the specimen geometry used for mock-up welds and base materials. Thickness is 3.5 mm except for 405-410 it is 5 mm.
Figure 6.18. Specimen 260-265. Weld top is at the bottom of the picture.
Figure 6.19. Specimen 405-410. Weld top is at the bottom of the picture. Etching has revealed the weld.
Figures 6.20 and 6.21 show the geometry, location and surface quality of the FSW-welded tensile test specimens with defects. Surfaces were machined to remove any pos-sible deformation localization sites due to geometric discontinuities from flash. The surfaces on the sides with the defect were left as is after EDM.
Figure 6.20. Technical drawing of the specimen geometry used for defected FSW welds. Thickness is 9.2 mm.
Figure 6.21. Geometry, location and surface finish of the tensile test specimen for FSW welds with defects. 2-sided clean specimen shown.
Two cameras were used for the FSW welds with defects since the defects were on the side of the specimen and a column of the tensile test machine was on the line of sight. Setup is shown in Figure 6.22. For all other specimens only one camera was used direct-ly in front.
7 Results
7.1 Tensile Tests
The results reported in this chapter are averages of comparable test specimens because there are differences in geometry, surface quality, strain rate, weld integrity and usable recorded parameters.
The effect of strain rate is investigated to determine a possible trend as the strain rate decreases. Table 7.1 shows the results of the tensile tests and Table 7.2 shows how the average tensile values change from a strain rate of 10-5 to 4,17*10-7 1/s. All tensile val-ues are lower for the lower strain rate. For the 40 mm gauge length specimens, 10-5 1/s strain rate leads to a test time of about one day. A test with a strain rate of 4,17*10-7 1/s lasts about two weeks. Nominal uniform strain is calculated from data from grip-to-grip separation given by the tensile test machine. Uniform strain is given by an extensometer and elongation calculated through DIC. In some cases, the extensometer was removed prior to reaching the ultimate stress, so the rest of the data points were extrapolated if the ultimate stress was within 1 % of strain. Data are composed of mock-up welds of both EB and FSW, 2-sided FSW-welds with and without a wormhole and a 1-sided FSW made by Hitachi.
Table 7.1. Tensile test results to determine the effect of strain rate. Specimen Strain rate [1/s] Tensile strength [MPa] Nominal uniform strain [%] Uniform strain [%] Elongation (DIC) [%] EB-1 10^-5 161 40,10 % 23,10 % 24,30 % EB-2 4,17*10^-7 156 37,00 % 22,20 % 24,10 % FSW-1 10^-5 195 70,20 % 37,20 % 51,10 % FSW-2 4,17*10^-7 193 69,20 % 39,90 % 49,30 % 2-sided 10^-5 173 32,20 % 18,10 % 2-sided 2 4,17*10^-7 164 28,30 % 15,90 % 2-sided clean 10^-5 192 50,00 % 29,60 % 44,10 % 2-sided clean 2 4,17*10^-7 180 48,20 % Hitachi 1 10^-5 190 58,30 % 41,00 % Hitachi 2 4,17*10^-7 182 55,00 % 39,20 %
Table 7.2. The effect of lower strain rate to tensile properties. Tensile strength
[MPa]
Nominal uniform strain [%] Uniform strain [%] Elongation (DIC) [%] Absolute -7,2 -2,6 % -1,4 % -1,0 % Relative -4,0 % -6,1 % -4,1 % -2,2 %
Table 7.3 shows a comparison between tensile properties of FSW and EB mock-up welds. The absolute and relative differences represent how much higher the values are for FSW.
Table 7.3. Tensile properties of FSW and EB-welds and their difference. Tensile strength
[MPa]
Nominal uniform strain [%] Uniform strain [%] Elongation (DIC) [%] EB 159 39 % 23 % 24 % FSW 194 70 % 39 % 50 % Absolute 36 31 % 16 % 26 % Relative 22 % 81 % 70 % 107 %
The effect of defects on tensile properties is examined by comparing successful welds to defected ones. Figure 6.17 shows the specimen 75-80 and its surface breaking defects. According to Tables 6.3-6.6, the size of the area of indications is about 19*7*2 mm in X, Y and Z coordinates, respectively. Dimensions were averaged from all four meas-urements. Table 7.4 shows the tensile test results from EB-2 mock-up which is the best reference for a successful weld and the defected 75-80 sample. The values are almost identical.
Table 7.4. Tensile properties of the mock-up EB-weld and one with defects. Strain rate 4,17*10-71/s.
Tensile strength [MPa]
Nominal uniform strain [%] Uniform strain [%] Elongation (DIC) [%] EB-2 156 37 % 22 % 24 % 75-80 156 38 % 23 % 25 %
For the FSW-welds, there are two different types of defects: lack of penetration (LoP) (Figure 6.9) and wormhole (Figure 6.10). Table 7.5 shows the tensile test results for FSW specimens with the same geometry. “Hitachi” welds have full penetration with one pass, “2-sided clean” welds are welded from both sides and have no defects, “1-sided” welds have a 4 mm lack of penetration defect and “2-“1-sided” welds are welded from two sides but have a wormhole defect. Upper specimens were tested with a strain rate of 10-5 1/s and the lower ones with 4,17*10-7 1/s.
Weld defects in FSW-welds lower all tensile properties significantly. Uniform strain values are lowered by about 15 % by the wormhole. Lack of penetration lowers uniform strain down to about 15 % and tensile strength to less than 120 MPa. Lower strain rate appears to affect all specimens equally negatively reducing uniform strain by a few per-centage points except for the 1-sided welds.
Table 7.5. Effect of weld defects on FSW-welds. Specimen Defect Tensile strength [MPa] Nominal uniform strain
[%] Uniform strain [%] Hitachi 1 190 58 % 41 % 2-sided clean 192 50 % 30 % 1-sided 1 LoP 117 17 % 15 % 2-sided Wormhole 173 32 % 18 % Hitachi 2 182 55 % 39 % 2-sided clean 2 180 48 % 1-sided 2 LoP 116 17 % 15 % 2-sided 2 Wormhole 164 28 % 16 %
7.2 Strain Localization
DIC was used to determine strain localization during tensile tests. Figures 7.1-7.3 show local strains of the base material specimen FSW-L1. The small strain localizations close to the edges are assumed to be caused by the dog bone geometry. Fracture occurs closer to the middle. Around 50 000 seconds, the light blue colored lines of the fracture area pass the red ones in Figure 7.3. Slowly from thereon, the light blue area strains quicker
than the rest. A distinct point in time can be seen in Figure 7.3 before 70 000 seconds when the local strain rate increases in the fracture location but decreases elsewhere. This is also when ultimate tensile stress was reached. Strain localization in the fracture area began to be visible in strain maps at around 74 000 seconds and 40 % average strain (Figure 7.4). At that time, the highest local strain in the sample was 50 % at the fracture area, while the second highest point was at 47 %.
Figure 7.1. Evolution of local strains in time of the base material FSW-L1.
Figure 7.3. Strain localization of the specimen FSW-L1.
The FSW-welded specimen FSW-1 is compared to the base material. Figures 7.5-7.8 show the local strains of the specimen. Again, the fracture area (yellow lines) start to emerge at 50 000 seconds and take a sharp turn at 70 000 seconds when the ultimate tensile stress was reached. Fracture occurs slightly to the side of the middle in the heat affected zone.
Figure 7.5. Evolution of local strains in time of specimen FSW-1.
Figure 7.7. Strain localization of specimen FSW-1.
EB-welded specimen EB-1 is compared to the base material and FSW-weld. Figures 7.9-7.12 show the local strains. Note the different scales in time and strain. Time to fracture and peak strain are almost halved. Strain localization begins immediately as already at 10 000 seconds there are three distinct areas with the green/yellow fracture area showing highest local strain. At 25 000 seconds the yellow fracture area is distin-guished from green. Just before 30 000 seconds the localization accelerates rapidly and at 18 % average strain the highest local strain is 31 %. Ultimate tensile stress was reached at 40 000 seconds. Fracture occurred in the middle of the weld.
Figure 7.9. Evolution of local strains in time of specimen EB-1.
Figure 7.11. Strain localization of specimen EB-1.
Specimen 75-80 has the same geometry as the previous ones but includes defects from EB-welding. Figures 7.13-7.16 show the local strains. The tensile test results were near-ly identical to the EB-weld without defects and DIC shows similar earnear-ly strain localiza-tion. The strain scales are different but in both, the fracture area strains are more than about 20 %. Due to the surface breaking defects, strain localizes immediately around them and continues to increase to higher values than in the specimens fracturing from inside.
Figure 7.13. Evolution of local strains in time of defected EB-weld specimen 75-80.
Figure 7.15. Strain localization of specimen 75-80.
Specimen 260-265 was taken lower in the weld to include the weld root and base mate-rial. This is assumed to have led to the higher strains compared to EB-weld mock-up. Figures 7.17-7.20 show the local strains. NDT showed no indications in the specimen and it is used as a reference to compare to the EB-weld specimen 405-410 which has a root defect. Average strain at the time of fracture was 37 %. Visible localization at 16 % average strain in the fracture area showed 44 % local strain while the second highest local strain was 39 %. The fracture initiated in the middle of the weld on the side farther from the base material.
Figure 7.17. Evolution of local strains in time of EB-weld specimen 260-265.
Figure 7.19. Strain localization of specimen 260-265.
Specimen 405-410 was taken from the root as specimen 260-265, but has a weld defect at the root. Figures 7.21-7.24 show the local strains. According to NDT (Tables 6.3-6.5), the size of the area of defects is 3,3*1,3*0,5 mm. There is also a surface breaking defect right at the root which is shown in Figure 6.14. Specimen 405-410 has an average strain of 33 % at the time of fracture, which is lower than specimen 260-265, which had no defects. The strain localized in the surface breaking defect. Localization time looks similar between the specimens in Figures 7.19 and 7.23. At 18,5 % average strain, the local strain at the fracture area was 45 %, while the second highest peak was at 39 %.
Figure 7.21. Evolution of local strains in time of EB-weld specimen 405-410.
Figure 7.23. Strain localization of specimen 405-410.
Specimen Hitachi-1 is an FSW-weld without defects welded with one pass. Figure 7.25 shows the strain maps at the point of visible localization and fracture. At that point, ten-sile stress has already started to decrease from ultimate tenten-sile strength. The specimen has the highest tensile properties of all specimens with the narrow geometry so it serves as the reference case. Fracture occurred at the HAZ.
Figure 7.25. Strain maps of Hitachi-1 at visible localization and fracture.
The FSW-welded specimen with a wormhole is compared to the Hitachi-1. Figure 7.26 shows the strain maps at visible localization and fracture. It is past the point of ultimate tensile stress in this case as well despite the wormhole. Overall, compared to the speci-men without defects, the wormhole halves the uniform strain and also reduces the time from ultimate tensile stress to fracture from 10 000 to 3000 seconds.
Figure 7.26. Strain maps of FSW-welded specimen with a wormhole defect at visible localization and fracture.
8 Discussion and Conclusions
FSW and EB-welding are the two possibilities for welding the spent nuclear fuel copper canisters in Finland and Sweden. The effect of weld defects on mechanical properties has been ignored and has not been previously studied. To determine the possible detri-mental effects, FSW- and EB-welds with and without defects were studied by tensile tests with two strain rates.
Tensile tests of mock-up welds showed similar results to Savolainen (2012) with the exception that strain rate does have a significant negative effect of about 4 % on tensile properties when strain rate is further decreased. This is in agreement with literature [Holmström 2012] [Andersson-Östling 2009] [Andersson 2005].
The difference in tensile properties between FSW- and EB-welds is confirmed to be in clear favor of FSW. Strain values are almost twice as high for FSW. In the EB-weld specimens, strain localized immediately to the weld. This is supported by previous stud-ies [Savolainen 2012] [Holmström 2012] [Andersson-Östling 2009].
Two different EB-welds with defects were tested and one showed no reduction of ten-sile properties while the other one did. The specimen with reduced tenten-sile properties had a crack-like defect at the root with some volumetric indications. A wormhole defect in an FSW-weld reduced tensile properties significantly. Strain values dropped 40 – 50 %.
It seems that thorough fracture mechanical analysis on allowed weld flaw types and dimensions has not been made because the general assumption has been that any stress concentration will be blunted by the ductile copper and not significantly decrease me-chanical properties. However, according to the present study, the defect type appears to have a significant effect on whether it reduces tensile properties. Due to the geometry of the tensile specimens, direct comparison of indication size to the allowed indication dimensions is difficult, but the defects in the specimens are real and thus plausible.
9 Recommended Further Research
Further research should be conducted to determine allowable weld flaw types and sizes based on reduction of tensile properties instead of only reduction of wall thickness. Var-ious kinds of real weld defects should be studied with controlled specimen geometries. Also, the elevated temperature of the final repository conditions should be included in future test set-ups.
Advanced DIC methods such as optimized surface patterns and statistical algorithms should be utilized to increase resolution and reduce noise in the strain localization stud-ies. This also allows the accurate measurement of strains at the crack tip and crack growth. DIC can provide a more fundamental understanding of the plastic behavior of welds which can be used to improve modelling and predict creep behavior as well.
10 References
Abanto-Bueno, J., Lambros, J. (2002) Investigation of crack growth in functionally graded materials using digital image correlation. Eng. Fract. Mech. 69 1695–711.
Andersson, H. (2005) Tensile testing of friction stir welds of copper at room temperature and at 100 C. Contract research report, Corrosion & Metals Research Institute (KiMab).
Andersson-Östling, H., Sandström, R. (2009) Survey of creep properties of copper in-tended for nuclear waste disposal. SKB report TR-09-32. Swedish Nuclear Fuel and Waste Management Co.
Arbegast, W.J. (2006) Friction stir welding after a decade of development – It’s not just welding anymore. Welding Journal 85 (3) p. 28-35.
Auerkari, P., Rantala, J., Salonen, J., Laukkanen, A., Holmström, S., Kinnunen, T. (2009) Effect of defects on low temperature creep of OFP copper, ECCC Creep Confer-ence, p. 287–297, 21–23 April 2009, Zürich, Switzerland.
Avril, S. et al. (2008) Overview of identification methods of mechanical parameters based on full-field measurements. Exp. Mech. 48 381–402.
Bastawros, A.F., Bart-Smith, H., Evans, A.G. (2000) Experimental analysis of defor-mation mechanisms in a closed-cell aluminum alloy foam. J. Mech. Phys. Solids 48 301–22.
Bossuyt, S. (2013) Optimized patterns for digital image correlation. Imaging methods for novel materials and challenging applications, Volume 3. ISBN 978-1-4614-4234-9.
Bowyer, W. (2004) Creep deformation and fracture processes in OF and OFP copper. SKI report 2005:18.
Cederqvist, L. (2011) Friction stir welding of copper canisters using power and temper-ature control. Doctoral thesis. Lund University, Faculty of Engineering LTH Depart-ment of Design Sciences.
Chevalier, L. et al. (2001) Digital image correlation used to analyze the multiaxial be-havior of rubber-like materials. Eur. J. Mech. A 20 169–87.
Chiang, F.P. (2008) Micro-/nano-speckle method with applications to materials, tissue engineering and heart mechanics. Strain 44 27–39.
Cho, S.W. et al. (2005) Young’s modulus, Poisson’s ratio and failure properties of tet-rahedral amorphous diamond-like carbon for MEMS devices J. Micromech. Microeng. 15 728–35.
Colligan, K.J. and Pickens, J.R. (2005) Friction stir welding of aluminium using a ta-pered shoulder tool. In: Jata, K.V., Mahoney, M.W., Mishra, R.S., and Lienert, T.J. (eds.), Friction stir welding and processing III. Pennsylvania, USA: The Minerals, Met-als & MateriMet-als Society. ISBN 0-87339-584-0.
De Vuyst, T., Magotte, O., Robineau, A., Goussain, J.-J., and D’Alvice, L.D. (2006) Multi-physics simulation of the material flow and temperature field around FSW tool. 6th International Symposium on Friction Stir Welding. Saint-Sauveur, Canada.
Doyle, F. (2008) Springer handbook of experimental solid mechanics. Springer Science and Business Media LLC, New York. ISBN 978-0-387-26883-5.
Fujii, H., Sun, Y., Kato, H., Nakata, K. (2010) Investigation of welding parameter de-pendent microstructure and mechanical properties in friction stir welded pure Ti joints. Mat. Sci. Eng. A527(15), 3386–3391.
Fuller, C.B. (2007) Friction stir tooling: Tool materials and designs. In: Mishra, R.S. and Mahoney, M.W. (eds.) Friction Stir Welding and Processing. Ohio, USA: ASM International. ISBN 0-87170-840-X.
Helfrick, M. (2008) An investigation of 3D digital image correlation for structural health monitoring and vibration measurement. ProQuest, UMI Dissertations Publishing. ISBN 9780549796978.
Hirano, S. (2012) FSW of copper plank. Hitachi Ltd. Hitachi Research Laboratory, En-vironmental materials processing research department report.
Holmström, S., Salonen, J., Kinnunen, T. (2012) Creep properties of EB welded copper ovarpack at 125-175 C. Posiva report WR 2012-03. Posiva Oy.
Kannan, B.M., Dietzel, W., Zeng, R., Zettler, R., dos Santos, J.F. (2007) A study on the SCC susceptibility of friction stir welded AZ31 Mg sheet. Mat. Sci. Eng. A 460–461, 243–250.
King, F., Lilja, C., Pedersen, K., Pitkänen, P., Vähänen, M. (2011). An update of the state-of-the-art report on the corrosion of copper under expected conditions in a deep geologic repository. Posiva report 2011-01, also SKB report TR 2010-67.
Källgren, T. (2010) Investigation and modelling of friction stir welded copper canisters. Doctoral thesis. Royal Institute of Technology, Department of Materials Science and Engineering.
Laakkonen, M. (2013) Residual stress measurement of electron beam welded copper plates using prism hole drilling method. Posiva report WR 2011-96. Posiva Oy.
Lagattu, F. et al. (2004) High strain gradient measurements by using digital image cor-relation technique. Materials Characterization 53 17– 28.
Lavision GmbH. (2011) Product-Manual for DaVis 8.0. Göttingen.
Lawson, S. (2011) Measurement of deformation of rotating blades using digital image correlation. The University of Texas at Austin.
Leskelä, E. (2013) Ultrasonic inspection of EB weld samples of copper. VTT report VTT-R-04353-13.
Miyake, M. (2013) Development of cobalt-based friction stir welding tool for ferrous alloys. Doctoral dissertation. Tohoku University, Graduate School of Engineering.
Meuronen, I., Salonen, T. (2010) Welding of the lid and the bottom of the disposal can-ister. Posiva report 2010-05. Posiva Oy.
Ollonqvist, P. (2007) Microstructural characterization and mechanical properties of electron beam welded thick phosphorous microalloyed oxygen free copper (Cu-OFP). M.Sc. Thesis. Helsinki University of Technology, Department of Mechanical Engineer-ing.
Pan, B. et al. (2009) Two-dimensional digital image correlation for in-plane displace-ment and strain measuredisplace-ment: a review. Measuredisplace-ment Science and Technology, Volume 20, Page 17.
Pan, B., Xie, H.M., Hua, T., Asundi, A. (2009) Measurement of coefficient of thermal expansion of films using digital image correlation method. Polym. Test. 28 75–83.
Perie, J.N. et al. (2002) Analysis of a multiaxial test on a C/C composite by using digital image correlation and a damage model. Exp. Mech. 42 318–28.
Peters, W.H., Ranson, W.F. (1982) Digital imaging techniques in experimental stress analysis. Optical Engineering, Volume 21.
Pitkänen, J. (2010) Inspection of Bottom and Lid Welds for Disposal Canisters. Posiva report 2010-04. Posiva Oy.
Puustinen, O. (2012) Digital image correlation for identification of vibration modes. M.Sc. thesis. Aalto University School of Engineering, Department of Engineering De-sign and Production.
![Table 3.1. Essential and desirable properties of the FSW tool material. [Threadgill 2003]](https://thumb-ap.123doks.com/thumbv2/123dok/1525128.2551778/19.892.178.802.170.558/table-essential-desirable-properties-fsw-tool-material-threadgill.webp)
![Figure 4.1. Stress strain curves of Cu-OFP with different strain rates. [Sandström 2009]](https://thumb-ap.123doks.com/thumbv2/123dok/1525128.2551778/23.892.172.821.242.483/figure-stress-strain-curves-different-strain-rates-sandström.webp)
![Table 6.1. Chemical composition of Cu-OFP used as base material. [Savolainen 2012]](https://thumb-ap.123doks.com/thumbv2/123dok/1525128.2551778/34.892.174.807.448.946/table-chemical-composition-ofp-used-base-material-savolainen.webp)
![Figure 6.2. Chemical composition of Nimonic 105 used in the FSW tool. [Special Metals]](https://thumb-ap.123doks.com/thumbv2/123dok/1525128.2551778/36.892.263.715.494.809/figure-chemical-composition-nimonic-used-fsw-special-metals.webp)
![Figure 6.6. A photograph and the technical drawing of the tool used by Hitachi. [Hira- [Hira-no 2012]](https://thumb-ap.123doks.com/thumbv2/123dok/1525128.2551778/39.892.214.757.672.1100/figure-photograph-technical-drawing-tool-hitachi-hira-hira.webp)