© The Author 2015. Published by Oxford University Press on behalf of the American Association for Public Opinion Research. All rights reserved. For permissions, please e-mail: [email protected]
BIG DATA IN SURVEY RESEARCH
AAPOR TASK FORCE REPORT
LILLI JAPEC Statistics Sweden
FRAUKE KREUTER*
Joint Program in Survey Methodology at the University of Maryland, Univer-sity of Mannheim & Institute for Employment Research, Nuremberg, IAB MARCUS BERG
School of Information at the University of Michigan JULIA LANE
Wagner School and Center for Urban Science and Progress, New York University
CATHY O’NEIL
Data Science Consultant ABE USHER
HumanGeo Group
Lilli Japec is the director of the R&D Department at Statistics Sweden, Stockholm, Sweden. Frauke Kreuter is a professor in the Joint Program in Survey Methodology at the University of Maryland, College Park, MD, USA; professor at the University of Mannheim, Mannheim, Germany; and head of the Statistical Methods Research Department at the Institute for Employment Research (IAB) in Nürnberg, Germany. Marcus Berg is an adjunct lecturer in the Department of Statistics at Stockholm University, Stockholm, Sweden. Paul Biemer is a distinguished fellow at RTI International, Research Triangle Park, NC, USA, and associate director for survey research and director of the certificate pro-gram in survey methodology at the Odum Institute for Research in Social Sciences at the University of North Carolina, Chapel Hill, NC, USA. Paul Decker is president and CEO of Mathematica Policy Research, Princeton, NJ, USA. Cliff Lampe is an associate professor in the School of Information at the University of Michigan, Ann Arbor, MI, USA. Julia Lane is a professor in the Wagner School and Professor of Practice at the Center for Urban Science and Progress, New York University, New York, NY, USA; professor at the Melbourne Institute of Applied Economics and Social Research, University of Melbourne, Melbourne, Australia; professor at the BETA University of Strasbourg, Strasbourg, France; and institute fellow at the American Institutes for Research, Washington, DC, USA. Cathy O’Neil is a data science consultant, New York, NY, USA. Abe Usher is the chief technology officer at the HumanGeo Group, Washington, DC, USA. The authors are grateful for comments, feedback, and editorial help from Eran Ben-Porath, Jason McMillan, and the AAPOR council members. *Address correspondence to Frauke Kreuter, Joint Program in Survey Methodology, 1218 LeFrak Hall, College Park, MD 20742, USA; phone: 301-314-7911; e-mail: [email protected].
doi:10.1093/poq/nfv039
at University of California, San Diego on February 4, 2016
http://poq.oxfordjournals.org/
Abstract Recent years have seen an increase in the amount of statistics describing different phenomena based on “Big Data.” This term includes data characterized not only by their large volume, but also by their variety and velocity, the organic way in which they are created, and the new types of processes needed to analyze them and make inference from them. The change in the nature of the new types of data, their availability, and the way in which they are collected and disseminated is fundamental. This change constitutes a paradigm shift for survey research. There is great potential in Big Data, but there are some fundamental challenges that have to be resolved before its full potential can be realized. This report provides examples of different types of Big Data and their potential for survey research; it also describes the Big Data process, discusses its main challenges, and considers solutions and research needs.
What Is Big Data?
The term “Big Data” is an imprecise description of a rich and complicated set of characteristics, practices, techniques, ethical issues, and outcomes all associated with data.
Big Data originated in the physical sciences, with physics and astronomy early to adopt many of the techniques now called Big Data. Instruments like the Large Hadron Collider and the Square Kilometer Array are massive collectors of exabytes of information, and the ability to collect such massive amounts of data necessitated an increased capacity to manipulate and analyze these data as well.
More recently, large data sources have been mined to enable insights about economic and social systems, which previously relied on methods such as surveys, experiments, and ethnographies to drive conclusions and predictions. Below are some recent examples. Not all of these might immediately match what people have in mind when they think about Big Data; however, all of them share characteristics of Big Data, as presented below.
EXAMPLE 1: ONLINE PRICES
The MIT Billion Prices Projects, PriceStats,1 is an academic initiative using
prices collected daily from hundreds of online retailers around the world to conduct economic research. One statistical product is the estimation of infla-tion in the United States. Changes in inflainfla-tion trends can be observed sooner in PriceStats than in the monthly Consumer Price Index (CPI). Some National Statistical Institutes in Europe are now using Internet robots to collect prices from the web or scanner data from retailers as part of their data collection for the CPI (Norberg, Sammar, and Tongur 2011; ten Bosch and Windmeijer 2014).
1. http://bpp.mit.edu/.
at University of California, San Diego on February 4, 2016
http://poq.oxfordjournals.org/
EXAMPLE 2: TRAFFIC AND INFRASTRUCTURE
Big Data can be used to monitor traffic or to identify infrastructural problems. For example, Statistic Netherlands uses traffic loop detection data to meas-ure traffic intensity (Daas et al. 2013). Each loop counts the number of vehi-cles per minute that pass at that location, and measures speed and length. The City of Boston issued a smartphone application available to anybody, which is designed to automatically detect pavement problems.2 Anyone who
down-loads the mobile app creates data about the smoothness of the ride. According to their website, these data provide the city with real-time information that it uses to fix problems and plan long-term investments.
EXAMPLE 3: SOCIAL MEDIA MESSAGES
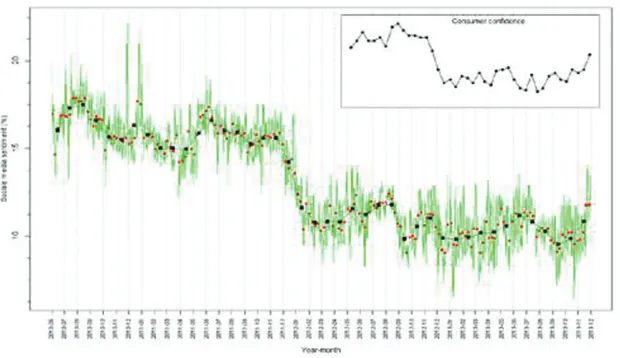
A consumer confidence index is produced every month by Statistics Netherlands using survey data. The index measures households’ sentiments on their financial situation and on the economic climate in general. Daas and Puts (2014) studied social media messages to see if they could be used to measure social media sen-timent. They found that the correlation between social media sentiment (mainly Facebook data) and consumer confidence is very high (see figure 1).
Social media messages (in this case Twitter data) form the basis of the University of Michigan Social Media Job Loss Index,3 with the goal of
gen-erating early predictions of initial claims for unemployment insurance. The predictions are based on a factor analysis of social media messages mention-ing job loss and related outcomes (Antenucci et al. 2014).
CHARACTERISTICS OF BIG DATA
In order to know when and how Big Data can be an appropriate technique for social insight, it is important to know more about the different features of Big Data. While there is no singularly preeminent Big Data definition, one very widely used definition comes from a 2001 Gartner report (Laney 2001, 2012) describing several characteristics of Big Data:
Volume refers to the sheer amount of data available for analysis. This volume of data is driven by the increasing number of data-collection instruments (e.g., social media tools, mobile applications, sensors) as well as the increased ability to store and transfer those data with recent improvements in data storage and networking.
Velocity refers to both the speed at which these data-collection events can occur, and the pressure of managing large streams of real-time data. Across the means of collecting social information, new information is being added to the database at rates ranging from as slow as every hour or so to as fast as thousands of events per second.
2. http://bit.ly/1yrMKHB. 3. http://bit.ly/1meDoas.
at University of California, San Diego on February 4, 2016
http://poq.oxfordjournals.org/
Variety refers to the complexity of formats in which Big Data can exist. Besides structured databases, there are large streams of unstructured docu-ments, images, e-mail messages, video, links between devices, and other forms that create a heterogeneous set of data points. One effect of this com-plexity is that structuring and tying data together becomes a major effort, and therefore a central concern of Big Data analysis.
Others have added additional characteristics to the definition. These include
Variability (inconsistency of the data across time), Veracity (ability to trust that the data are accurate), and Complexity (need to link multiple data sources).
There are many different types of Big Data sources; for example, social media data, personal data (e.g., data from tracking devices), sensor data,
transactional data, and administrative data.
There are different opinions on whether administrative data should be con-sidered to be Big Data or not. Administrative data are usually large in vol-ume; they are generated for a different purpose and arise organically through administrative processes. Also, the content of administrative data is usually not designed by researchers. For these reasons, and because there is great potential in using administrative data, we will consider it to be in scope for this report.
There are a number of differences between administrative data and other types of Big Data that are worth pointing out. The amount of control a researcher has and the potential inferential power vary between different types of Big Data sources. For example, a researcher will likely not have any control of data from different social media platforms, and it could be difficult
Figure 1. Social Media Sentiment (daily, weekly and monthly) in the
Netherlands, June 2010–November 2013. The development of consumer
confidence for the same period is shown in the insert (Daas and Puts 2014).
at University of California, San Diego on February 4, 2016
http://poq.oxfordjournals.org/
to decipher a text from social media. For administrative data, on the other hand, a statistical agency can form a partnership with owners of the data and influence the design of the data. Administrative data are more structured and well defined, and more is known about the data than perhaps other Big Data sources.
BIG DATA AS “FOUND” DATA
A dimension of Big Data not often mentioned in the practitioner literature, but important for survey researchers to consider, is that Big Data are often second-ary data, intended for another primsecond-ary use. This means that Big Data are typi-cally related to some non-research purpose and then reused by researchers to make a social observation. This is related to Sean Taylor’s distinction between “found vs. made” data (Taylor 2013). He argues that a key difference between Big Data approaches and other social science approaches is that the data are not being initially “made” through the intervention of some researcher. When a survey researcher constructs an instrument, there are levels of planning and control that are necessarily absent in the data used in Big Data approaches. Big Data sources might have only a few variables, as compared with surveys that have a set of variables of interest to the researcher. In a 2011 Public Opinion Quarterly article and a blog post in his former role as director of the US Census Bureau, Robert Groves described a similar difference between organic and designed data (Groves 2011a, 2011b).
In the context of public opinion studies, a survey researcher could measure opinion by prompt responses about a topic that may never naturally appear in a Big Data source. On the other hand, the “found” data of social media are “nonreactive,” or “naturally occurring,” so that a data point, devoid of researcher manipulation, may be a more accurate representation of a true opin-ion or behavior. “Found” data may be a behavior, such as a log of steps drawn from networked pedometers or the previously mentioned recordings of travel patterns, which might be more accurate than what could be solicited in sur-veys given known problems with recall error (Tourangeau, Rips, and Rasinski 2000).
While the scale of data often used is what receives prominence, hence the name Big Data, it is actually this “found” nature of the data that is of con-cern to survey researchers. For example, since the data were not created for research, there often are no informed consent policies surrounding their crea-tion, leading to ethical concerns. Additionally, there are statistical concerns with respect to the representative nature of the data. While these are serious concerns covered in more depth later in this report, they are not necessarily fatal to the proposition that Big Data can be used to construct social insights.
Data created through administering the tax systems, social programs, and regulation are also a form of “found” data. They are not created with a spe-cific scientific research question in mind, but rather are the byproduct for the
at University of California, San Diego on February 4, 2016
http://poq.oxfordjournals.org/
respective administrative processes, just as (certain types of) paradata are cre-ated as a byproduct of survey data collections. In many instances, these admin-istrative data are large in volume and share the unstructured nature of many other Big Data sources.
PARADIGM SHIFT
Before considering the usability and use of Big Data, it is worth exploring the paradigm shift happening in the presence of these new data sources. This change in paradigm stems from changes in many factors affecting the meas-urement of human behavior: the nature of the new types of data, their avail-ability, and the way in which they are collected, mixed with other data sources, and disseminated. The consequences of these changes for public opinion research are fundamental in both the analysis that can be done and who the analysts might be. While the statistical community has moved beyond survey and even administrative data to begin understanding how to mine data from social media to capture national sentiment, from cell phone data to understand or even predict anti-government uprisings, and from financial data to examine swings in the economy, it is equally important to note that now some data are freely available and usable to anyone who wishes to mesh data points and series together and produce such analyses. With data readily accessible on the Internet, this creates opportunities for amateur, rather than professional, data analysts.
The change in the nature of the new type of data is transformative. Its characteristics—its velocity, volume, and variety—and the way in which it is collected mean a new analytical paradigm is open to statisticians and social scientists (Hey, Tansley, and Tolle 2009). The classic statistical paradigm was one in which researchers formulated a hypothesis, identified a population frame, designed a survey and a sampling technique, and then analyzed the results (Groves 2011a). The new paradigm means it is now possible to digitally capture, semantically reconcile, aggregate, and correlate data. These correla-tions might be effective (Halevy, Norvig, and Pereira 2009; Cukier and Mayer-Schoenberger 2013) or suspect (Couper 2013), but they enable completely new analyses to be undertaken—many of which would not be possible using survey data alone. For example, the new type of analysis might be one that captures rich environmental detail on individuals from sensors, Google Earth, videos, photos, or financial transactions. Alternatively, the analysis might include detailed information on unique and quite small subsets of the popula-tion (from microbiome data, or websearch logs), or the analysis could be on completely new units of analysis, like networks of individuals or businesses, whose connections can be captured only by new types of data (like tweets, cell phone conversations, and administrative records). As Kahneman (2011) points out, the new measurement can change the paradigm in its own right.
at University of California, San Diego on February 4, 2016
http://poq.oxfordjournals.org/
The change in paradigm also means changes in the production of pub-lic opinion research. The changes in the way data are processed and the type of skills needed to process the data are driven, in part, by the cost of converting data to usable information. The production process is very different in a Big Data world relative to a survey world. One of the most obvious Big Data advantages is that electronic data gathering is substan-tially cheaper than surveys. Surveys are inherently expensive, requiring a good deal of labor to collect the data. In contrast, Big Data, by relying on computer software and electronic data gathering, while requiring some upfront and maintenance costs, can be much more cost effective. But while Big Data are relatively cheap to collect, they can be expensive to clean and process, requiring a reallocation of the human capital that previously went into designing and sampling to structuring, linking, and managing the new types of data.
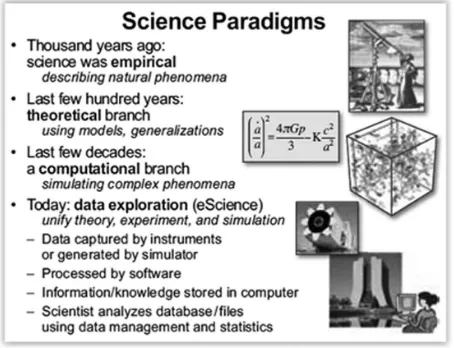
The change in data ownership has also transformed the way in which data are disseminated. The population of potential data analysts—trained and untrained—has dramatically expanded. This expansion can result in tremen-dous new insights, as the Sloan Digital Sky Survey and the Polymath project have shown (Nielsen 2012), and is reflected in Grey’s Fourth Paradigm ( fig-ure 2) (Hey, Tansley, and Tolle 2009), but can also lead to the degradation of the quality of analysis that can be done and issues with the conclusions drawn and reported based on these data. AAPOR as an organization will need to find its place in giving guidance to the proper use of these data with respect to public opinion research.
Finally, the excitement of the change in research paradigm should be tem-pered by a recognition that our existing ways of protecting confidentiality are
Figure 2. Science Paradigms from Hey, Tansley, and Tolle (2009).
at University of California, San Diego on February 4, 2016
http://poq.oxfordjournals.org/
no longer viable (Karr and Reiter 2014). As order and analytical rigor are hopefully brought to the new data frontier, we should ensure that the future structure of data access allows for good science to be attained while protect-ing the confidentiality of the unsuspectprotect-ing contributors to this science. There is a great deal of research that can be used to inform the development of such a structure, but it has been siloed into disconnected research areas, such as statistics, cybersecurity, and cryptography, as well as a variety of different practical applications, including the successful development of remote-access secure data enclaves. We must piece together the knowledge from these vari-ous fields to develop ways in which vast new sets of data on human beings can be collected, integrated, and analyzed while protecting them (Lane et al. 2014). Here, too, AAPOR should extend the role it is currently playing, and involve itself in the discussion.
Why Big Data Matters
Personal data have been hailed as the “new oil” of the 21st century (Greenwood et al. 2014), with profound benefits to policy, society, and public opin-ion research. Detailed data on human beings can be used by policymakers to reduce crime, improve health delivery, and better manage cities (Keller, Koonin, and Shipp 2012). Society can benefit from these data as well. Recent work shows that data-driven businesses were 5 percent more productive and 6 percent more profitable than their competitors (Brynjolfsson, Hitt, and Kim 2011; McAfee and Brynjolfsson 2012). Using data with high volume, velocity, and variety, public opinion researchers can potentially increase the scope of their data-collection efforts while at the same time reducing costs, increasing timeliness, and increasing precision (Murphy et al. 2014).
The value of Big Data to each of these groups (policymakers, businesses, and researchers), and the balancing of the benefits and costs, including the risks of using these new data assets, differs for them because the calculus is different for each group. The Big Data benefits to policymakers have been well and often stated (Lohr 2012; Koonin and Holland 2014). The White House has noted that “Big Data technology stands to improve nearly all the services the public sector delivers” (Executive Office of the President 2014), but the costs of realizing these benefits are nontrivial. As mentioned earlier, even if data collection is cheap, the costs of cleaning, curating, standardizing, integrating, and using the new types of data can be substantial. Oftentimes federal, state, and local agencies do not have the internal capacity to do such analysis (Pardo 2014), and as a consequence they must make the data available either to consultants or to the research community, requiring the development of access protocols and modalities. Indeed, the federal government, many state governments, and some local governments have appointed Chief Data Officers to spearhead these many activities (Griffin 2008; Pardo 2014).
at University of California, San Diego on February 4, 2016
http://poq.oxfordjournals.org/
There are also substantial risks associated with replacing traditional data-collection methods, one of which is the misallocation of resources. For exam-ple, overreliance on Twitter data in deploying resources in the aftermath of hurricanes can lead to the misallocation of resources toward young, Internet-savvy people with cell phones and away from elderly or impoverished neigh-borhoods (Shelton et al. 2014). But all data-collection approaches suffer from similar risks. Poor survey methodology led the Literary Digest to incorrectly call the 1936 presidential elections (Squire 1988). Inadequate understanding of coverage, incentive, and quality issues, together with the lack of a compari-son group, has hampered the use of administrative records, famously in the case of using administrative records on crime to make inferences about the role of death penalty policy in crime reduction (Donohue and Wolfers 2006;
Levitt and Miles 2006). But, as is the case in traditional data-collection meth-ods, it is also important to document these risks under the new approaches in order to address them. Another risk is the alienation of the people on whom the data are gathered. In some areas, there are no clear rules or guidelines govern-ing privacy in this new world in which public and some private actions gener-ate data that can be harvested (Ohm 2010; Executive Office of the President 2014; Strandburg 2014). Similarly, there are no clear data stewards or custodi-ans who can be entrusted to preserving privacy and confidentiality (Lane and Stodden 2013).
The use of Big Data for research purposes also has substantial benefits to society. Commercial products can be effectively targeted to the right consum-ers, health interventions can be better designed, and taxpayers may pay less for government services (Lohr 2012). Commercial firms also benefit from lower expenses and greater efficiency (Brynjolfsson, Hitt, and Kim 2011; Tambe and Hitt 2012). Challenges include risks that are not well understood and quanti-fied (Barocas and Nissenbaum 2014). Better crime data can help target police resources, but it can also exacerbate racial tensions (Gelman, Fagan, and Kiss 2007). More data on possible terrorists, like the Boston bomber, can aid in quick identification, but can also wrongly identify innocent citizens as terror-ists (Tapia, LaLone, and Kim 2014). As Acquisti has noted:
The mining of personal data can help increase welfare, lower search costs, and reduce economic inefficiencies; at the same time, it can be a source of losses, economic inequalities, and power imbalances between those who hold the data and those whose data is controlled. For instance, a firm may reduce its inventory costs by mining and analyzing the behav-ior of many individual consumers; however, the infrastructure needed to carry out analysis may require substantial investments, and if the anal-ysis is conducted in manners that raise consumers’ privacy concerns, those investments may backfire. Likewise, a consumer may benefit from contributing her data to a vast database of individuals’ preferences (for instance, by sharing music interests with an online vendor, and receiving
at University of California, San Diego on February 4, 2016
http://poq.oxfordjournals.org/
in turn targeted recommendations for new music to listen to); that same consumer, having lost control over that data, may end up suffering from identity theft, price discrimination, or stigma associated with the infor-mation unintended parties can acquire about her. (Acquisti 2014, 98)
The benefits for public opinion researchers are potentially extraordinary. The new type of data collection has been referred to as creating a “fourth paradigm” for science (Hey, Tansley, and Tolle 2009), and the importance of the intersec-tion between social science and computer science represented by Big Data analysis has been recognized by major professional associations (Schenker, Davidian, and Rodriguez 2013). One clear benefit is that it adds to research-ers’ analytical tool kit. In addition to careful hypothesis-driven data collection, the new data have, as Robert Groves (2011a) has pointed out, four common and salient attributes that need to be incorporated into the research mindset: (1) they tend to measure behaviors, not internalized states like attitudes or beliefs; (2) they tend to offer near-real-time records of phenomena, and they are highly granulated temporally; (3) they tend to be lean in number of vari-ables, many merely having some sort of an identifier and one other variable (e.g., a text tweet, a GPS coordinate); and (4) they rarely offer well-defined coverage of a large population (we don’t know who isn’t on Facebook, Twitter, or Google searches). Developing statistical techniques that exploit the richness of the data but preserve inference will be critical (Varian 2014), and so is the combination of data sources.
But most interestingly, the new data can change the way researchers think about behavior. For example, they enable the capturing of information on a subject’s entire environment, offering the potential to understand the effects of complex environmental inputs on human behavior. In addition, some of the Big Data sources enable researchers to study the tails of a distribution in a way not possible with small data (assuming that the data sources do not suffer from self-selection). The tails of the distribution are often the more interesting and hardest to reach parts of the population being studied; consider healthcare costs for small numbers of ill people (Stanton 2006), or economic activity and employment by a small number of firms (Jovanovic 1982; Evans 1987).
The Big Data Process and Data-Quality Challenges
The massive amounts of very high-dimensional and unstructured data in Big Data bring both new opportunities and new challenges to the data analyst. Many of the problems with Big Data are well known, with some highlighted previously. Big Data is often selective, incomplete, and erroneous. New errors can be introduced downstream.
Big Data are typically aggregated from disparate sources at various points in time and integrated to form data sets. These processes involve linking records together, transforming them to form new variables, documenting the actions
at University of California, San Diego on February 4, 2016
http://poq.oxfordjournals.org/
taken, and interpreting the newly created features of the data. These activities also introduce errors that may be variable, creating noise and poor reliability, or systematic, leading to bias and invalidity. Thus, using Big Data in statisti-cally valid ways is increasingly challenging, yet exceedingly important for quality inference.
The core issue confronting Big Data veracity is that these data are not gen-erated from instruments and methods designed to produce valid and reliable data amenable to scientific analysis. Rather, as discussed earlier, these found data are often byproducts, also sometimes called data exhaust, from processes whose primary purposes do not always align with those of data analysts. There is also a risk of mischief; for example, automated systems can be written to generate content. Consequently, Big Data generators often have little or no regard for the quality of the data flowing from their processes. Therefore, it is the responsibility of Big Data analysts to be keenly aware of the data’s many limitations and to take the necessary steps to limit the effects of Big Data error on their results.
A well-known example of the risks of Big Data error is provided by the Google Flu Trends series, which uses Google searches on flu symptoms, rem-edies, and other related keywords to provide “near-real-time” estimates of flu activity in the United States and 24 other countries worldwide. Compared to CDC data, the Google Flu Trends provided remarkably accurate indicators of flu incidence in the United States between 2009 and 2011. However, for the 2012–2013 flu seasons, Google Flu Trends predicted more than double the proportion of doctor visits for flu-like symptoms than the CDC (Butler 2013).
Lazer et al. (2014) cite two causes of this error: Big Data hubris and algorithm dynamics. The former occurs when the Big Data researcher believes that the volume of the data compensates for any of their deficiencies, thus obviating the need for traditional, scientific analytic approaches. As Lazer et al. (2014, 1203) note, Big Data hubris fails to recognize that “quantity of data does not mean that one can ignore foundational issues of measurement and construct validity and reliability.”
Although explanations vary, the fact remains that Google Flu Trends was too high, and by considerable margins for 100 out of 108 weeks starting in July 2012. Lazer et al. (2014) also blame “blue team dynamics,” which occurs when the data-generating engine is modified in such a way that the formerly highly predictive search terms eventually failed to work. For example, when a Google user searched on “fever” or “cough,” Google’s other programs started recommending searches for flu symptoms and treatments—the very search terms the algorithm used to predict flu. Thus, flu-related searches artificially spiked as a result of these changes to the algorithm. In survey research, this is similar to the bias induced by interviewers who suggest to respondents who are coughing that they might have the flu, then ask the same respondents if they think they might have the flu.
at University of California, San Diego on February 4, 2016
http://poq.oxfordjournals.org/
Algorithm dynamic issues are not limited to Google. Platforms such as Twitter and Facebook are also frequently being modified to improve the user experience. A key lesson provided by Google Flu Trends is that successful analyses using Big Data today may fail to produce good results tomorrow. All these platforms change their algorithms more or less frequently, with ambiguous results for any kind of long-term study. Recommendation engines often exacerbate effects in a certain direction, but these effects are hard to tease out. Furthermore, other sources of error may affect Google Flu Trends to an unknown extent. For example, selectivity may be an important issue because the demographics of people with Internet access are quite different from the demographic characteristics related to flu incidence (see, for exam-ple, Thompson, Comanor, and Shay [2006]). This means that the “at risk” population for influenza and the implied population based on Google Internet searches do not correspond. This illustrates just one type of representativeness issue that often plagues Big Data analysis. In general, it is an issue that algo-rithms are not (publicly) measured for accuracy, since they are often propri-etary. Google Flu is special in that it publicly failed. From what we have seen, most models fail privately, and often without anyone at all noticing.
Data deficiencies represent only one set of challenges for the Big Data ana-lyst. Other challenges arise solely as a result of the massive size and dimen-sionality of the data. Fan, Han, and Liu (2014) identify three types of issues they refer to as (1) noise accumulation; (2) spurious correlations; and (3) inci-dental endogeneity. These issues should concern Big Data analysts even if the data could be regarded as error free. Nonsampling errors would only exacer-bate these problems.
To illustrate noise accumulation (1), suppose an analyst is interested in classifying individuals into two categories—C1 and C2—based upon the values of 1,000 features (or variables) in a Big Data set. Suppose further that, unknown to the researcher, the mean value for persons in C1 is 0 on all 1,000 features while persons in C2 have a mean of 3 on the first 10 features and a value of 0 on the other 990 features. A classification rule based upon the first m ≤ 10 features performs quite well, with little classification error. However, as more and more features are included in the rule, classifica-tion error increases because the uninformative features (i.e., the 990 features having no discriminating power) eventually overwhelm the informative sig-nals (i.e., the first 10 features). In the Fan, Han, and Liu (2014) example, when m> 200, the accumulated noise exceeds the signal embedded in the
first 10 features and the classification rule becomes equivalent to a coin-flip classification rule.
High dimensionality can also introduce spurious correlations (2) in that many unrelated features may be highly correlated simply by chance, resulting in false discoveries and erroneous inferences. For example, using simulated populations and relatively small sample sizes, Fan, Han, and Liu (2014) show that with 800 independent features, the analyst has a 50 percent chance of
at University of California, San Diego on February 4, 2016
http://poq.oxfordjournals.org/
observing an absolute correlation that exceeds 0.4. Their results suggest that there are considerable risks of false inference associated with a purely empiri-cal approach to predictive analytics using high-dimensional data.
Finally, (3), a key assumption in regression analysis is that the model covar-iates are uncorrelated with the residual error. Endogeneity refers to a violation of this assumption. For high-dimensional models, this can occur purely by chance—a phenomenon Fan and Liao (2014) call “incidental endogeneity.” Incidental endogeneity leads to the modeling of spurious variation in the out-come variables, resulting in errors in the model selection process and biases in the model predictions. The risks of incidental endogeneity increase as the number of variables in the model selection process grows large. Thus, it is a particularly important concern for Big Data analytics.
Fan, Han, and Liu (2014) as well as a number of other authors (see, for example, Stock and Watson [2002], Fan, Samworth, and Wu [2009], Hall and Miller [2009], Fan and Liao [2014]) suggest robust statistical methods aimed at mitigating the risks of (1)–(3). However, as previously noted, these issues and more are further compounded when nonsampling errors are introduced into the data. Biemer and Trewin (1997) show that nonsampling errors will bias the results of traditional data analysis and inflate the variance of esti-mates in ways that are difficult to evaluated or mitigate in the analysis process. Thus, the massiveness and high dimensionality of Big Data combined with the risks of variable and systematic errors require new, robust approaches to data analysis.
A TOTAL ERROR FRAMEWORK FOR BIG DATA
Dealing with the risks that nonsampling errors introduce in Big Data analysis can be facilitated through a better understanding of the sources and nature of the errors. Such knowledge is gained through in-depth knowledge of the data-generating mechanism, the data-processing infrastructure, and the approaches used to create a specific data set or the estimates derived from it. For survey data, this knowledge is embodied in a “total survey error (TSE)” framework that identifies all the major sources of error contributing to data validity and estimator accuracy (see, for example, Biemer [2010]). The TSE framework also attempts to describe the nature of the error sources and what they may suggest about how the errors could affect inference. The framework parses the total error into bias and variance components which, in turn, may be further subdivided into subcomponents that map the specific types of errors to unique components of the total mean squared error. It should be noted, that while our discussion of issues regarding inference has quantitative analyses in mind, some of the issues discussed here are also of interest to more qualitative uses of Big Data.
For surveys, the TSE framework provides useful insights regarding how the many steps in the data-generating and -preparation processes affect estimation
at University of California, San Diego on February 4, 2016
http://poq.oxfordjournals.org/
and inference and may also suggest methods for either reducing the errors at their source or adjusting for their effects in the final data products to produce inferences of higher quality. We believe that a Total Error framework is needed for Big Data (Biemer 2014). In this section, we offer a skeletal view of the framework for a Total Error approach for Big Data. We suggest an approach closely modeled after the TSE framework since, as we will see, a number of error sources are common to both. However, the Big Data Total Error (BDTE) framework necessarily will include additional error sources that are unique to Big Data and can create substantial biases and uncertainties in Big Data prod-ucts. Like the TSE framework, the BDTE framework will aid in our under-standing the limitations of the data, leading to better-informed analyses and applications of the results. It may also inform a research agenda for reducing the effects of error on Big Data analytics.
A typical survey data set is shown in figure 3 as a matrix consisting of some number of rows and columns. Data sets derived from Big Data may also be represented in this way and, thus, will share many of the same proper-ties. In surveys, the rows may be sample or population elements, the columns may be the characteristics of the row elements, and the cells contain values of the characteristics for each element. The total error for this data set may be expressed by the following heuristic formula:
Total error=Row error+Column error+Cell error.
Row errors may be of three types; namely, omissions, where some population elements are not among the rows, duplications, where some population ele-ments occupy more than one row, and erroneous inclusions, where some rows contain elements or entities that are not part of the population of interest.
For survey sample data sets, omissions include nonsampled elements in the population as well as population members deliberately excluded from the sampling frame. For Big Data, selectivity is a common form of omissions. For example, a data set consisting of persons who conducted a Google search in the past week necessarily excludes persons not satisfying that criterion. Unlike survey sampling, this is a form of nonrandom selectivity. For example, persons who do not have access to the Internet are excluded from the file. This exclusion may be biasing, in that persons with Internet access may have very different demographic characteristics than persons who do not have Internet
Figure 3. A Typical Rectangular Format for Traditional Data Analysis.
at University of California, San Diego on February 4, 2016
http://poq.oxfordjournals.org/
access. This problem is akin to non-coverage in sampling, depending on the population about which the researcher is attempting to estimate.
We can also expect that Big Data sets, such as a data set containing Google searches during the previous week, could have the same person represented many times. People who conducted many searches during that period would be disproportionately represented relative to those who conducted fewer searches. Other erroneous inclusions can occur when the entity conducting a search is not a person but another computer; for instance, via a web-scraping routine.
The most common type of column error is caused by inaccurate or errone-ous labeling of the column data—an example of metadata error. For example, a business register may include a column labeled “number of employees,” defined as the number of persons in the company that received a payroll check in the month preceding. Instead, the column contains the number of persons on the payroll whether they received a check last month or not, including per-sons on leave without pay. Such errors would seem to be quite common in Big Data analysis given the multiple layers of processing required to produce a data set. For example, data generated from a source, such as an individual Tweet, may undergo a number of transformations before it lands in a rectan-gular file such as the one in figure 3. This transformation process can be quite complex; for example, it may involve parsing phrases, identifying words, and classifying them as to subject matter and then further as to positive or negative expressions about the economy. There is considerable risk that the resulting features are either inaccurately defined or misinterpreted by the data analyst.
Finally, cell errors can be of three types: content error, specification error, or missing data. A content error occurs when the value in a cell satisfies the column definition but is still erroneous. For example, value satisfies the defi-nition of “number of employees,” but the value does not agree with the true number of employees for the company. Content errors may be the result of a measurement error, a data-processing error (e.g., keying, coding, editing, etc.), an imputation error, or some other cause. A specification error is just as described for the column error but applied to a cell. For example, the column is correctly defined and labeled; however, a few companies provided values that, although otherwise highly accurate, were nevertheless inconsistent with the required definition. Missing data, as the name implies, is just an empty cell that should be filled. As described in Kreuter and Peng (2014), data sets derived from Big Data are notoriously affected by all three types of cell errors, particularly missing or incomplete data.
EXTENDING THE FRAMEWORK FOR BIG DATA
The traditional TSE framework is quite general in that it can be applied to essentially any data set that conforms to the format in figure 3. However, in most practical situations it is quite limited because it makes no attempt to
at University of California, San Diego on February 4, 2016
http://poq.oxfordjournals.org/
describe the error in the processes that generated the data. In some cases, these processes constitute a “black box” and the best approach is to attempt to evalu-ate the quality of the end product. For survey data, the TSE framework pro-vides a fairly complete description of the error-generating processes for survey data and survey frames (see, for example, Biemer [2010]). In addition, there has been some effort to describe these processes for population registers and administrative data (Wallgren and Wallgren 2007). But at this writing, very little effort has been devoted to enumerating the error sources and the error-generating processes for Big Data. One obstacle in this endeavor is that the processes involved in generating Big Data are as varied as Big Data are them-selves. Nevertheless, some progress can be made by considering the generic steps involved.
In the generate step, data are generated from some source either incidentally or purposively. In the extract/transform/load (ETL) step, all data are brought together under a homogeneous computing environment in three stages. These stages are the extract stage, where data are harvested from their sources, parsed, validated, curated, and stored; the transform stage, where data are translated, coded, recoded, aggregated/disaggregated, and/or edited; and the
load stage, where data are integrated and stored in the data warehouse. In the last step, analyze, data are converted to information through a process involving two stages. The first stage is the filtering (sampling)/reduction stage, where unwanted features and content are deleted; features may be combined to produce new ones; and data elements may be thinned or sampled to be more man-ageable. The second stage is the computation/analysis/visualization stage, where data are analyzed and/or presented for interpretation and information extraction.
Figure 4 graphically depicts the flow of data along these steps. The severity of the errors that arise from these processes will depend on the specific data sources and analytic goals involved. Nevertheless, we can still consider how each stage might create errors in a more generic fashion.
For example, data-generation error is somewhat analogous to errors arising in survey data collection. Like surveys, the generic data-generating process for
Figure 4. Big Data Process Map (graph created by Paul Biemer).
at University of California, San Diego on February 4, 2016
http://poq.oxfordjournals.org/
Big Data can create erroneous and incomplete data. In addition, the data-gen-erating sources may be selective in that the data collected may not represent a well-defined population or one that is representative of a target population of interest. Thus, data-generation errors include low signal/noise ratio, lost sig-nals, incomplete or missing values, non-random, selective sources, and meta-data that are lacking, absent, or erroneous.
ETL processes may be quite similar to various data-processing stages for surveys. These may include creating or enhancing meta-data, record matching, variable coding, editing, data munging (or scrubbing), and data integration (i.e., linking and merging records and files across disparate systems). ETL errors include specification error (including errors in meta-data), matching error, cod-ing error, editcod-ing error, data-mungcod-ing errors, and data-integration errors.
As noted above, the analysis of Big Data introduces risks for noise accu-mulation, spurious correlations, and incidental endogeneity, which may be compounded by sampling and nonsampling errors. Related to the former, data may be filtered, sampled, or otherwise reduced to form more manageable or representative data sets. These processes may involve further transformations of the data. Errors include sampling errors, selectivity errors (or lack of repre-sentativeness), and modeling errors.
Other errors that may be introduced in the computation stage are similar to estimation and modeling error in surveys. These include modeling errors, inadequate or erroneous adjustments for representativeness, improper or erro-neous weighting, and computation and algorithmic errors.
Previously, we mentioned that all data collection suffers from error in the data-generating process. AAPOR is promoting the transparency of these pro-cesses. A similar effort will be very valuable for Big Data–driven research.
What Are the Policy, Technical, and Technology
Challenges, and How Can We Deal with Them?
Public opinion research is entering a new era, one in which traditional survey research may play a less dominant role. The proliferation of new technologies, such as mobile devices and social media platforms, is changing the societal landscape across which public opinion researchers operate. As these technolo-gies expand, so does access to users’ thoughts, feelings, and actions expressed instantaneously, organically, and often publicly across the platforms they use. The ways in which people both access and share information about opinions, attitudes, and behaviors have gone through perhaps a greater transformation in the past decade than in any previous point in history, and this trend appears likely to continue. The ubiquity of social media and the opinions users express on social media provide researchers with new data-collection tools and alter-native sources of qualitative and quantitative information to augment or, in some cases, provide alternatives to more traditional data-collection methods.
at University of California, San Diego on February 4, 2016
http://poq.oxfordjournals.org/
There is great potential for Big Data to generate innovation in public opin-ion research. While traditopin-ional survey research has a very important role, the addition of large-scale observations from numerous sources (e.g., social media, mobile computing devices) promises to bring new opportunities. To realize these potential advances, we must address numerous challenges in a systematic way. This section examines several policy challenges for Big Data (ownership, stewardship, collection authority, privacy protection), technical challenges (multidisciplinary skills required), as well as technology chal-lenges (computing resources required).
POLICY CHALLENGE: DATA OWNERSHIP
Many individuals now produce data that are potentially useful for research as part of their everyday participation in the digital world. There has always been a lack of clarity in legal guidance stemming from a lack of clarity as to who owns the data—whether it is the person who is the subject of the information; the person or organization who collects that data (the data custodian); the per-son who compiles, analyzes, or otherwise adds value to the information; the person who purchases interest in the data; or society at large. The lack of clar-ity is exacerbated because some laws treat data as property and some treat it as information (Cecil and Eden 2003). The new types of data make the ownership rules even more unclear: data are no longer housed in statistical agencies, with well-defined rules of conduct, but are housed in businesses or administrative agencies. In addition, since digital data can be alive forever, ownership could be claimed by yet-to-be-born relatives whose personal privacy could be threat-ened by release of information about blood relations. For the AAPOR com-munity, it will be important to stay informed about emerging rules and to be aware of differences in regulations across countries.
POLICY CHALLENGE: DATA STEWARDSHIP
An eloquent description of statistical confidentiality is “the stewardship of data to be used for statistical purposes” (Duncan, Elliot, and Salazar-Gonzalez 2011). Statistical agencies have been at the forefront of developing that stew-ardship community in a number of ways. First, on-the-job training is provided to statistical agency employees. Second, in the United States, academic pro-grams such as the Joint Program on Survey Methodology, communities such as the Federal Committee on Statistical Methodology, and resources such as the Committee on National Statistics have been largely supported by the fed-eral statistical community. In the past, the focus was almost exclusively on developing methodologies to improve the analytical use of survey data, and to a lesser extent, administrative data. It is important to expand efforts to train scientists in developing an understanding of such issues, such as identifying the relevant population and linkage methodologies. Around the United States,
at University of California, San Diego on February 4, 2016
http://poq.oxfordjournals.org/
several programs are emerging. However, it is important to integrate the train-ing of these skills into the existtrain-ing programs, in particular if the field is movtrain-ing toward data integration from survey and non-survey data.
POLICY CHALLENGE: DATA-COLLECTION AUTHORITY
When statistical agencies were the main collectors of data, they did so under very clear statutory authority with statutory protections. For example, Title 26 (Internal Revenue Service) and Title 13 (Census Bureau) of the US Code provided penalties for breaches of confidentiality, and agencies developed researcher access modalities in accordance with their statutory authorization.
The statutory authorization for the new technology-enabled collection of data is less clear. The Fourth Amendment to the Constitution, for exam-ple, constrains the government’s power to “search” the citizenry’s “persons, houses, papers, and effects.” State privacy torts create liability for “intrusion upon seclusion.” Yet, the generation of Big Data often takes place in the open, or through commercial transactions with a business, and hence is not covered by either of these frameworks. There are major questions as to what is reason-ably private, and what constitutes unwarranted intrusion (Strandburg 2014). Data generated by interacting with professionals, such as lawyers and doctors, or by online consumer transactions, are governed by laws requiring “informed consent” and draw on the Fair Information Practice Principles (FIPP). Despite the FIPP’s explicit application to “data,” they are typically confined to per-sonal information, and do not address the large-scale data-collection issues that arise through location tracking and smart grid data (Strandburg 2014).
POLICY CHALLENGE: PRIVACY AND RE-IDENTIFICATION
The risk of re-identifying individuals in a micro data set is intuitively obvious. Indeed, one way to formally measure the re-identification risk associated with a particular file is to measure the likelihood that a record can be matched to a master file (Winkler 2005). If the data include direct identifiers, like names, Social Security numbers, and establishment ID numbers, the risk is quite high. However, even access to close identifiers, such as physical addresses and IP addresses, can be problematic. Indeed, the Health Insurance Portability and Accountability Act (HIPAA) regulations under the Privacy Rule of 2003 require the removal of 18 different types of identifiers, including other less obvious identifiers such as birthdate, vehicle serial numbers, URLs, and voice prints. However, even seemingly innocuous information makes it relatively straightforward to re-identify individuals, for example by finding a record with sufficient information such that there is only one person in the relevant population with that set of characteristics: the risk of re-identification has been increasing due to the growing public availability of identified data and rapid advances in the technology of linking files (Dwork 2011). With many
at University of California, San Diego on February 4, 2016
http://poq.oxfordjournals.org/
variables, everyone is a population unique. Since Big Data have wide-ranging coverage, one cannot rely on protection from sampling (Karr and Reiter 2014). Indeed, as Ohm (2010) points out, a person with knowledge of an individual’s zip code, birthdate, and sex can re-identify more than 80 percent of Netflix users, yet none of those are typically classified as Personally Identifiable Information (PII).
POLICY CHALLENGE: MEANING OF “REASONABLE MEANS” NOT SUFFICIENTLY DEFINED
The statutory constraint on agencies such as the IRS and the US Census Bureau makes it clear that the agencies, as data producers, should take “rea-sonable means” to protect data, although these rea“rea-sonable means are not defined. Trust clearly depends on people’s views on privacy, but these views are changing rapidly (Nissenbaum 2011). Nissenbaum (2011, 34) also notes that it is increasingly difficult for many people to understand where the old norms end and new ones begin, as “Default constraints on streams of informa-tion from us and about us seem to respond not to social, ethical, and political logic but to the logic of technical possibility: that is, whatever the Net allows.” Yet, there is some evidence that people do not require complete protection, and will gladly share even private information provided that certain social norms are met, similar to what Gerber reported in 2001. There are three factors that affect these norms: actors (the information senders and recipients or provid-ers and usprovid-ers); attributes (especially types of information about the providprovid-ers, including how these might be transformed or linked); and transmission princi-ples (the constraints underlying the information flows).
WHAT WE CAN LEARN FROM CURRENT KNOWLEDGE
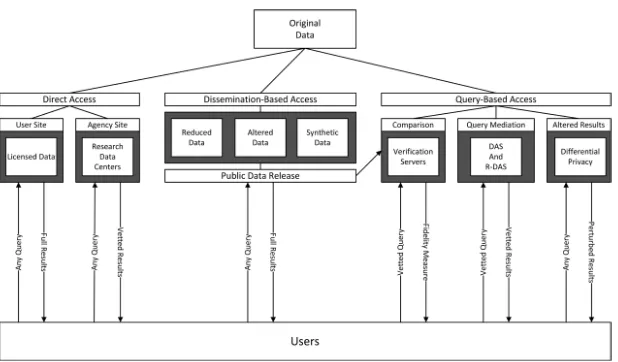
Kinney, Karr, and Gonzalez (2009) identify a variety of mechanisms for inter-action between users and confidential data. As they note, in figure 5 (above), “there are three major forms of interaction: direct access, dissemination-based access (public data releases), and query-dissemination-based access. Direct access imposes the least interference between the users and the confidential data. Dissemination-based access refers to the practice of releasing masked data in public files. In the query-based interaction mode, users cannot directly access individual data records, but are able to submit queries, either electronically or manually” (Kinney, Karr, and Gonzalez 2009, 127). Thorough reviews of different approaches are provided in Duncan, Elliot, and Salazar-Gonzalez (2011) and Prada et al. (2011).
The current statistical disclosure literature offers multiple ways of permit-ting access to microdata, but less relevant guidance about release.
at University of California, San Diego on February 4, 2016
http://poq.oxfordjournals.org/
TECHNICAL CHALLENGE: SKILLS REQUIRED TO INTEGRATE BIG DATA INTO OPINION RESEARCH
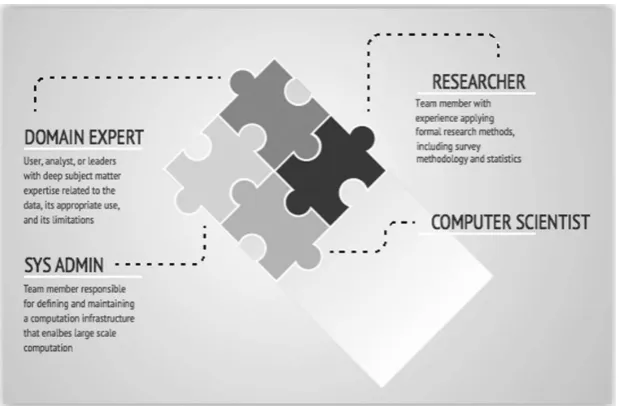
Depending on the scale of the data being discussed, there can be significant challenges in terms of the skills and resources necessary to work with Big Data. In particular, most Big Data problems require a minimum of four roles: a domain expert, a researcher, a computer scientist, and a system administrator (see figure 6). The domain expert is a user, analyst, or leader with deep subject-matter expertise related to the data, their appropriate use, and their limitations. The researcher is a team member with experi-ence applying formal research methods, including survey methodology and statistics. The computer scientist is a technically skilled team member with education in computer programming and data-processing technologies, and the system administrator is a team member responsible for defining and maintaining a computation infrastructure that enables large-scale computa-tion. However, from our experience, many companies are trying to make do with only one person.
Domain expertise is particularly important with new types of data that have been collected without instrumentation, usually for purposes other than quan-titative survey analysis. For example, looking at Big Data from social media sources requires an in-depth understanding of the technical affordances and user behaviors of that social media source. Posting to Twitter, as an example, involves norms and practices that could affect the interpretation of data from that source. This could refer to the use of handles and hashtags, certain termi-nology and acronyms used, or practices such as retweeting, modifying tweets, and favoriting. Additionally, it is important to understand to what degree
Figure 5. Models for User-Data Interaction, from Kinney, Karr, and Gonzalez (2009).
at University of California, San Diego on February 4, 2016
http://poq.oxfordjournals.org/
different forms of new media may underrepresent particular demographics (e.g., there may be a low number of citizens age 60 years and older using Twitter to express themselves).
Foundational research skills such as the application of classical sur-vey methodology and the appropriate use of descriptive statistics remain critical for understanding Big Data. As the volume of digital data grows and the barrier to obtaining such data is continually lowered, there is an increasing risk of untrained engineers and computer programmers finding bogus associations in Big Data. To ensure that Big Data are appropri-ately integrated into public opinion research, there remains an ongoing requirement for classically trained researchers to be involved throughout the entire process.
From the computer science skills standpoint, baseline competencies can include the ability to work in command line environments, some capability with programming languages, facility with databases and database languages, and experience with advanced analytical tools. The larger the data set, the more important skills in databases and analytics become. Some researchers choose to partner with computer scientists, or skilled programmers, to cover these needed skills. While this has led to viable research partnerships, it creates a new need in terms of interdisciplinary collaboration. Major information tech-nology components that are frequently used in the process of collecting, stor-ing, and analyzing Big Data include Apache Hadoop, Apache Spark, Java, and
Python programming language. Apache Hadoop is a system for maintaining a distributed file system that supports the storage of large-scale data (terabytes or petabytes of content), and the parallel processing of algorithms against large data collections. Apache Spark is a fast general-purpose engine for large-scale data processing that works in support of Hadoop or in-memory databases. Java programming language is a general purpose systems engineering language that supports the creation of efficient algorithms for data analysis, and Python programming language is a general-purpose systems engineering language that supports rapid prototyping and efficient algorithms for data analysis. Both Apache Hadoop and Apache Spark require a programming language such as Java or Python.
It is worth noticing that there are many different frameworks. Even though a framework such as, for example, Hadoop is commonly used today, given the fast development in this area, this may very well change soon. It could therefore be helpful to think in more general terms of clusters and parallel processing of unstructured data.
System administrators play an important role in defining, creating, and maintaining computing environments for the storage and analysis of Big Data. Working with Big Data often requires additional computing resources. Depending on the size of the data being considered, resources can range from hardware and server stacks that are manageable by non-specialist IT staff to very large-scale computing environments that include
at University of California, San Diego on February 4, 2016
http://poq.oxfordjournals.org/
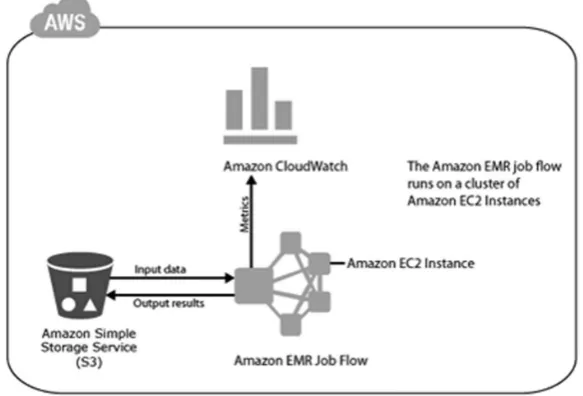
high-powered computing stacks of hardware and software that often require specialist IT training. As an example, many universities offer High Performance Computing Centers (HPC) that include networked servers, structuring software like Hadoop, as well as database and analysis pack-ages. System administrators responsible for maintaining Big Data com-puter platforms often use one of three strategies. For long-term storage of unique or sensitive data, it often makes sense to create and maintain an Apache Hadoop cluster using a series of networked servers within the internal network of an organization. Although expensive in the short term, this internal compute cluster strategy is often the lowest cost in the long term. There is a trend across the IT industry to outsource elements of infra-structure to “utility computing” service providers. Organizations such as the Amazon Web Services (AWS) division of Amazon.com make it sim-ple for system administrators to rent prebuilt Apache Hadoop clusters and data-storage systems (see figure 7). This external compute cluster strategy is very simple to set up, but may be much more expensive than creating a long-standing cluster internally. Functional equivalents to Amazon Elastic Map Reduce Service are Microsoft HDInsight and Rackspace’s Cloud Big Data Platform. Other alternatives include Hadoop on Google’s Cloud Platform and Qubole. A common hybrid compute cluster strategy is to provision external compute cluster resources using services such as AWS for on-demand Big Data analysis tasks, and to create a modest internal computer cluster for long-term data storage.
TECHNOLOGY CHALLENGE: COMPUTATIONAL REQUIREMENTS
The formula “distance = rate x time” is well known by high school math students. This formula may be applied to simplify the understanding of why large-scale parallel processing computer clusters are a requirement for Big Data analysis. In the analysis of a very large data set, the volume of data to be processed may be considered the distance (e.g., 10 terabytes). Similarly, the number of available central processing units and magnetic hard drives for storing the media may be considered directly related to the
rate.
All other factors being held equal, a system with 10 CPUs and 10 hard drives (10 computation units) will process a batch of data 10 times faster than a system with one CPU and one hard drive (1 computation unit). If an imaginary data set consists of 50 million records, and systems with 1 com-putation unit can process 100 records per second, then it will take approxi-mately 5.7 days (50,000,000 records/100 records per second) to finish the analysis of data—potentially an unacceptable amount of time to wait. A system with 10 computation units can compute the same result in just 13.9 hours, a significant time savings. Systems like Apache Hadoop drasti-cally simplify the process of connecting multiple commodity computers
at University of California, San Diego on February 4, 2016
http://poq.oxfordjournals.org/
into a cluster capable of supporting such parallel computations. (For many simple cases, parallel computation is not required—millions of records can often be processed on modern computers using scripting languages like R or Python.)
Although disk space may be relatively inexpensive, the cost of creating and maintaining systems for Big Data analysis can be quite expensive. In the past 30 years, the cost of storing data on magnetic storage media such as hard drives has decreased dramatically. A hard drive with 3 terabytes of storage capacity now costs less than $100 in the United States. However, the total cost of ownership of a Big Data analysis system is the sum of several components, including, at a minimum, the cost of disk-based storage media, cost of active computation components (computer central processing unit or CPU, Random Access Memory or RAM), and cost of infrastructure elements such as server farm rack space, electricity required, cooling costs, and network access and security fees.
When taken in aggregate, these components may cost tens or hundreds of thousands of dollars. It may not be feasible to create a permanent Big Data computer cluster to support a single study. Within AAPOR, there is the pos-sibility to form public-private sector partnerships not only for sharing data but also for sharing analysis infrastructure.
How Can Big Data Be Used to Gain Insights?
The recent literature on developments in Big Data can give the reader the impression that there is an ongoing, head-to-head competition between tra-ditional research based on data specifically designed to support research and new research methods based on more organic data or found data. Researchers who have created a career around the analysis of survey data are particularly anxious about the rise of Big Data, fearful that the skills they have developed throughout their career may become obsolete as Big Data begins to crowd out survey data in supporting future research.
We have seen similar debates on statistical methods. The predominant theory used in surveys emanates from the Neyman-Pearson framework. This theory states that survey samples are generated from a repeatable random pro-cess and governed by underlying parameters that are fixed under this repeat-able process. This view is called the frequentist view and is what most survey researchers are most familiar with. An alternative theory is the Bayesian view that emanates from Bayes, Savage, deFinetti, and others. In this theory, data from a realized sample are considered fixed while the parameters are unknown and described probabilistically. Typically, a prior distribution of the param-eter is combined with the observed data, resulting in a posterior distribution. The discussions of these views have successively moved from controversy to more pragmatic standpoints. A survey statistician’s job is to make the most
at University of California, San Diego on February 4, 2016
http://poq.oxfordjournals.org/
valid inferences about the finite population, and therefore there is room for both views. Both frequentist and Bayesian statistics play key roles in Big Data analysis. For example, when data sets are so large that the analysis must be distributed across multiple machines, Bayesian statistics provides efficient algorithms for combining the results of these analyses (see, for example,
Ibrahim and Chen [2000]; Scott et al. [2013]). Sampling techniques are key in gathering Big Data and for analyzing Big Data in a small computing environ-ment (Leek 2014a, 2014b).
In general, framing the rise of Big Data as a competition with survey data or traditional research is counterproductive, and a preferred route is to recognize how research is enhanced by utilizing all forms of data, including Big Data as well as data that are designed with research in mind. Inevitably, the increased availability of the various forms of Big Data will supplant survey data in some settings. However, both Big Data and survey data have advantages and disadvantages, which we describe in more detail below. An effective and efficient research strategy will be responsive to how these advantages and disadvantages play out in different settings, and deploy-ing blended research methods that maximize the ability to develop rigor-ous evidence for the questions of interest for an appropriate investment of resources.
Research is about answering questions, and the best way to answer ques-tions is to start by utilizing all of the information that is available. The availability of Big Data to support research provides a new way to approach old questions as well as an ability to address some new questions that in the past were out of reach. However, the findings that are generated based on Big Data inevitably generate more questions, and some of those ques-tions tend to be best addressed by traditional survey research. As the avail-ability and use of Big Data increases, there is likely to be a parallel growth in the demand for survey research to address questions raised by findings from Big Data. The availability of Big Data liberates survey research, in the sense that researchers no longer need to generate a new survey to sup-port each new research endeavor. Big Data can be used to generate a steady flow of information about what is happening—for example, how customers behave—while traditional research can focus instead on deeper questions about why we are observing certain trends or deviations from trends—for example, why customers behave as they do and what can be done to change their behavior.
In thinking about how to blend Big Data with traditional research methods, it is important to be clear about the relevant questions to be addressed. Big Data can be especially useful for detecting patterns in data or for establishing correlations between factors. In contrast, establishing causality between vari-ables requires that data be collected according to a specific design in order to support models or research designs intended to isolate causality. Marketing researchers use Big Data for so-called A/B testing to establish causality,
at University of California, San Diego on February 4, 2016
http://poq.oxfordjournals.org/