Prediction of long-term functional outcome in patients with acute
ischemic non-embolic stroke
John Protopsaltis
a, Stelios Kokkoris
a, Panagiotis Korantzopoulos
b,∗, Haralampos J. Milionis
c,
Efthalia Karzi
d, Alexandra Anastasopoulou
e, Kostantina Filioti
a, Stavros Antonopoulos
a,
Andreas Melidonis
f, Grigorios Giannoulis
aaSecond Department of Internal Medicine, ‘Tzanio’ General Hospital of Piraeus, Piraeus, Greece bDepartment of Cardiology, School of Medicine, University of Ioannina, 45110 Ioannina, Greece cDepartment of Internal Medicine, School of Medicine, University of Ioannina, Ioannina, Greece dDepartment of Computed Tomography, ‘Tzanio’ General Hospital of Piraeus, Piraeus, Greece
eDepartment of Neurology, ‘Tzanio’ General Hospital of Piraeus, Piraeus, Greece fDiabetes Center, ‘Tzanio’ General Hospital of Piraeus, Piraeus, Greece Received 5 March 2008; received in revised form 18 May 2008; accepted 26 May 2008
Available online 7 July 2008
Abstract
In a prospective observational study, we assessed the relative value of conventional stroke risk factors and emerging markers in the prediction of functional outcome of patients surviving the acute phase of an ischemic non-embolic stroke. All available eligible patients consecutively admitted due to a first-ever acute ischemic non-embolic stroke during a 2-year period were evaluated. In a total of 105 patients (54 males, 51 diabetic) a series of clinical, biochemical and imaging characteristics were recorded, including demographic data, blood pressure, serum glucose, insulin, lipids, inflammatory markers, intima–media thickness of the carotid arteries (IMT), brain damage location and size of the infarct volume. Barthel Activities of Daily Living Index (BI) scale was used to assess the severity of neurological deficit on admission and the functional outcome 6 months after discharge. Brain infarct volume, stroke location in the anterior circulation, age, diabetes mellitus, IMT and plasma interleukin-1levels proved to be significant determinants of long-term functional outcome, assessed by BI disability score. ROC curve analyses indicated that the infarct volume is superior to other predictors in the diagnosis of patients with unfavorable functional outcome (BI < 95) at 6 months post-discharge (area under the curve, AUC = 0.80, 95% confidence interval 0.64–0.95;p= 0.003). Significant differences in the mean infarct volume were noted among age tertiles, with the diabetic patients in the 3rd tertile of age experiencing the worst outcome (LSD test,p= 0.019). Taken together, the assessment of infarct volume seems to have a significant predictive value regarding long-term functional outcome, especially in the elderly diabetic patients.
© 2008 Elsevier Ireland Ltd. All rights reserved.
Keywords: Ischemic stroke; Functional outcome; Infarct volume; Predictor
1. Introduction
Ischemic stroke is characterized by a great variation in terms of clinical outcome. Epidemiological evidence suggests several risk factors for ischemic stroke, includ-ing hypertension, tobacco smokinclud-ing, diabetes mellitus, atrial fibrillation, while novel markers have been implicated as
pre-∗Corresponding author. Tel.: +30 26510 99347; fax: +30 26510 97017.
E-mail address:[email protected](P. Korantzopoulos).
dictors of acute brain ischemia[1]. The relationships of either ‘conventional’ or ‘emerging’ risk factors with the functional outcome remains to be established[2].
There is evidence that inflammation plays an important role in the pathophysiology of ischemic stroke and markers of inflammation, such as C-reactive protein (CRP) and cytokine levels (interleukin, IL-1and IL-6) may well serve as prog-nostic factors for neurological worsening in stroke patients
[3,4]. In this setting, several imaging modalities, including computed tomography (CT) scan, and common carotid artery
intima–media thickness (CCA-IMT) have also been tested as predictors of functional outcome[5,6]. Finally, the stroke subtype, namely embolic strokes in patients with a known car-diac source, has been associated with a poor overall prognosis
[7].
The evaluation of clinical, biochemical and imaging mark-ers that may correlate with the functional recovery and long-term prognosis could prove useful in the early and post-discharge management of subjects suffering an acute ischemic stroke. In the present study, we prospectively inves-tigated the relative value of conventional stroke risk factors and emerging markers in the prediction of functional out-come of patients surviving the acute phase of an ischemic non-embolic stroke.
2. Subjects and methods
2.1. Study design
All available eligible subjects with a first-ever acute ischemic non-embolic stroke consecutively admitted to the Departments of Internal medicine and Neurology of ‘Tzanio’ General Hospital from February 2004 to January 2006 were prospectively studied.
Patients were classified as having a definite new stroke if evidence of sudden onset’s neurological symptoms (aphasia, dysarthria, diplopia or hemiparesis) lasted >24 h. Subjects with a history of vascular disease (previous stroke, carotid surgery, angina, myocardial infarction, revascularizations, and peripheral artery disease), active infections, neoplasias, acute or chronic inflammatory conditions were excluded from the study.
A brain CT scan was performed within 24 h of admis-sion to exclude patients with intra-cerebral hemorrhage. A second brain CT scan was performed on the 7th day after admission in order to compute cerebral infarct volume. Infarct volume was measured in cubic centimeters according to the formula: 0.5×A×B×C, whereAandBrepresent the greatest perpendicular diameters andCrepresents the num-ber of sections of 10 mm where the cerebral infarct was apparent.
To increase the accuracy of prediction model, we restricted our patient selection to more homogeneous groups in terms of stroke subtype, excluding patients with cardioembolic stroke, given that these strokes have a worse prognosis. Participants were assessed for a definite cardiac source of embolism, including those with atrial fibrillation or flutter, bacterial or marantic endocarditis, recent myocardial infarction, valvu-lar heart disease, atrial myxoma, intracardiac thrombus, and cardiomyopathy. All subjects underwent transthoracic echocardiography, and in selective cases transoesophangeal echocardiography and/or brain magnetic resonance imaging (MRI). Brain MRI was performed within 6 h of onset, only when clinical and CT findings were highly suggestive of intra-cerebral hemorrhage.
The sudden onset of focal neurological deficit was also taken into consideration. Patients who died within the first 6 months after stroke onset were also excluded from the study as patients with a transient ischemic attack (i.e. neurological deficit lasting <24 h with no infarct found on brain imag-ing) or with no evidence of cerebral infarction in the CT scan. Patients who developed signs of infection during their hospitalization were excluded from the study.
The following variables were determined at baseline as potential predictors of stroke outcome: age; sex; body mass index (calculated as weight to height squared); smoking status (determined by questionnaire); blood pressure (BP, measured by standard mercury sphygmomanometer after 5 min in the supine position and calculated as the average of three read-ings; the highest value during the first 24 h was used in the statistical analysis); prevalent diabetes mellitus (defined as history of diabetes, fasting glucose plasma concentrations ≥126 mg/dL, or current treatment with antidiabetic drugs and/or insulin); fasting triglycerides (TG), total cholesterol, HDL-cholesterol (determined by enzymatic techniques), and LDL-cholesterol levels (calculated using Friedewald’s
for-mula for those with serum TG levels≤400 mg/dL); presence
of the metabolic syndrome (MetS) based on the National Heart, Lung, and Blood Institute and the American Heart Association (NHLBI/AHA) criteria: 3 or more of the fol-lowing criteria: abdominal obesity [waist circumference >102 cm in men and >88 cm in women), high TG levels (≥150 mg/dL), low HDL-cholesterol levels (<40 mg/dL in men and <50 mg/dL women), fasting blood glucose level
≥100 mg/dL), and high BP (i.e.≥130/85 mmHg, reported
history of hypertension or treated hypertension).
Barthel Activities of Daily Living Index (BI) scale was used to assess both the severity of neurological deficit on admission and the functional outcome 6 months after dis-charge[8]. A value of BI > 95 predicts an excellent outcome with full recovery and coincides with that of the modified Raskin Score 1[9]. Six-month outcome measurements of all surviving patients were performed at the outpatient clinic of our institution by investigators blinded to the patients’ CT results, who were trained to perform the measurements accurately and consistently.
Stroke outcome of patients with insulin resistance (IR) was compared with that of patients who were sensitive. IR was assessed by using the homeostasis model assess-ment (HOMA-IR). HOMA-IR was calculated by the formula:
fasting serum insulin (U/mL)×fasting plasma glucose
(mmol/L)/22.5.
100 mg/day or clopidogrel 75 mg/day, for patients intolerant to aspirin because of a history of allergy or gastrointestinal side effects). After discharge home, family general practi-tioners assumed healthcare tasks, including persistence of use of the preventive medication after stroke and achieve-ment of treatachieve-ment goals, in collaboration with the Outpatient Neurology Clinic of our hospital.
2.2. Imaging studies
Carotid ultrasound was performed with a commercially available color Doppler scanner (Phillips iU-22, Bothell, USA), using a linear array transducer (3–9 MHz) with a scan-ning frequency of 9 MHz in B-mode. Each carotid system was imaged with the patient in the supine position having the neck extended and the head turned slightly away from the site being examined. CCA, internal carotid artery (ICA), external carotid artery (ECA), and vertebral arteries were examined in transverse and longitudinal planes. The spec-tral Doppler waveform of these arteries was recorded and examined. Plaques were identified and plaque morphology has been classified according to the degree of reflectivity (high/intermediate/low category), to homogeneity or hetero-geneity.
IMT measurements were also recorded. IMT is the com-bined thickness of the intimal and medial layers of the common carotid artery and/or internal carotid artery and is defined as the distance between the interface of the lumen and intima to the interface between the media and the adven-titia. We analyzed IMT by determining its mean thickness, over a defined length of vessel in CCA, through bifurca-tion and in ICA, where maximal IMT measurements were obtained. For that reason, precise mean measurements were obtained by sophisticated software assisting analysis of lines drawn by automated edge-detectors. We considered that the range of mean IMT measurements in normal adult individuals fluctuates between 0.6 mm and 1 mm. Our database and sub-sequent analysis also included maximal IMT measurements over the predefined parts of vessels in CCA, bifurcation, and ICA.
Given that, besides stroke volume, stroke location is important for the outcome prediction, all the participants were clinically classified into 4 categories according to the
Oxford-shire Community Stroke Project Criteria (OCSP) [11], as
total anterior circulation infarct (TACI), partial anterior cir-culation infarct (PACI), posterior circir-culation infarct (POCI), and lacunar infarct (LI).
2.3. Laboratory determinations
After overnight fasting, peripheral venous blood samples were drawn from an antecubital vein and transferred to tubes
containing Na2EDTA (1.5 mg/mL). Then, the plasma was
separated by centrifugation (1500×gfor 20 min) at 4◦C and stored at−80◦C until laboratory analysis.
All biochemical analyses were performed by com-mercially available standardized methods using standard analytical techniques. Inflammatory markers (i.e. IL-1and IL-6) were measured with quantitative sandwich ELISA kits (BenderMedSystems, Vienna, Austria). Detection lim-its were the following: IL-1 < 1 pg/mL and IL-6 < 0.8 pg/mL. Measurement of serum level CRP was determined by a high sensitivity ELISA kit.
All surviving patients at discharge received the appropri-ate secondary prevention therapies. The study was approved by the Local Research Ethics Committee. Written informed consent was obtained from all participants, or written assent from a first-degree relative.
2.4. Statistical analysis
The normal distribution of each variable was tested by Kolmogorov–Smirnov’s test. Continuous variables are presented as mean (S.D.) (normally distributed parameters) or median [range] (non-normally distributed parameters), and discrete variables as percentages. Categorical variables were compared using Chi-square test, while continuous variables were analyzed using two-tailed Student’s test or
Mann–Whitney U test, in case the distribution was not
normal.
Patients were categorized into tertiles according to their age. Two-way ANOVA was used in order to analyze the simultaneous effects of 2 independent factors (age tertile, DM) on a dependent variable (infarct volume). Multiple linear regression analyses were performed in order to inves-tigate the effect of various factors on infarct volume and BI (6 months), respectively. Possible associated factors were selected according to their significance (p< 0.10) in uni-variate analyses. Accuracy of predicting patients with BI (6 months) <95 was analyzed using receiver-operating charac-teristic (ROC) curve. (A ROC curve is a graph of sensitivity versus 1−specificity for various cut-off points of a posi-tive diagnostic test result, herein infarct volume.) Statistical analysis was performed using SPSS, version 13.0, software (SPSS Inc., Ill., USA). Ap-value below 0.05 was considered statistically significant.
3. Results
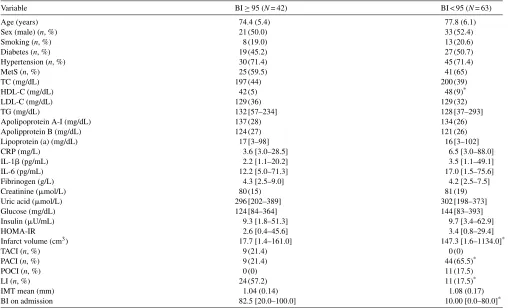
Table 1
Baseline clinical and laboratory characteristics in the study population according to the Barthel Index (BI) at 6 months after stroke onset
Variable BI≥95 (N= 42) BI < 95 (N= 63)
Age (years) 74.4 (5.4) 77.8 (6.1)
Sex (male) (n, %) 21 (50.0) 33 (52.4)
Smoking (n, %) 8 (19.0) 13 (20.6)
Diabetes (n, %) 19 (45.2) 27 (50.7)
Hypertension (n, %) 30 (71.4) 45 (71.4)
MetS (n, %) 25 (59.5) 41 (65)
TC (mg/dL) 197 (44) 200 (39)
HDL-C (mg/dL) 42 (5) 48 (9)*
LDL-C (mg/dL) 129 (36) 129 (32)
TG (mg/dL) 132 [57–234] 128 [37–293]
Apolipoprotein A-I (mg/dL) 137 (28) 134 (26)
Apolipprotein B (mg/dL) 124 (27) 121 (26)
Lipoprotein (a) (mg/dL) 17 [3–98] 16 [3–102]
CRP (mg/L) 3.6 [3.0–28.5] 6.5 [3.0–88.0]
IL-1(pg/mL) 2.2 [1.1–20.2] 3.5 [1.1–49.1]
IL-6 (pg/mL) 12.2 [5.0–71.3] 17.0 [1.5–75.6]
Fibrinogen (g/L) 4.3 [2.5–9.0] 4.2 [2.5–7.5]
Creatinine (mol/L) 80 (15) 81 (19)
Uric acid (mol/L) 296 [202–389] 302 [198–373]
Glucose (mg/dL) 124 [84–364] 144 [83–393]
Insulin (U/mL) 9.3 [1.8–51.3] 9.7 [3.4–62.9]
HOMA-IR 2.6 [0.4–45.6] 3.4 [0.8–29.4]
Infarct volume (cm3) 17.7 [1.4–161.0] 147.3 [1.6–1134.0]*
TACI (n, %) 9 (21.4) 0 (0)
PACI (n, %) 9 (21.4) 44 (65.5)*
POCI (n, %) 0 (0) 11 (17.5)
LI (n, %) 24 (57.2) 11 (17.5)*
IMT mean (mm) 1.04 (0.14) 1.08 (0.17)
BI on admission 82.5 [20.0–100.0] 10.00 [0.0–80.0]*
Data are expressed as means (S.D.) or median [min–max], unless otherwise noted. Conversion factors: to convert TC, LDL-C, and HDL-C levels from mg/dL to mmol/L, multiply by 0.02586. To convert TG levels from mg/dL to mmol/L multiply by 0.01129. To convert values for glucose to mmol/L, multiply by 0.05551. To convert values for insulin to pmol/L, multiply by 6.945. MetS, metabolic syndrome; TC, total cholesterol; HDL-C, high density lipoprotein cholesterol; LDL-C, low density lipoprotein cholesterol; TG, triglycerides; CRP, C-reactive protein; IL, interleukin; HOMA-IR, Homeostasis Model Assessment; TACI, total anterior circulation infarct; PACI, partial anterior circulation infarct; POCI, posterior circulation infarct; LI, lacunar infarct; IMT, intima–media thickness; BI, Barthel Index.
* p< 0.001.
than in women [median value (range), 302 (222–389)mol/L vs. 290 (198–369)mol/L,p= 0.18], among stroke patients with the MetS than among those without the MetS [304 (242–389)mol/L vs. 294 (198–373)mol/L,p= 0.25], and among patients with diabetes compared with non-diabetic subjects (Table 2). Nevertheless, serum concentrations of uric acid did not significantly differ between patients with a BI≥95 and those with BI < 95 (Table 1); this applied to men and women as well as to patients with an established diagnosis of MetS and/or diabetes. There were no signifi-cant differences in pharmacologic treatment before the event and post-discharge between patients with a BI≥95 and those with BI < 95 (Table 3).
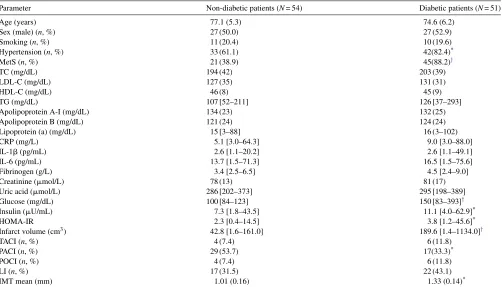
In univariate analysis, compared with patients with a low BI at 6 months after stroke, those with a BI≥95 had lower plasma HDL-cholesterol levels and infarct volumes, and higher values of BI on admission (Table 1). The prevalence of hypertension, MetS, plasma glucose and insulin levels, HOMA-IR, and the mean IMT values were significantly higher in patients with diabetes compared with non-diabetic
subjects (Table 2). Further analysis by two-way ANOVA
showed that diabetic patients had significantly higher mean infarct volume compared with non-diabetic patients (median values, 189.6 cm3vs. 42.8 cm3;F= 4.43,p= 0.02).
Significant differences in mean infarct volume were noted among age tertiles (p= 0.008). Specifically, post hoc analy-sis (LSD test) revealed significant differences between the 2nd and 3rd age tertiles (p= 0.019). The DM×age tertile interaction was also significant (p< 0.01). This interaction could be due to the extremely high infarct volume val-ues observed in the 3rd age tertile of diabetic patients (Fig. 1).
Moreover, a significant difference in mean infarct volume among different infarct locations was also evident (p= 0.016). Post hoc analysis (LSD test) showed significant differences between LI and TACI (median values, 33.5 cm3vs. 59.1 cm3,
p< 0.001), PACI and TACI (median values, 148.2 cm3 vs.
59.1 cm3,p= 0.004) and POCI and TACI (median values,
79.8 cm3vs. 59.1 cm3,p= 0.008).
Table 2
Baseline clinical and laboratory characteristics in the study population according to the presence of diabetes
Parameter Non-diabetic patients (N= 54) Diabetic patients (N= 51)
Age (years) 77.1 (5.3) 74.6 (6.2)
Sex (male) (n, %) 27 (50.0) 27 (52.9)
Smoking (n, %) 11 (20.4) 10 (19.6)
Hypertension (n, %) 33 (61.1) 42(82.4)*
MetS (n, %) 21 (38.9) 45(88.2)†
TC (mg/dL) 194 (42) 203 (39)
LDL-C (mg/dL) 127 (35) 131 (31)
HDL-C (mg/dL) 46 (8) 45 (9)
TG (mg/dL) 107 [52–211] 126 [37–293]
Apolipoprotein A-I (mg/dL) 134 (23) 132 (25)
Apolipoprotein B (mg/dL) 121 (24) 124 (24)
Lipoprotein (a) (mg/dL) 15 [3–88] 16 (3–102)
CRP (mg/L) 5.1 [3.0–64.3] 9.0 [3.0–88.0]
IL-1(pg/mL) 2.6 [1.1–20.2] 2.6 [1.1–49.1]
IL-6 (pg/mL) 13.7 [1.5–71.3] 16.5 [1.5–75.6]
Fibrinogen (g/L) 3.4 [2.5–6.5] 4.5 [2.4–9.0]
Creatinine (mol/L) 78 (13) 81 (17)
Uric acid (mol/L) 286 [202–373] 295 [198–389]
Glucose (mg/dL) 100 [84–123] 150 [83–393]†
Insulin (U/mL) 7.3 [1.8–43.5] 11.1 [4.0–62.9]*
HOMA-IR 2.3 [0.4–14.5] 3.8 [1.2–45.6]*
Infarct volume (cm3) 42.8 [1.6–161.0] 189.6 [1.4–1134.0]†
TACI (n, %) 4 (7.4) 6 (11.8)
PACI (n, %) 29 (53.7) 17(33.3)*
POCI (n, %) 4 (7.4) 6 (11.8)
LI (n, %) 17 (31.5) 22 (43.1)
IMT mean (mm) 1.01 (0.16) 1.33 (0.14)*
Data are expressed as means (S.D.) or median [min–max], unless otherwise noted. Conversion factors: to convert TC, LDL-C, and HDL-C levels from mg/dL to mmol/L, multiply by 0.02586. To convert TG levels from mg/dL to mmol/L multiply by 0.01129. To convert values for glucose to mmol/L, multiply by 0.05551. To convert values for insulin to pmol/L, multiply by 6.945. MetS, metabolic syndrome; TC, total cholesterol; HDL-C, high density lipoprotein cholesterol; LDL-C, low density lipoprotein cholesterol; TG, triglycerides; CRP, C-reactive protein; IL, interleukin; HOMA-IR, Homeostasis Model Assessment; TACI, total anterior circulation infarct; PACI, partial anterior circulation infarct; POCI, posterior circulation infarct; LI, lacunar infarct; IMT, intima–media thickness; BI, Barthel Index.
* p< 0.05. †p< 0.001.
IL-1(beta = 0.30,p= 0.03), HDL-cholesterol (beta = 0.31,
p= 0.02), the presence of diabetes (beta = 0.34,p= 0.02), the 3rd age tertile (beta = 0.26, p= 0.04), and the TACI loca-tion (beta = 0.24,p= 0.03) independently contributed to the
variation of infarct volume [adjustedR2of the model, 0.43 (F= 6.03,p< 0.001)].
Likewise, when BI at 6 months was selected as the dependent variable significant independent associations
Table 3
Medical treatment received by patients before and after the stroke [classified according to the Barthel Index (BI) at 6 months]
Medication BI≥95 (N= 42) BI < 95 (N= 63)
Before stroke,n(%) After stroke,n(%) Before stroke,n(%) After stroke,n(%)
Aspirin 4 (9.5) 34 (80.9) 7 (11.1) 52 (82.5)
Clopidogrel 0 (0) 8 (19.1) (0) 11 (17.4)
Statin 6 (15) 42 (100) 14 (22.2) 63 (100)
Anti-hypertensive therapy 30 (71.4) 33 (78.6) 45 (71.4) 50 (79.4)
- Diuretics 25 (59.5) 27 (64.2) 37 (58.7) 41 (65.1)
- ACE inhibitors 17 (40.5) 17 (40.5) 25 (39.6) 27 (42.8)
- ARBs 7 (16.7) 9 (21.4) 10 (15.9) 13 (22.2)
- CCBs 11 (26.2) 14 (33.3) 16 (25.4) 19 (30.1)
- Beta-blockers 5 (11.9) 6 (14.3) 8 (12.7) 8 (12.7)
Anti-diabetic treatment 15 (35.7) 15 (35.7) 22 (34.9) 22 (34.9)
- Sulfonylureas 6 (14.3) 5 (11.9) 8 (12.7) 8 (12.7)
- Metformin 12 (28.6) 12 (28.6) 17 (27.0) 18 (28.5)
- Insulin 4 (9.5) 5 (11.9) 5 (7.9) 8 (12.7)
Fig. 1. Mean infarct volume as a function of age tertiles in diabetic and non-diabetic patients. Diabetic patients at the 3rd age tertile demonstrate extremely high infarct volume values.
were evident for IMT (beta =−0.41, p= 0.03), infarct
volume (beta =−0.39, p= 0.002), and TACI’s location
(beta =−14.73,p= 0.04). The adjustedR2of this model was 0.363 (F= 4.99,p< 0.01).
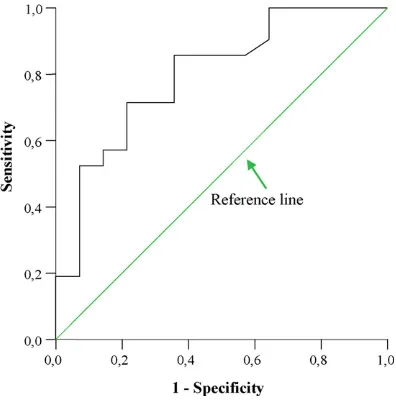
The ROC curve analysis indicated that the infarct volume may accurately diagnose patients with unfavorable func-tional outcome (BI < 95) at 6 months after discharge (area
under the curve, AUC = 0.80, 95%CI 0.64–0.95;p= 0.003)
(Fig. 2). Infarct volume was superior to IMT (AUC = 0.56,
CI 95% = 0.36–0.75,p= 0.53) and IL-1b (AUC = 0.38, 95%
CI 0.36–0.750.18–0.58,p= 0.25) with regard to prediction of neurological deficit. A threshold value of 9.96 cm3
pre-Fig. 2. Plot of receiver-operating characteristics (ROC) curve for infarct volume for patients with a Barther Index (BI) lower than 95 at 6 months after discharge.
dicted low BI scores at 6 months with a sensitivity of 0.71 (95% CI: 0.52–0.90), specificity of 0.78 (95% CI 0.71–0.85), a positive predictive value 0.83 (95% CI: 0.65–0.99), and a negative predictive value 0.64 (95% CI: 0.42–0.87). The like-lihood ratio for a positive result (i.e. the ratio of the chance of a positive result if the patient experiences the condition to the chance of a positive result if he does not) was 3.33, in favor of the infarct volume as a useful predictor of long-term stroke outcome.
4. Discussion
In the present study we evaluated the relative value of clinical, biochemical and imaging markers in the prognosis of the functional outcome after an ischemic stroke. Infarct volume, stroke location, age, diabetes mellitus, markers of atherosclerosis (IMT) and inflammations (IL-1) proved to be significant determinants of long-term functional outcome, assessed by BI disability score. To the best of our knowledge, no study to date has examined the impact of both traditional and novel risk markers in this setting.
In accordance with previous studies, our findings indi-cate a negative relationship between functional outcome and the size of the brain lesion, suggesting that the larger the infarct size the greater the neuronal damage and the worse the outcome and neurological deficit[6]. The site of injury is an additional variable determining the extent of functional deficits from stroke. Indeed, localization of the lesion at the anterior circulation carried the worst progno-sis in our study. These findings are conprogno-sistent with earlier studies reporting that TAC (total anterior circulation) syn-drome is associated with the greatest severity and worst
outcome compared with other stoke subtypes [11,12] and
support the notion that early recovery is related to clini-cal stroke syndrome, with LI having the greatest recovery and most favorable outcome, and TACI having the least
recovery and poorest outcome[13]. Early CT findings and
large-artery atherosclerosis in TACI has been shown to be associate with higher deterioration frequencies [12], while edema (cytotoxic and vasogenic) has been considered as an important underlying mechanism of clinical deterioration
[14].
In the present study, mean IMT values were reversely asso-ciated with the functional outcome. The role of IMT as a significant predictor of stroke outcome has been questioned
Neuro-inflammation has reportedly an important role in the pathogenesis of ischemic brain damage. IL-1 is a cytokine with multiple proinflammatory effects. It has been suggested
that two ligands produced by microglia, namely IL-1␣and
IL-1, may exacerbate ischemic brain damage, while
neu-tralizing antibodies against IL-1may reduce the ischemic injury[17]. It has been demonstrated that ischemic brain dam-age is significantly reduced in mice lacking IL-1 receptor subjected to transient middle cerebral artery occlusion[18].
Diabetes not only significantly increases the risk of stroke but also can worsen the functional outcome[19]. Our findings are in line with evidence showing that hyperglycemia is cor-related with greater infarct size and worse functional outcome
[20]. Age has also been established as a significant predic-tor of functional outcome. The incidence of stroke increases with increasing age among diabetic patients[19]. However, no study to date has examined the relative value of tradi-tional and novel risk markers in diabetic patients suffering a non-embolic ischemic stroke. Our analysis showed that in the subgroup of diabetic patients, advanced age exerts a harm-ful effect on stroke outcome, significantly affecting the size of infarct volume. It is of importance that in the presence of diabetes the relations between risk factors, such as IMT and IL-, were attenuated.
Our findings are consistent with a previous report in a Greek population showing that neither hypertension nor hypercholesterolaemia predict post-stroke functional
out-come [21]. Although hypertension is an established risk
factor for stroke, its impact on stroke prognosis remains weak. It has been described that both high and low BP are prognostic factors of poor outcome, thus suggesting a U-shaped relation; however, extremely high or very low BP measurements are not frequently seen in acute stroke[22]. It should always be considered that the timing of BP measure-ment may confound the association between hypertension
and outcome in acute stroke[23]. Moreover, admission BP
values may not reliably reflect any impact of BP on stroke
outcome at 3 months [24]. Hypercholesterolemia has been
disputed as a significant predictor of neurological deteriora-tion. It has been reported that elevated serum total cholesterol levels may be associated with a decreased risk of disabil-ity after stroke, independently of comorbidities[25]. On the other hand, cholesterol-lowering treatment (statins) has been shown to produce a beneficial effect on stroke outcome, prob-ably due to their beyond lipid-lowering, pleiotropic, effects
[26]. Post-discharge administration of statin and antiplatelet treatment was an integral part of the study protocol; compli-ance was improved by reinforcing the need for treatment and addressing the patient’s apprehensions during the follow-up period. No associations between the presence of MetS (the clustering of several classic cardiovascular risk factors, such as obesity, hyperglycemia, hypertension, elevated TG and low HDL-cholesterol) and stroke functional outcome were evident in our analysis. It has been reported that elevated serum uric acid levels may be associated with a poor out-come and early death after acute stroke[27,28]. However, in
our study serum uric acid levels were not found to predict stroke outcome. This finding may have been influenced by the fact that serum uric acid levels observed in the study pop-ulation wererelatively low, even in subjects anticipated to have raised baseline uric acid concentrations, including men, patients with the MetS, diabetes and those receiving diuretics. Besides the widely accepted atheroprotective role of HDL-cholesterol in coronary heart disease, its relationship
with stroke remains unclear [29,30]. Our analysis
indi-cated that HDL-cholesterol levels were reversely associated with stroke functional outcome, and positively related with the size of brain infarct volume. A potential explanation could be that under certain conditions, such as diabetes, the MetS, or the composition of diet, HDL molecule may undergo qualitative modifications on its constituents[31]. As a result, HDL becomes dysfunctional with impaired antiox-idant, anti-inflammatory, and antihrombotic properties. In line, increased plasma oxidative status may account for the development of cardiovascular disease in subjects with ele-vated HDL-cholesterol levels[32].
In conclusion, our study showed that large size infarcts located at the anterior cerebral circulation have worse func-tional prognosis. Diabetes, age, IMT, and IL-1b levels also have a prognostic role in predicting long-term functional out-come. Infarct volume proves to be superior to other markers in this setting. Specifically, an infarct volume of approximately 10 cm3 could reliably predict a BI score less than 95, at 6
months after acute ischemic stroke. However, larger cohort studies are required in order to establish accurate prognos-tic models in this setting. The value of the aforementioned factors in therapeutic and rehabilitation strategies may fuel future research.
References
[1] Ionita CC, Xavier AR, Kirmani JF, Dash S, Divani AA, Qureshi AI. What proportion of stroke is not explained by classic risk factors? Prev Cardiol 2005;8:41–6.
[2] Appelros P, Nydevik I, Viitanen M. Poor outcome after first-ever stroke: predictors for death, dependency, and recurrent stroke within the first year. Stroke 2003;34:122–6.
[3] Di Napoli M, Papa F, Bocola V. C-reactive protein in ischemic stroke: an independent prognostic factor. Stroke 2001;32:917–24.
[4] Waje-Andreassen U, Krakenes J, Ulvestad E, et al. IL-6: an early marker for outcome in acute ischemic stroke. Acta Neurol Scand 2005;111:360–5.
[5] Ellul J, Talelli P, Terzis G, Chrysanthopoulou A, Gioldasis G, Papa-petropoulos T. Is the common carotid artery intima-media thickness associated with functional outcome after acute ischaemic stroke? J Neurol Neurosurg Psychiatry 2004;75:1197–9.
[6] Pan SL, Wu SC, Wu TH, Lee TK, Chen TH. Location and size of infarct on functional outcome of noncardioembolic ischemic stroke. Disabil Rehabil 2006;28:977–83.
[7] de Jong G, van Raak L, Kessels F, Lodder J. Stroke subtype and mor-tality. A follow-up study in 998 patients with a first cerebral infarct. J Clin Epidemiol 2003;56:262–8.
[9] Uyttenboogaart M, Stewart RE, Vroomen PC, De Keyser J, Luijckx GJ. Optimizing cutoff scores for the Barthel index and the modi-fied Rankin scale for defining outcome in acute stroke trials. Stroke 2005;36:1984–7.
[10] Hack W, Kaste M, Bogousslavsky J, et al. European Stroke Initiative Recommendations for Stroke Management-update 2003. Cerebrovasc Dis 2003;16:311–37.
[11] Bamford J, Sandercock P, Dennis M, Burn J, Warlow C. Classifica-tion and natural history of clinically identifiable subtypes of cerebral infarction. Lancet 1991;337:1521–6.
[12] Tei H, Uchiyama S, Ohara K, Kobayashi M, Uchiyama Y, Fukuzawa M. Deteriorating ischemic stroke in 4 clinical categories classi-fied by the Oxfordshire Community Stroke Project. Stroke 2000;31: 2049–54.
[13] Sprigg N, Gray LJ, Bath PM, et al. Stroke severity, early recovery and outcome are each related with clinical classification of stroke: data from the ‘Tinzaparin in Acute Ischaemic Stroke Trial’ (TAIST). J Neurol Sci 2007;254:54–9.
[14] Castillo J. Deteriorating stroke: diagnostic criteria, predictors, mecha-nisms and treatment. Cerebrovasc Dis 1999;9(Suppl 3):1–8. [15] Chambless LE, Folsom AR, Clegg LX, et al. Carotid wall thickness
is predictive of incident clinical stroke: the Atherosclerosis Risk in Communities (ARIC) study. Am J Epidemiol 2000;151:478–87. [16] Sobrino T, Hurtado O, Moro MA, et al. The increase of circulating
endothelial progenitor cells after acute ischemic stroke is associated with good outcome. Stroke 2007;38:2759–64.
[17] Yamasaki Y, Matsuura N, Shozuhara H, Onodera H, Itoyama Y, Kogure K. Interleukin-1 as a pathogenetic mediator of ischemic brain damage in rats. Stroke 1995;26:676–80 [discussion 81].
[18] Ohtaki H, Funahashi H, Dohi K, et al. Suppression of oxidative neuronal damage after transient middle cerebral artery occlusion in mice lacking interleukin-1. Neurosci Res 2003;45:313–24.
[19] Abbott RD, Donahue RP, MacMahon SW, Reed DM, Yano K. Dia-betes and the risk of stroke. The Honolulu Heart Program. JAMA 1987;257:949–52.
[20] Baird TA, Parsons MW, Phanh T, et al. Persistent poststroke hyper-glycemia is independently associated with infarct expansion and worse clinical outcome. Stroke 2003;34:2208–14.
[21] Vemmos KN, Bots ML, Tsibouris PK, et al. Prognosis of stroke in the south of Greece: 1 year mortality, functional outcome and its deter-minants: the Arcadia Stroke Registry. J Neurol Neurosurg Psychiatry 2000;69:595–600.
[22] Leonardi-Bee J, Bath PM, Phillips SJ, Sandercock PA. Blood pres-sure and clinical outcomes in the International Stroke Trial. Stroke 2002;33:1315–20.
[23] Christensen H. The timing of the blood pressure measurement may affect the result in patients with acute stroke. Hypertension 2004;43:e36, author reply e.
[24] Boreas AM, Lodder J, Kessels F, de Leeuw PW, Troost J. Prog-nostic value of blood pressure in acute stroke. J Hum Hypertens 2002;16:111–6.
[25] Vauthey C, de Freitas GR, van Melle G, Devuyst G, Bogousslavsky J. Better outcome after stroke with higher serum cholesterol levels. Neurology 2000;54:1944–9.
[26] Amarenco P, Bogousslavsky J, Callahan 3rd A, et al. High-dose atorvastatin after stroke or transient ischemic attack. N Engl J Med 2006;355:549–59.
[27] Karagiannis A, Mikhailidis DP, Tziomalos K, et al. Serum uric acid as an independent predictor of early death after acute stroke. Circ J 2007;71:1120–7.
[28] Weir CJ, Muir SW, Walters MR, Lees KR. Serum urate as an indepen-dent predictor of poor outcome and future vascular events after acute stroke. Stroke 2003;34:1951–6.
[29] Bots ML, Elwood PC, Nikitin Y, et al. Total and HDL cholesterol and risk of stroke. EUROSTROKE: a collaborative study among research centres in Europe. J Epidemiol Community Health 2002;56(Suppl. 1):i19–24.
[30] Sacco RL, Benson RT, Kargman DE, et al. High-density lipoprotein cholesterol and ischemic stroke in the elderly: the Northern Manhattan Stroke Study. JAMA 2001;285:2729–35.
[31] Ansell BJ, Fonarow GC, Navab M, Fogelman AM. Modifying the anti-inflammatory effects of high-density lipoprotein. Curr Atheroscler Rep 2007;9:57–63.