I
NTERNATIONAL
R
AIL
F
REIGHT
S
ERVICES
RESEARCH REPORT MTI-EC-REORIENT-WP4
Maryland Transportation Initiative
University of Maryland
University of Maryland
University of Bologna
Study Supervisors Study Supervisors
Elise Miller-Hooks Alberto Caprara Hani S. Mahmassani Silvano Martello
Paolo Toth
Graduate Research Assistants Graduate Research Assistants
and Post-Docs and Post-Docs
Vishnu Charan Arcot Claudia D’Ambrosio Jing Dong Enrico Malaguti Aaron Kozuki
April Kuo
Chung-Cheng Lu Rahul Nair
RESEARCH REPORT MTI-EC-REORIENT-WP4
Maryland Transportation Initiative
University of Maryland
Code
7. Author/s
Vishnu C. Arcot, Alberto Caprara, Claudia D'Ambrosio, Jing Dong, Aaron Kozuki, April Kuo, Cheng-Chung Lu, Hani S. Mahmassani, Enrico Malaguti, Silvano Martello, Elise Miller-Hooks, Rahul Nair, Paolo Toth, Kuilin Zhang
8. Performing Organization Report No.
MTI-EC-REORIENT-WP4
9. Performing Organization Name and Address
Maryland Transportation Initiative
13. Type of Report and Period Covered
14. Sponsoring Agency Code
15. Supplementary Notes 16. Abstract
This document describes a suite of network modeling tools developed for use in the analysis and evaluation of various intermodal rail freight services contemplated in the REORIENT corridor. These tools were devised and applied to assess the performance of the overall system under different service design options and operational scenarios, including barrier mitigation or removal strategies, and to support the
development of the REORIENT business cases for intermodal rail-based service in the selected corridor. The strategies analyzed include implementation of interoperability directives, removing or barrier-reducing improvements in physical, operational or managerial aspects/business practices of the rail system, as well as other policy measures and potential inducements aimed towards achieving EC policy objectives.
17. Key Words
Intermodal rail services; Freight Transport; Logistics Strategies; European Community; International rail services; Freight demand forecasting; Rail service design and scheduling; Network assignment.
18. Distribution Statement: No restrictions
19. Security Classification (of this report) 20. Security Classification
(of this page)
REORIENT WP 4
REORIENT, “Implementing Change in the European Railway System” 513567
interoperability, which is transforming the European rail freight industry from closed, monopolistic, nationally-oriented businesses insulated from market realities such that new players and newcomers both from the rail and logistics industry can find new opportunities, and from nationally-fragmented railway subsystems into an internationally integrated and interoperable pan-European system.
From a research perspective, these massive changes pose a host of challenges in monitoring and understanding how common legislation is transposed under diverse national political and economic conditions, industry changes, and social support and opposition to the changes. From a global perspective, these changes are taking place in the midst of a serious transformation of the transport industry as a whole, and where old solutions rapidly are becoming obsolete.
The project is focusing on a trans-European transport corridor through eleven countries (called the REORIENT Corridor) stretching from Scandinavia in the north to Greece in the south, and is working toward three main objectives:
1. Assessing and monitoring the progress toward the development of an integrated freight railway system in the countries located along the REORIENT Corridor, explaining the variation in the status of interoperability across these countries, assessing the degree of political and social support for improving interoperability in these countries, identifying barriers to seamless rail freight transport through these countries, and recommending ways to overcome the barriers.
2. Identifying and assessing the market potential for new international rail freight transport services through these countries.
3. Evaluating the relevant internal and external effects that will result from implementing the new services, including the effects on rail companies and shippers, and the effects that bear on the whole society and the environment.
As shown in the figure below, the technical part of the project is divided into eight work packages, which are grouped into three sets, roughly corresponding to the three main objectives specified above (although much of the work in Work Package 5 is related to the first main objective). This report documents the work performed in Work Package 4 (WP4) – an assessment of the progress in achieving interoperability across the countries in the REORIENT Corridor, which addresses the first of REORIENT’s main objectives.
This report has been prepared by the REORIENT Consortium, which consists of seven partners and sixteen subcontractors, representing research institutes, private companies, rail organizations, and universities in fourteen European countries and the United States. The work documented in the present report was jointly performed by the University of Maryland and the University of Bologna.
demand
WP 8
REORIENT Knowledge Base Social support for
interoperability demand
WP 8
REORIENT Knowledge Base Social support for
III
Executive Summary
Analysis of the complex interactions over space and time associated with the movement of freight between origins and destinations over intermodal networks with rail service as the backbone entails use of sophisticated network modeling methodologies. This document describes a suite of network modeling tools developed for use in the analysis and evaluation of various intermodal rail freight services contemplated in the REORIENT corridor. These tools were devised and applied to assess the performance of the overall system under different service design options and operational scenarios, including barrier mitigation or removal strategies, and to support the development of the REORIENT business cases for intermodal rail-based service in the selected corridor. This report provides an overview of the methodological structure and major components of the network analysis tools that provide the capability to evaluate performance measures, costs and benefits derived from implementation of interoperability directives, barrier-removing or barrier-reducing improvements in physical, operational or managerial aspects/business practices of the rail system, as well as other policy measures and potential inducements aimed towards achieving EC policy objectives.
intermodal terminals, classification yards and other nodes.
A route design model specifies detailed routing of trains within the corridor to serve a set of demands, given the travel times and delays. The route design problem is formulated as an integer linear program and an approximate procedure consisting of column generation and fixing techniques is proposed for its solution. Schedules for the service routes are determined using scheduling algorithms, which also use the link and node performance characteristics from the simulation. The scheduling problem is addressed by a Train Slot Generation Model. The Train Slot Generation Model is composed of a binary multicommodity network flow problem formulation that relies on a train slot representation of the track capacity within a time-space network representation and a column generation technique that, by exploiting certain properties of the problem, can quickly generate near optimal solutions. A train slot adjustment method is employed to adjust the train slots to accommodate shipments identified at pick-up and drop-off terminals. Resulting services can be evaluated in terms of market share response and performance characteristics using the simulation-assignment framework. Because the resulting demand and travel times may be different than the ones used in designing the routes and schedules, the process, including optimal route and schedule decisions, is iterated until mutual consistency is achieved between the procedures.
V
Table of Contents
Executive Summary ... III
List of Figures ... VIII
List of Tables ... XX
Chapter 1 Introduction to the Network Modeling Framework for REORIENT ... 1
1.1 Introduction ... 1
1.2 Purpose and Role of Network Models in REORIENT ... 2
1.3 General Intermodal Network Framework ... 6
1.4 Special Representation Adapted to REORIENT Scope ... 9
1.5 Dynamic Service Network Representation for Operational Interoperability Analysis . 11 1.6 Overall Structure of Network Modeling Platform ... 12
Chapter 2 The REORIENT Network ... 16
2.1 Introduction ... 16
2.3.1 The REORIENT network ... 28
2.4 Proposed Services ... 36
2.4.1 Service design ... 36
2.4.2 Loading points and other scenario attributes ... 38
Chapter 3 Dynamic Intermodal Simulation-Assignment Platform for REORIENT . 40 3.1 Introduction ... 40
3.2 Problem Context and Assumptions ... 44
3.3 Simulation-Assignment Framework ... 46
3.3.1 Simulation-assignment solution framework ... 47
3.3.2 Multimodal network representation and intermodal shortest path ... 49
3.3.3 Joint mode and route choice model and network loading ... 50
3.4 Multimodal Freight Network Simulator ... 52
3.4.1 Freight simulator ... 52
3.4.3 Link moving ... 56
3.4.4 Node transfer ... 56
3.5 Concluding Remarks ... 61
Chapter 4 A Route Design Model for the REORIENT Corridor ... 63
4.1 Introduction ... 63
4.2 A Path Base Model ... 65
4.2.1 Problem input ... 65
4.2.2 Problem objective ... 66
4.2.3 Profits ... 67
4.2.4 Modelling stopping time in the network ... 68
4.3 Modelling Approach ... 69
4.5.1 Orienting the network ... 83
4.5.2 Terminal stop and node delays ... 86
4.5.3 Network reduction ... 88
4.5.4 Node numbering ... 91
4.5.5 Solution mapping ... 92
4.5.6 The node file and the arc file ... 93
4.5.7 The intermediate files ... 95
4.6 Adaptation of the Model to the Available Data ... 98
4.6.1 Network topology and technical characteristics ... 98
4.6.2 Demand ... 100
4.6.3 Base case settings ... 102
4.7 Conclusions ... 106
Chapter 5 A Train Scheduling Model for the REORIENT Corridor ... 107
5.1 Introduction ... 107
5.2 Problem Assumptions ... 110
5.3 2006 and 2020 Freight Traffic within the Corridor ... 113
5.4 Time-Space Network Representation ... 114
5.5 Initial Track Capacity Allocation ... 118
5.6 Train Slot Generation Model and Solution Technique ... 121
5.6.1 Arc-based train slot generation model ... 123
5.6.2 Path-based train slot generation model ... 126
5.6.3 Track capacity modification ... 128
5.6.4 Solution technique ... 134
5.6.5 Rounding ... 137
VII 6.1 Concluding Remarks ... 139 6.2 Illustrative Findings ... 140
List of Figures
Figure 1-1. Multimodal network representation.. ... 7
Figure 1-2. Overall Network Modeling Structure.. ... 14
Figure 2-1. ETIS zones outside the European Union. ... 18
Figure 2-2. The REORIENT study area. ... 19
Figure 2-3. Flow types modeled in the REORIENT corridor as compared to ETIS flows. ... 21
Figure 2-4. Seasonal variation in rail freight demand across all EU countries. ... 25
Figure 2-5. Seasonal variation in rail freight demand across select countries. ... 25
Figure 2-6. Distribution of weight per TEU by commodity classification. ... 26
Figure 2-7. Distribution of weight per TEU by commodity classification. ... 27
Figure 2-8. Coarse global freight network. ... 29
Figure 2-9. The REORIENT network. ... 31
Figure 2-10. The sub-network. ... 33
Figure 2-11. Existing Pan-European corridors through the REORIENT study area. ... 34
Figure 2-12. Congestion factors on truck-only paths. ... 35
Figure 2-13. Services proposed through expert opinion. ... 37
Figure 2-14. Loading points fo the Intermidiate scenario. ... 38
Figure 3-1. Simulation-assignment solution framework. ... 49
Figure 3-2. Multimodal freight network simulator. ... 55
Figure 3-3. Generalized bulk queueing model. ... 58
Figure 3-4. Processes at a classification yard. ... 59
IX
Figure 4-1. Cost delay function. ... 68
Figure 4-2. The flow of the program for the preprocessing of the network. ... 82
Figure 4-3. An example for orienting the network. ... 85
Figure 4-4. The transformation of the terminal node to handle the delay due to the train stop. ... 87
Figure 4-5. Dropping a node with input degree and output degree equal to 1. ... 89
Figure 4-6. The original and reduced network. ... 90
Figure 4-7. Cost delay function, goods with high sensitivity to transit time.. ... 104
Figure 4-8. Cost delay function, goods with low sensitivity to transit time.. ... 105
Figure 5-1. Interaction between train slot generation model and simulation platform. ... 110
Figure 5-2. A time-space network representation. ... 118
Figure 5-3. Possible train conflicts on the time-space network. ... 123
Figure 6-1. Synergistic effects of multiple improvements leader to significant increase in intermodal market share. ... 141
List of Tables
Table 2-1. Summary of differences between ETIS and REORIENT demand. ... 17
Table 2-2. NST/R Chapters commodity classification. ... 22
Table 2-3. Percentage growth in tonnes transported between origin and destination regions, 2001-2006, all goods types, all transport modes. ... 24
Table 2-4. Distribution of values by NST/R chapters. ... 28
Table 4-1. γ values for each NTS/R good category ... 103
Chapter 1
Introduction to the REORIENT Network
Modeling Framework
1.1 Introduction
In the next section, we articulate the purpose of analytical activities that require a network model representation of the underlying freight movement processes; this provides the basis to define the functional requirements for the general network modeling framework and associated tools. We then define the principal elements of the general framework, including representation of the demand-side activities as well as supply-side considerations that are essential to the questions of interest to the REORIENT project. This includes specification of the types of nodes and node activities that must be represented, the types of link activities and associated attributes, the flows, and level of disaggregation. Third, a general intermodal network representation is sketched out. In section 1.4, elements of the network modelling framework are customized to the specific analysis needs of REORIENT. In section 1.5, we highlight a space-time representation of rail activities oriented towards optimization of operational activities, and slot allocation and scheduling as part of a collaborative decision-making framework envisioned for an evolved fully-interoperable REORIENT corridor. Finally, section 1.6 presents the overall structure of the network model system and introduces the remaining chapters of this report.
1.2
Purpose and Role of Network Models in
REORIENT
barrier-the rail system, as well as obarrier-ther policy measures and potential inducements aimed towards achieving EC policy objectives.
Prediction of impacts of alternative actions and scenarios should consider the following actors: (1) shippers, (2) service providers, (3) owners and other industry players, and (4) society at large. Spatially, the impact of alternative actions and scenarios should be disaggregated to the region and country levels. Impact information should also have some level of specificity with regard to major commodity groups, especially as pertains the business development objectives of the program.
The network modeling and analysis capabilities undertaken under the REORIENT project have the following objectives:
1. Support business case development (for rail and related intermodal service) by predicting the profit and cost implications of particular service supply strategies under varying regulatory and interoperability scenarios (in turn corresponding to different levels of implementation of EC directives and related interventions).
3. Support interoperability assessment and deployment, e.g. prioritization of specific actions and measures aimed towards interoperability, by evaluating the costs and benefits of such actions.
4. Translate changes in operating practices, e.g. in scheduling, into operational attributes of links and nodes in the network representation, to enable prediction of anticipated impacts on service levels, system performance and rail competitiveness in attracting shipper demand.
5. Support development of collaborative decision-making framework and protocols for optimal utilization of existing and anticipated infrastructure under varying degrees of interoperability and access management rules, to maximize the ability of enterprises to provide competitive services in the REORIENT corridor.
the train schedule (also referred to as the timetable) for multiple service routes with single track or double one-way track linking several major terminals. However, given the importance of service design issues, which vary with time of day, as well as various operational characteristics of service provision (such as delays at intermodal terminals, border crossings, and priority rules for track utilization by competing services), it was determined that a time-varying analysis methodology is required for the REORIENT corridor scenarios.
Objectives 4 and 5 require a time-varying representation of the system of interest, focusing in this case almost exclusively on the rail network itself, with some coordination with port operational considerations at selected nodes. For objective 4, scheduling models can provide the core analysis capability; specifically, the ability to produce optimal utilization of existing assets and determine the associated train-carrying and freight-carrying capacity of individual network components is called for. Furthermore, it is necessary to determine congestion locations and associated costs to the extent that such bottlenecks might be present under both current and future scenarios. Supporting the objectives of interest also calls for the ability to then integrate the results of the more detailed optimization models of specific rail activity into the broader network evaluation framework developed for the overall analysis. Objective 5 requires an analysis approach in which slots for utilization of specific segments of infrastructure over specific time intervals are defined; these become the basic objects of analysis, and procedures for managing access to these slots will then need to be determined and evaluated as part of the business case assessment.
section 1.5 sketches out elements of the time-space models required for more detailed operational analysis.
1.3 General Intermodal Network Framework
The network of interest is represented as a general network G(N, A), where N denotes the set of nodes N and A the set of arcs. However, the intermodal nature of the system under consideration means that we envision an overall network that consists of as many sub-networks as there are modes of interest (in REORIENT, in addition to rail, we envision the need to represent road traffic for truck access to rail, and port/marine links between essential access points on the rail network). To facilitate the representation, it is convenient to think of each mode as existing in a different plane, with transfers between modes taking place through arcs connecting designated nodes in different planes, as shown in Figure 1-1. Transfer arcs are represented as vertical arcs in Figure 1-1.
With each modal arc (on a given plane) are associated various attributes that reflect the supply-side of the system, namely how much service is offered and at what service levels, such as (1) distance, (2) speed, (3) travel time, (4) capacity, (5) frequency of service (for rail and other scheduled mode links), and (6) type of service, cost (incl. taxes and fees). For the REORIENT project, these characteristics were established primarily from secondary data sources gathered under Work Package 1, as well as from local subcontractors where necessary/applicable.
Figure 1-1. Multimodal network representation. Each plane corresponds to a mode; vertical arcs represent allowable transfers between corresponding modes at the indicated intermodal transfer nodes.
In general, attributes that reflect operational characteristics of the service provided along the arc will vary by time of day, and possibly by time of week, and season. Assuming that time is discretized into intervals over which service attributes remain constant, we will have time-indexed attributes of the networks of interest.
intermodal hubs such as ports, and possibly major industrial complexes, as well as special generators that serve as aggregators of demand generated beyond the area in the immediate geographic scope of the analysis (equivalent to “external” zones in conventional planning practice).
Problem addressed: Given the above multi-modal network with known service supply attributes, and the total base year and forecast year(s) O-D (origin-destination) demands for the network of interest, disaggregated by commodity class, the network model is called upon to support objectives 1 through 3 by determining (1) the rail share (including rail-dominant intermodal movement) for the various commodity classes in the O-D markets of interest, (2) the resulting flows on the rail network components (for the various time intervals of interest), (3) the associated service levels experienced by system users, and (4) the array of performance measures, costs, benefits, etc. mentioned previously.
procedures, as level of service information is required for each modal and intermodal choice alternative included in the analysis.
The modeling approach adopted for the REORIENT network modeling platform integrates the mode choice modeling process within the network flow assignment framework. A mode choice model was developed at the firm (shipper or consignee) level, and is therefore sensitive to the characteristics of both the shipment/commodity and the usual transportation service level attributes. To apply it for forecasting the impacts of the policies of interest, a procedure was developed to aggregate firm level forecasts to the population level (this is known in the discrete choice modeling literature as the aggregation problem). The most commonly used approach for this purpose is microsimulation of shipper decisions, whereby a sample of actual or hypothetical shippers is generated and the model is applied to the members of this sample. The aggregate results serve as estimators for the underlying unknown population choices. For the REORIENT network modeling platform, a microsimulation approach to the demand side decisions was integrated in the flow assignment process.
1.4
Special Representation Adapted to
REORIENT
Scope
1 the rail network is represented in as much detail as feasible given the state of the data collection process;
2 all relevant intermodal access nodes are included in the representation, with detailed attributes, providing all necessary connections to the major modal alternatives that shippers might use to access the rail network, and that a service provider might coordinate offerings with or target for special services;
3 major non-rail access links to the rail network are included, especially to the extent that their relative desirability may increase or decrease as a result of policy intervention, private investment, or increased use contributing to congestion; and
4 competing modes, especially highway trucking, are represented through abstract arcs defined between origin and destination nodes, without the need to include the full extent of the network topology and services offered on that network. The attributes of the competing mode arcs were obtained through a pre-analysis, as these are not assumed to change through the intervention scenarios under investigation in the selected REORIENT corridor.
corridor project. This intermodal “light” network model offers considerable advantage in terms of computer memory requirements and execution performance, enabling more responsive analysis of the various scenarios.
1.5 Dynamic
Service
Network
Representation f
or
Operat
ional
Interoperability Analysis
The above network modeling framework is intended to support the service and operational scenario analysis needs of the REORIENT project, as discussed previously. In addition, it enables a finer level of modeling of rail operational processes that interfaces with optimization tools for the design and operation of rail services (routes and schedules). Such tools are required for (1) the identification and mitigation of operational bottlenecks to interoperability and to new competitive rail freight services; and (2) the identification, development and evaluation of new business concepts for the seamless operation of the rail system in conjunction with its feeder modes. The time dimension is essential to both of these aspects, which require a time-space representation of rail service.
Furthermore, any business case proposition will entail the ability to identify, create and evaluate feasible paths through the network of time-space slots. Finally, the development of significant new business models entails the development of operational management procedures to ensure safe and efficient access to the desired portions of the rail network. Collaborative decision-making schemes proposed for this purpose are rooted in the ability to rationally and fairly manage existing slots. As such, the space-time representation will support several key questions of critical interest to the project.
The modeling framework developed for the project enables a close and internally consistent linkage between the detailed operational network used at the level of the scheduling and collaborative management algorithms on one hand, and the overall network scenario analysis platform on the other (with the assignment-simulation capability at its core). Several attributes of the main network links depend on the specific operational procedures followed in that part of the network, and the services designed and scheduled to operate on them. The next section provides an overview of the various model components and procedures used in the overall network modeling methodology for the design and evaluation of services and operational strategies in the selected REORIENT corridor.
1.6 Overall Structure of Network Modeling Platform
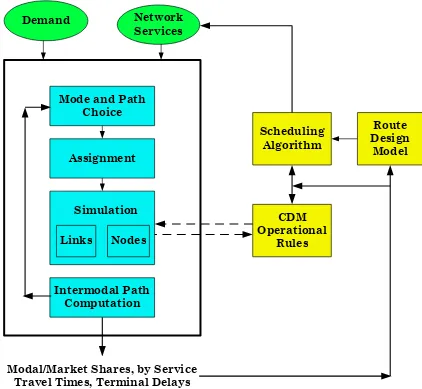
rail network and associated intermodal service connections. The mode choice is integrated with path assignment in the intermodal dynamic simulation-assignment platform, shown in Figure 1-2. For a given specification of services and operational strategies, this tool provides detailed information on flows by mode and service between the various origins and destinations in the study area. The platform also provides the associated performance measures, in terms of travel times on links and delays at intermodal terminals, classification yards and other nodes.
This information forms the basis for the design of intermodal rail services in the selected REORIENT corridor. Specifically, a route design model specifies detailed routing of trains within the corridor to serve a set of demands, given the travel times and delays. Schedules for the service routes are then determined using scheduling algorithms, which also use the link and node performance characteristics from the simulation. The resulting services can then be evaluated in terms of market share response and performance characteristics using the simulation-assignment framework. These are specified as a possible scenario. Because the resulting demand and travel times may be different than the ones used in designing the routes and schedules, the process is normally iterated until mutual consistency is achieved between the procedures, as shown in Figure 1-2.
from the operation of designed services on the network, and as such require interaction between the scheduling algorithms and the simulation component of the platform.
Demand Network
Services
Scheduling Algorithm
Route Design
Model
CDM Operational
Rules
Modal/Market Shares, by Service Travel Times, Terminal Delays
Assignment Mode and Path
Choice
Intermodal Path Computation
Simulation
Links Nodes
Figure 1-2. Overall Network Modeling Structure. The network modeling platform integrates mode-choice in a simulation-assignment framework, which provides demand and performance information to the Route Design and Scheduling algorithms. The collaborative decision making procedures perform slot management functions, which interact with the scheduled services and affect the operation of the services on the existing infrastructure.
Chapter 2
The REORIENT Network
2.1
Introduction
The network modeling platform and associated solution algorithms exploit a network representation of the REORIENT corridor. In this chapter, details of this network representation in terms of both supply characteristics and demand for its services are provided. The network topology, freight demand estimates by commodity, and short discussion of the network attributes are presented in section 2.2, followed by a description of new services and proposed infrastructure improvement scenarios in section 2.3.
2.2
Demand
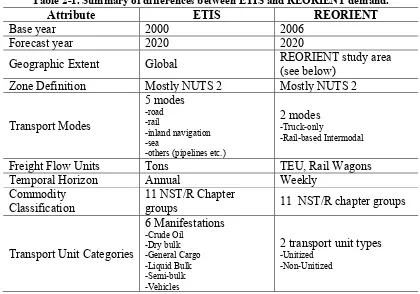
platform discussed in Chapter 1 and described in detail in Chapter 3 simulates freight movement at the shipment level for a sub-region of the geographical region covered by the ETIS database. Table 2-1 provides an overview of the extraction and transformation of ETIS freight demand matrices into the REORIENT demand data. The remainder of this section details the extraction process and assumptions made in deriving the set of shipments by product categories.
Table 2-1. Summary of differences between ETIS and REORIENT demand.
Attribute ETIS REORIENT
Base year 2000 2006
Forecast year 2020 2020
Geographic Extent Global REORIENT study area
(see below)
Zone Definition Mostly NUTS 2 Mostly NUTS 2
Transport Modes
Freight Flow Units Tons TEU, Rail Wagons
Temporal Horizon Annual Weekly
Commodity Classification
11 NST/R Chapter
groups 11 NST/R chapter groups
Transport Unit Categories
zoning scheme roughly corresponds to existing administrative boundaries with 800000 to 3 million inhabitants. For areas outside the EU, zones are coarse and are aggregated as shown in Figure 2-1.
Figure 2-1. ETIS zones outside the European Union.
For the purposes of this study, only freight movements that impact the proposed services within the study area must be considered. These relevant flows are extracted from the ETIS database based on a coarse assignment procedure described in detail in the subsection 2.2.3.
Germany that have competitive truck and rail routes. The REORIENT study area is shown in Figure 2-2.
Figure 2-2. The REORIENT study area.
2.2.2 Modes
The ETIS freight flow matrix considers five modes of transport for each of the transport legs (outbound, transshipment, and inbound). The focus of the REORIENT study is to examine rail-based intermodal transport and its competitive mode, truck transport. If flows between two zones have a rail-based leg, these flows are classified as rail-based intermodal. If all three transport legs use only road, these flows are classified as truck-only.
2.2.3 Demand extraction
A coarse network representation of the global freight network is used to perform an assignment to evaluate the flows that move through the study area. The ETIS zones are classified into study area zones and external zones. The study area is further partitioned into (a) Internal zones and (b) Peripheral Zones. Flows originating outside the study area must traverse through at least one peripheral zone before entering the study area. All zones on the boundary of the study area are demarcated as peripheral. In addition, flows from outside the study area can reach the study area through ports. Zones with ports are also classified as peripheral. With this scheme, the assignment procedure, based on shortest distance and time, classifies flows for all ETIS demand into four categories: (a) Internal-to-Internal, (b) External-to-Internal, (c) Internal-to-External, (d) External-to-External.
Figure 2-3. Flow types modeled in the REORIENT corridor as compared to ETIS flows. Zones are classified as Internal (green), Peripheral (blue) and External.
2.2.4 Classification schemes
of the model. An intermediate classification mechanism is employed, as described in the next subsection.
2.2.4.1 NST/R Chapters
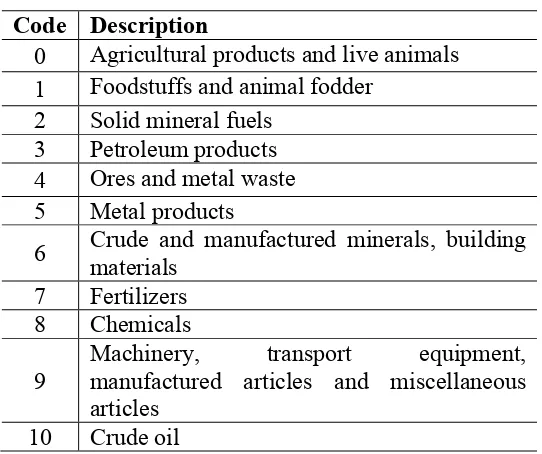
This study uses the Standard Goods Classification for Transport Statistics, NST/R chapters (Nomenclature Uniforme des Marchandises pour les Statistiques de Transport) with 10 commodity groupings plus crude oil. Table 2-2 summarizes the commodity classification used.
This classification is consistent with the ETIS base. Characteristics of each commodity group are discussed in the next section.
Table 2-2. NST/R Chapters commodity classification.
Code Description
0 Agricultural products and live animals 1 Foodstuffs and animal fodder
2 Solid mineral fuels 3 Petroleum products 4 Ores and metal waste 5 Metal products
6 Crude and manufactured minerals, building materials
7 Fertilizers 8 Chemicals 9
Machinery, transport equipment, manufactured articles and miscellaneous articles
10 Crude oil
2.2.4.2 Unitized vs. Non-Unitized
in swap-bodies, transported as bulk, etc. Operations at key facilities, such as terminals, are fundamentally different for two broad categories. We assume that containers, swap-bodies, semi-trailers fall under the “Unitized” category. Though there are differences in operation of each transport unit (swap-bodies cannot be stacked, for example), for the purposes of a regional freight network model, these details are ignored. The other category considered is “Non-Unitized,” which includes dry bulk (e.g. coal and other mineral fuels), liquid bulk (e.g. petroleum products) and commodities typically transported in wagon loads (e.g. cereals).
2.2.5 Assumptions
2.2.5.1 Growth Rates
The ETIS data exists for years 2000 and 2020; however, international transport demand has substantially changed between 2000 and 2006. To obtain more relevant 2006 demand estimates, growth rates were linearly extrapolated to estimate freight flow between zones in 2006. The growth rate employed for this extrapolation was developed based on the SCENES model predictions for year 2006 (with baseline SCENES scenario 1995-2025) obtained by the PolCorridor LOGCHAIN Project (2006). Growth by geographical location was analysed by first dividing the countries into four sub groups:
1. North: Finland, Norway, Sweden
2. North-East: Belarus, Estonia, Latvia, Lithuania, Russia
4. PolCorridor host countries (P-C host): Poland, Czech Republic, Austria.
Table 2-3 shows the expected growth in tonnage transported between these regions over the five-year period of 2001-2006 as obtained from the SCENES model.
Table 2-3. Percentage growth in tonnes transported between origin and destination regions, 2001-2006, all goods types, all transport modes.
From To
North North-East South P-C host North - - 17 % 20 %
North-East - - 16 % 19 %
South 18 % 20 % - 18 % P-C host 19 % 21 % 15 % -
2.2.5.2 Temporal Patterns
Figure 2-4. Seasonal variation in rail freight demand across all EU countries.
Figure 2-5. Seasonal variation in rail freight demand across select countries.
Rail Freight: Monthly trends across all countries (1996-2001)
0.06 0.07 0.08 0.09 0.1
Jan Feb Mar Apr May Jun Jul Aug Sep Oct Nov Dec
P
Jan Feb Mar Apr May Jun Jul Aug Sep Oct Nov Dec
The network model simulates flows for one week. to reflect the day-of-week variability that exists in freight traffic, it was assumed that 65% of the demand is generated on Mondays and Thursdays (split evenly between both days), and 35% on Tuesdays and Wednesdays (split evenly between both days).
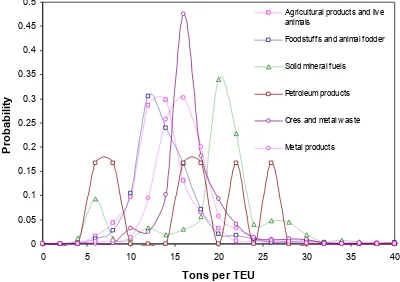
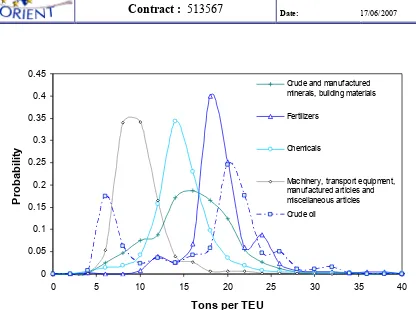
2.2.5.3 Unit Weights
Based on maritime container data (year 2000) from the ETIS database, the distribution of weights per Twenty Foot Equivalent Unit (TEU) by product category for unitized shipments can be determined. Graphs given in Figures 2-6 and 2-7 summarize these distributions. Note that for containers, maximum allowable weights are approximately 24 tons for 20 foot containers and 30 tons for 40 foot containers.
Figure 2-6. Distribution of weight per TEU by commodity classification.
Figure 2-7. Distribution of weight per TEU by commodity classification.
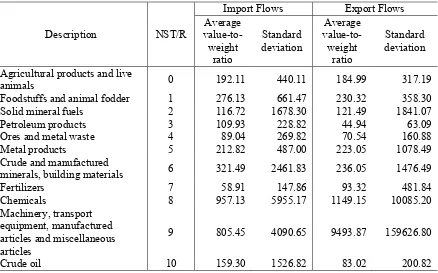
2.2.5.4 Value
Distribution of values by NST/R chapters (plus crude oil) shown in Table 2-4 are available from TRANSTOOLS. These are in euro per ton for the year 2000.
Table 2-4. Distribution of values by NST/R chapters.
Foodstuffs and animal fodder 1 276.13 661.47 230.32 358.30
Solid mineral fuels 2 116.72 1678.30 121.49 1841.07
Petroleum products 3 109.93 228.82 44.94 63.09
Ores and metal waste 4 89.04 269.82 70.54 160.88
Metal products 5 212.82 487.00 223.05 1078.49
Crude and manufactured
minerals, building materials 6 321.49 2461.83 236.05 1476.49
Fertilizers 7 58.91 147.86 93.32 481.84
The transport network representation of the REORIENT corridor is represented by the physical infrastructure and services offered along the infrastructure. In this section, characteristics of the physical intermodal network are described. Proposed services are presented in section 2.3.2.
2.3.1.1 Hierarchy of Networks
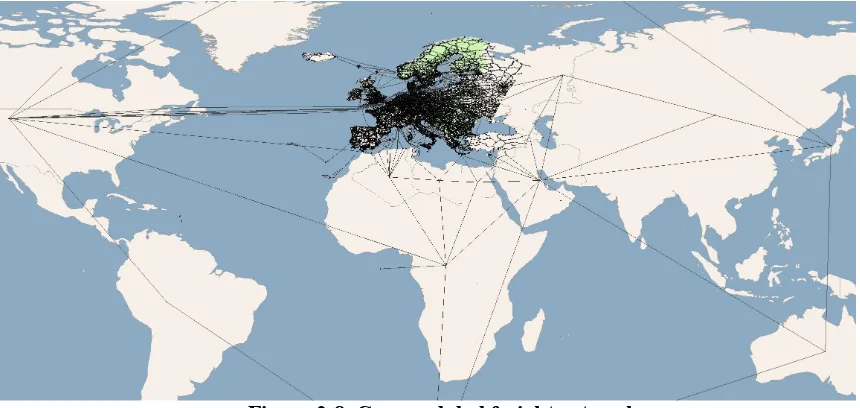
Global
A coarse representation of the physical network was used to extract relevant ETIS flows as described earlier. For external zones, ‘dummy’ links representing transport links were constructed. All major ports of Europe as per the World Container Handbook (2004) were connected with dummy links. The network is depicted in Figure 2-8. Only estimates of travel time and travel distance were used for the static assignment employed to extract relevant portions of the ETIS flows.
Figure 2-8. Coarse global freight network.
Regional
Sub-Network
Figure 2-11. Existing Pan-European corridors through the REORIENT study area.
2.3.1.2 Truck-only Virtual Network
Truck paths between all zones pairs are represented by virtual links. The virtual links have attributes (free flow travel time and distance) of the shortest road path between the two zones. The shortest path is computed from the physical centers of the zones.
To model this, zone specific congestion factors revealed in Work Package 6.1 Shipper Survey were used. For all zone pairs, congested travel time is, on the average, 3.8 times longer than free flow speeds. Figure 2-12 shows the distribution of congestion factors for all zone pairs. These factors fall in the range of 2.1 to 5.4. Area-dependent congestion factors were applied within the network.
Figure 2-12. Congestion factors on truck-only paths.
Base Case Flows
For determining base case freight transport services on the rail network, the TRANSTOOLS freight assignment is used to estimate the frequency of trains on each link.
Missing Data
Package 2 provided extensive network-wide input for the network representation. However, not all attributes could be obtained in their work for every node and every link of the very large REORIENT network. Where data was missing, assumptions were made based upon expert opinion and/or on data on adjacent network elements. Additionally, assumptions were made on terminal processing times and border procedures.
2.
4
Proposed Services
2.4.1 Service design
Two methods are employed for generating the service routes employed by the scheduling algorithm of the Train Slot Generation Model described in detail in Chapter 5. The first method uses the Route Design model given in Chapter 3. This optimization technique seeks the set of most profitable routes along the corridor and determines the frequency of service for each route and the shipment loading and unloading locations along the route. The second method is to generate service design options based on expert knowledge and market-based research related to the region. Four such expert-generated routes are proposed as shown in Figure 2-13. Description follows.
T1: Halsberg-Trelleborg-Swinoujscie to via Vienna/Bratislava to Budapest T2: Trelleborg-via Swinoujscie to Bratislava/Vienna
2.4.2 Loading points and other scenario attributes
Two levels of loading points are considered for evaluation. ”Conservative” scenarios includes all major ports with major terminals along the service routes. “Intermediate” scenarios considers additional locations, where shipments can be loaded and unloaded. These locations are shown in Figure 2-13.
Chapter 3
Dynamic Intermodal Simulation-Assignment
Platform for REORIENT
3.1 Introduction
between shipper and carrier. In their model the cost function is obtained from a carrier sub-model, a dynamic multi-modal multi-commodity network assignment model using a linear programming (LP) formulation. Guélat et al. (1990) and Crainic et al. (1984) proposed a multi-mode multi-product network freight assignment model for strategic planning, implemented in a Strategic Transportation Analysis tool called STAN, which solves a system optimal assignment problem with the objective of minimizing the total delay at arcs and node transfers. In their model, the operation inside a classification yard is modeled as a queue, and the average delay through the yard is estimated by a delay function, which relates to product types and traffic flows. Under such assumptions, both the arc traversal times and the node transfer delays could be expressed in closed-form analytic functions.
micro-assignment of trips in a way that is directly compatible with activity/trip chaining models of individual and household behavior (Jayakrishnan et al., 1994; Abdelghany and Mahmassani, 2003). Following a similar modeling philosophy, a simulation-assignment based evaluation platform for intermodal freight transportation analysis is introduced in this chapter. The platform is designed to evaluate terminal delays and consolidation policies at classification yards, intermodal transfer terminals, and ports, as well as train and ferry service networks. The platform provides a core analysis capability for the service and operational service scenarios defined for the selected REORIENT corridor, as described in Chapter 1.
train length and service time distributions.
All of the above queueing models eventually come to some analytical function with respect to inbound and outbound train flows, which is applicable for an aggregated network or yard operations without depicting the individual characteristics or activity logs of each railcar for each yard. To capture important features of real world yard operations at a tactical level, the batch (bulk) nature of arrival, service, and departure processes at classification yards needs to be considered. In this regard, Simao and Powell (1992a and 1992b) introduced a queueing network model to simulate stochastic, transient networks of bulk queues that occur in consolidation networks, which can be used in LTL (less than truck load), railroads, subway, and air networks. The unloading queue of inbound vehicles is modeled as a bulk arrival, individual service queue with a first-come-first-served (FCFS) policy and the departure queue for outbound vehicles is modeled as an individual arrival, general dependent bulk service queue. A similar bulk queueing model is applied in this study to represent operations at the classification yards, ports and intermodal terminals.
3.2 Problem Context and Assumptions
Consider a multimodal freight transportation network G(V, A), where V is a finite set of nodes, indexed by v, and A is a finite set of directed arcs, indexed by a. The time period of interest (planning horizon) is discretized into a set of small time intervals, T = {t0, t0 +σ, t0 +2σ,…, t0 +Hσ}, where t0 is the earliest possible departure time from any origin node, σ is a small time interval during which no perceptible changes in traffic conditions and/or travel cost occur, and H is a large number such that the intervals from t0 to t0+Hσ cover the planning horizon T. Each node v∈V is associated with either an intersection in the road (or vehicular) sub-network or a terminal in rail or marine sub-networks. A terminal could be any of the following types: classification yard, port, station, and intermodal transfer terminal. Specific definitions are given later. Each arc a∈A is serviced by only one type of conveyance. In this study, three types of conveyance are considered, that is, truck, train, and ferry. The timetables detailing itineraries of trains and ferries are also given. Information on the itinerary of any train or ferry includes its service route and stop locations, scheduled departure (and/or arrival) times at terminals, and the applicable fares (rates or tariffs).
The following notation and variables are used in this chapter.
O = the set of origin zones.
D = the set of destination zones.
P = the set of product types.
M = the set of modes.
o = origin zone index, o∈O.
p = product type index, p∈P.
, τ = auxiliary mode-path flow solution at iteration n. δ = convergence threshold.
N(δ) = total number of violations. Ω = maximum number of violations.
s = shipment index.
i = alternative index for joint mode and route choice.
) , (s i
V = systematic utility of joint mode and route alternative i to individual shipment s.
i
ASC = alternative specific attributes for alternative i.
A shipment is the smallest unit of cargo (in container or in bulk) that a given shipper wants to transport from a firm (origin) to a market (destination). The time-dependent zonal demands ro,d,τ,p over the planning horizon are assumed known a priori.
A feasible mode m is defined as a sequence of (a least one) conveyances allowing the use of two consecutive conveyances if there is a feasible transfer between them. A feasible joint mode and path alternative is defined as a sequence of arcs that are serviced by available modes with feasible intermodal transfers. Alternative costs are assumed to be additive in link travel times and costs, as well as node (i.e. terminal or intersection) transfer delays and costs. The behavioral assumption made in this study is the following: facing a joint mode and route choice set, a shipper will choose a (intermodal) path k which minimizes that shipper’s generalized cost of transporting a given type of shipment from origin o at time τ to destination d. The generalized cost may include random components in a random utility perspective on shipper’s choice, resulting in a probabilistic choice function for the selection of a mode-path combination. The specification of the mode choice function used in the REORIENT platform was developed under Work Package 6, and is described in detail in the final report of WP 6.1.
3.3 Simulation
-
Assignment Framework
freight traffic simulation (or supply), (2) shippers behavior model, and (3) path processing and shipment assignment. The freight traffic simulator depicts freight flow propagation in the multimodal network, and thus evaluates network performance under a given set of intermodal and route decisions made by the individual shippers. Given shipper behavior parameters, the shipper behavior component describes shipments’ mode and route selection decisions in a stochastic utility maximization framework with multiple evaluation criteria. The third component is intended to generate realistic route choice sets and perform stochastic network loading for solving the shipment assignment problem.
3.3.1 Simulation-assignment solution framework
Details of several components given in italics are provided after the framework description. Figure 3-1 presents an iterative heuristic for solving the intermodal dynamic freight assignment problem with joint mode and route choice. The main steps of the solution algorithm are as follows:
Step 0: Initialization
Step 1: Freight network simulation
Step 2:Computing time-dependent multiple product intermodal least-cost paths
Given time-dependent link travel times, travel costs and mode-transfer delays obtained by the
Multimodal Freight Network Simulator or determined by train and ferry timetable, time-dependent multiple product intermodal least-cost path algorithm finds the least cost paths for each OD pair, each departure time interval, each product type, and each mode.
Step 3: Auxiliary mode-path alternative flow assignment
Compute the utility of choice alternatives and determine the corresponding probability of choosing each mode-path alternative based on multinomial logit choice model. This generates a set of auxiliary mode-path flow solution n
k
Step 4: Update of mode and path assignment
Find the new mode-path flow pattern using a predetermined move size by the method of successive averages (MSA) given in Equation (1):
⎭
Figure 3-1. Simulation-assignment solution framework.
3.3.2 Multimodal network representation and intermodal shortest path
The multimodal freight transportation network includes two kinds of networks: the physical network and the carriers’ service network. The physical network consists of nodes, such as road intersections and terminals (e.g. intermodal transfer terminal, classification yard, siding, port, or border), and links, such as road, rail, and marine links. The service network
for multiple products
n = n + 1
Stop
Convergence checking
Yes No
OD shipment demand and historical paths
Multimodal Freight Network Simulator
Time-dependent intermodal least-cost paths
Mode-path choice and network flow assignment
consists of service routes, such as train routes and ferry routes operating according to train and ferry timetables, providing all carriers’ services (supply) for intermodal freight transportation.
Road intersections and road links are modeled in the same manner as in the DYNASMART simulation-assignment methodology (12). An intermodal transfer terminal is modeled as a transfer node between the road and rail networks, and also permits storage and generation of shipments. A classification yard is modeled as a transfer node, where inbound trains consisting of railcars intended for many destinations are sorted/classified to depart in appropriate outbound trains. A port is modeled as a transfer node between land transportation (truck and rail) and waterway (ferry) and also a place for shipment storage and generation.
With link travel costs and terminal transfer delays for multiple products obtained from the freight traffic simulation component, a time-dependent intermodal least-cost path approach, introduced by Zhou et al. (2005), is extended to a time-dependent multiple product intermodal least-cost path algorithm and is used to generate the joint mode and route alternative set. For each product and each mode, this algorithm calculates the time-dependent intermodal least-cost path tree. Note that while the freight simulation is performed on the physical network, computations of least cost paths are based on both the physical network and the carriers’ service network.
3.3.3 Joint mode and route choice model and network loading
1977, Chiang, 1980, Mahmassani, 2001) have pointed to the relation between shipment size and freight mode selection, particularly for manufacturing enterprises following a classical inventory-theoretic logistics process under stationary conditions. Current trends in modern manufacturing and logistics, especially in high-value added industries, favor a more flexible and dynamic approach oriented towards shorter horizons than typically considered in the inventory-theoretic literature. The modeling platform allows considerable flexibility in terms of representing individual shipper decision processes. In this study, the aggregated demands from shippers are compiled into shipment units that can be carried in containers (with shipment size equal to a TEU) or railcars (i.e. bulk commodities). This study uses a logit-based discrete choice model for joint mode and route choices made by shippers with regard to each shipment (i.e. shippers’ choices are reflected in shipments’ choices). Each alternative (a mode-route combination) can be serviced by one or more carriers, with the costs of switching carriers included in the utility function. For a shipment i, a general formulation of the systematic disutility function can be expressed as:
i
3.4 Multimodal Freight Network Simulator
The problem addressed by the Multimodal Freight Network Simulator can be stated as follows: given a multimodal network with known service supply attributes and time-dependent O-D demands for multiple commodity classes for the network of interest for each mode, the network simulation model determines the resulting flow of shipments on the road, rail, and sea network for the various time intervals of interest, and the associated service levels and network performance experienced by the shipments.
3.4.1 Freight simulator
The simulation platform is shown in Figure 3-2. The network simulator per se consists of two main components: link moving and node/mode transfer, which process, respectively, flow propagation along links, and through nodes/transfer points. A third component, demand generation and loading, prepares the shipments to be loaded and actually loads them onto the network. The three components are described in the following subsections.
3.4.2 Demand generation, consolidation and loading
shortest paths stored after the load-up period, or any paths externally specified in the data or freight assignment component.
At the time of generation, each shipment is assigned a product type: either container unit or bulk unit, based on the specified fraction of each product type. Due to the capacity of different conveyances, the number of shipments whose product type is non-bulk varies by conveyance. This gives rise to a consolidation policy, which is used to load several shipments in one conveyance (number of shipments subject to the capacity of that conveyance) at generation links, intermodal transfer terminals, and ports, where shipments could be loaded in conveyances.
The consolidation policy for non-bulk units requires that: 1. all shipments be of the same product type;
2. all shipments have the same next (intermediate or final) destination, which can be an intermodal transfer terminal, port, or destination zone centroid;
3. all shipments have the same mode between the current position and the next destination;
4. all shipments have the same path node sequence between the current position and the next destination;
5. the probability distribution of the number of shipments in one conveyance is based on the product type and location.
Figure 3-2. Multimodal freight network simulator.
Truck transfers at road intersections; Train transfers at intermediate stations; Mode transfers at intermodal transfer terminals, classification yards, and ports. t = t + 1
3.4.3 Link moving
During this procedure, the movement of conveyances on the links are simulated according to the speeds of the respective modes. Trucks are moved on the links according to the prevailing speeds. Shuttle trains are moved according to a preset constant speed. Trains and ferries are moved along their respective links according to the given timetables. Delays incurred by shipments on rail links due to meets and overtakes are assumed to be reflected in the given train timetables. This assumption is reasonable for international intermodal freight transportation, where the majority of delays occur at the terminals rather than on the links. For example, in 1996, on average, only 14% of the time taken for a shipment to go from its shipper to consignee was spent on a moving train, and the remainder was at classification yards (Patty, 2001).
3.4.4 Node transfer
Terminal Processes
Node (or terminal) processes, such as sorting in classification yards, loading and unloading in intermodal terminals and ports, contribute a significant portion of total delays. In the present platform, these processes are simulated to estimate the delays that are eventually used in the intermodal shortest path calculations.
pushing the train over the hump in a hump yard or by the switching engines in a flat yard. After classification, the sorted railcars (blocks) wait for dispatch on an appropriate outbound train. The schedule of the outbound train determines the start of the assembly operation for the blocks assigned to that train. After the cut-off time for a departing train occurs, the outbound train is assembled or marshaled on the departure track. Trains then depart to the next yard or to the nearest intermodal terminal or port if shipments are to be transferred to other modes.
Transfers of shipments among rail, road and sea modes are carried out at ports and intermodal terminals. Ports have access to different transport modes: deep sea vessels, barges, trains and trucks. Transshipment processes (loading and unloading) at a port, elaborated in Vis and Koster (2003),generally consist of a three-piece operation: ship to quay with gantry crane, quay to stack with MAFI trailer and reach-stacker and stack to rail wagon/truck with reach-stacker. Direct transfer of shipments is possible if an appropriate outbound vehicle is available during the unloading time, in which case shipments need not be stacked in storage areas.
Bulk queueing model
As discussed above, real world operations at all kinds of terminals are complicated and differ from one terminal to another. To capture the main characteristics of each terminal, while maintaining generality to be able to apply to all terminals, a bulk queueing model is developed to represent terminal transfer processes and evaluate terminal delay. We associate each terminal with a queueing server with known service (time) distributions. A generalized bulk queueing model is used to model terminal transfer processes as in Fig. 3-3. This model is similar to the one presented by Simao and Powell (Simäo and Powell, 1992a; Simäo and Powell, 1992b). There are two kinds of queueing elements in this study: railcars for classification yards, and shipments for intermodal terminal and ports.
Bulk arrival Bulk departure
Server Bulk arrival 1
... ...
Bulk arrival m
Arrival queue
Departure queue 1
... ...
Departure queue n
Bulk departure
Bulk departure
Bulk departure
Figure 3-3. Generalized bulk queueing model.
(1) Arrival queue ( / x/1
Since trains, ferries or trucks carry several shipments as they arrive at the terminals, the arrival of elements at the terminals is assumed to follow a bulk-arrival process (Gx). Elements (e.g. railcars with specified shipment(s) and destination) queue on the inbound links and are assumed to be served by a single super server. Type of service, service time and cost for the elements depends on the terminal type.
For classification yards, bulk service process (Gx) is assumed as railcars belonging to a train are processed at a time. Service times at classification yards reflect the time required for inspection, classification and assembly of the railcars into trains as shown in Figure 3-4. The bulk service process is sensitive to the facilities available at the yards including number of switch engines, number of tracks. Service times can also vary with product type reflecting the operating conditions.
Figure 3-4. Processes at a classification yard.
terminals, e.g. number of cranes, and the loading and unloading rates for ferries, trains, and trucks.
Elements (railcars or shipments) in the arrival queue are processed to estimate the earliest possible departure time (EPDT) for each element.
i i i
EPDTi = Earliest Possible Departure Time for element i (same for all elements in
same bulk); destination, EPDT, and priority of the elements, respectively, to generate departure queue for the particular outbound link. The capacity of the outbound vehicle determines the number of elements that depart (bulk-departure, y
The schedule delay of an element i is calculated as follows:
SDi = ADTi - EPDTi (4)
where,
SDi = Schedule Delay for element i;
ADTi = Actual Departure Time for element i based on bulk departure time (e.g.
timetable);
Gx = general bulk arrival process;
GDy = general dependent service process based on bulk departure time (e.g. timetable);
Figure 3-5. Processes at a port.
3.5 Concluding Remarks
methodological structure of the platform consists of three components: multimodal freight network simulation component, multimodal freight assignment component, and a multiple product intermodal shortest path procedure. The multimodal freight network simulation component uses a bulk queueing model to simulate transfer delay experienced by each shipment, and the operations at intermodal transfer terminal, classification yard, and port. The multimodal freight assignment component determines the network flow pattern from a mode-path alternative set calculated by the multiple product intermodal shortest mode-path procedure based on the link travel cost and node transfer delay from the multimodal freight network simulation component. This model can represent individual shipment mode-path choice behavior, consolidation policy, conveyance link moving, and individual shipment terminal transfer in an iterative solution framework.
Chapter 4
A Route Design Problem for the
REORIENT Corridor
4.1 Introduction
This chapter describes how we consider the general problem of designing a freight transportation service on a rail network. We are given the network topology, the characteristics of the existing line segments in terms of length, technical limitation, average commercial speed, etc. We are also given the position of terminals or shunting yards on the rail network, which are points where goods enter and exit the network. Moreover, we are given the service demand, i.e. an assessment of the number of wagons which might be moved from origin to destination terminals in the network. Wagons are not all identical, being filled with goods that may have different values, requested transit times, etc.