WHO Child Growth Standards
WHO Child Growth Standards
1 year
2 years
3 years
4 years
5 years
Length/height-for-age, weight-for-age, weight-for-length,
weight-for-height and body mass index-for-age
WHO Child Growth Standards
Length/height-for-age, weight-for-age, weight-for-length,
weight-for-height and body mass index-for-age
Methods and development
WHO Library Cataloguing-in-Publication Data
WHO child growth standards : length/height-for-age, age, length, weight-for-height and body mass index-for-age : methods and development.
Coordinating team: Mercedes de Onis ... [et al.].
1. Anthropometry. 2. Anthropometry - methods. 3. Body weights and measures - standards. 4. Child development. 5. Growth. 6. Reference standards. 7. Nutrition assessment. I. de Onis, Mercedes. II. World Health Organization. III. Title: World Health Organization child growth standards.
ISBN 92 4 154693 X (NLM classification: WS 103)
© World Health Organization 2006
All rights reserved. Publications of the World Health Organization can be obtained from WHO Press, World Health Organization, 20 Avenue Appia, 1211 Geneva 27, Switzerland (tel: +41 22 791 3264; fax: +41 22 791 4857; email: [email protected]). Requests for permission to reproduce or translate WHO publications – whether for sale or for noncommercial distribution – should be addressed to WHO Press, at the above address (fax: +41 22 791 4806; email:
The designations employed and the presentation of the material in this publication do not imply the expression of any opinion whatsoever on the part of the World Health Organization
concerning the legal status of any country, territory, city or area or of its authorities, or concerning the delimitation of its frontiers or boundaries. Dotted lines on maps represent approximate border lines for which there may not yet be full agreement.
The mention of specific companies or of certain manufacturers’ products does not imply that they are endorsed or recommended by the World Health Organization in preference to others of a similar nature that are not mentioned. Errors and omissions excepted, the names of
proprietary products are distinguished by initial capital letters.
All reasonable precautions have been taken by WHO to verify the information contained in this publication. However, the published material is being distributed without warranty of any kind, either express or implied. The responsibility for the interpretation and use of the material lies with the reader. In no event shall the World Health Organization be liable for damages arising from its use.
Members of the WHO Multicentre Growth Reference Study Group
Coordinating Team
Mercedes de Onis [Study Coordinator], Adelheid Onyango, Elaine Borghi, Amani Siyam, Alain Pinol (Department of Nutrition for Health and Development, World Health Organization).
Executive Committee
Cutberto Garza [Chair], Mercedes de Onis, Jose Martines, Reynaldo Martorell, Cesar G. Victora (up to October 2002), Maharaj K. Bhan (from November 2002).
Steering Committee
Coordinating Centre (WHO, Geneva): Mercedes de Onis, Jose Martines, Adelheid Onyango, Alain Pinol.
Investigators (by country): Cesar G. Victora and Cora Luiza Araújo (Brazil), Anna Lartey and William B. Owusu (Ghana), Maharaj K. Bhan and Nita Bhandari (India), Kaare R. Norum and Gunn-Elin Aa. Bjoerneboe (Norway), Ali Jaffer Mohamed (Oman), Kathryn G. Dewey (USA).
United Nations Agency Representatives: Cutberto Garza (UNU), Krishna Belbase (UNICEF).
Advisory Group
Maureen Black, Wm. Cameron Chumlea, Tim Cole, Edward Frongillo, Laurence Grummer-Strawn, Reynaldo Martorell, Roger Shrimpton, Jan Van den Broeck. For the work presented in this document, Huiqi Pan, Robert Rigby, Mikis Stasinopoulos and Stef van Buuren, participated in an advisory capacity.
Participating countries and investigators
Brazil:Cora Luiza Araújo, Cesar G. Victora, Elaine Albernaz, Elaine Tomasi, Rita de Cássia Fossati da Silveira, Gisele Nader (Departamento de Nutrição and Departamento de Medicina Social, Universidade Federal de Pelotas; and Núcleo de Pediatria and Escola de Psicologia, Universidade Católica de Pelotas).
Ghana: Anna Lartey, William B. Owusu, Isabella Moses, Veronica Gomez, Charles Sagoe-Moses (Department of Nutrition and Food Science, University of Ghana; and Ghana Health Service).
India: Nita Bhandari, Maharaj K. Bhan, Sunita Taneja, Temsunaro Rongsen, Jyotsna Chetia, Pooja Sharma, Rajiv Bahl (All India Institute of Medical Sciences).
Norway: Gunn-Elin Aa. Bjoerneboe, Anne Baerug, Elisabeth Tufte, Kaare R. Norum, Karin Rudvin, Hilde Nysaether (Directorate of Health and Social Affairs; National Breastfeeding Centre, Rikshospitalet University Hospital; and Institute for Nutrition Research, University of Oslo).
Oman: Ali Jaffer Mohamed, Deena Alasfoor, Nitya S. Prakash, Ruth M. Mabry, Hanadi Jamaan Al Rajab, Sahar Abdou Helmi (Ministry of Health).
iv
Acknowledgements
The WHO Child Growth Standards were constructed by the Coordinating Team in the Department of Nutrition for Health and Development of the World Health Organization.
The Study Group is indebted to the parents, children and more than 200 field staff that participated in the WHO Multicentre Growth Reference Study. The generous contribution of many individuals that provided expertise and advice was also crucial to the development of the growth standards.
Contents
Executive summary xvii
1. Introduction 1
2. Methodology 3
2.1 Design of the WHO Multicentre Growth Reference Study 3
2.2 Anthropometry methods 3
2.3 Sample description 4
2.4 Data cleaning procedures and exclusions 5
2.5 Statistical methods for constructing the growth curves 7
3. Construction of the length/height-for-age standards 13
3.1 Indicator-specific methodology 13
3.2 Length/height-for-age for boys 13
3.2.1 Sample size 13
3.2.2 Model selection and results 14
3.2.3 WHO standards and their comparison with NCHS and CDC 2000 references 32 Charts 33 Tables 37
Comparison with NCHS 45
Comparison with CDC 2000 46
3.3 Length/height-for-age for girls 47
3.3.1 Sample size 47
3.3.2 Model selection and results 47
3.3.3 WHO standards and their comparison with NCHS and CDC 2000 references 59 Charts 60 Tables 64
Comparison with NCHS 72
Comparison with CDC 2000 73
3.4 Comparisons between boys and girls 74
3.4.1 WHO 75
3.4.2 NCHS 76
3.4.3 CDC 2000 77
4. Construction of the weight-for-age standards 79
4.1 Indicator-specific methodology 79
4.2 Weight-for-age for boys 79
4.2.1 Sample size 79
4.2.2 Model selection and results 79
4.2.3 WHO standards and their comparison with NCHS and CDC 2000 references 94 Charts 95 Tables 97
Comparison with NCHS 105
Comparison with CDC 2000 106
4.3 Weight-for-age for girls 107
4.3.1 Sample size 107
4.3.2 Model selection and results 107
4.3.3 WHO standards and their comparison with NCHS and CDC 2000 references 122 Charts 123 Tables 125
Comparison with NCHS 133
Comparison with CDC 2000 134
4.4 Comparisons between boys and girls 135
vi
4.4.3 CDC 2000 138
5. Construction of the weight-for-length and weight-for-height standards 139
5.1 Indicator-specific methodology 139
5.2 Weight-for-length/height for boys 139
5.2.1 Sample size 139
5.2.2 Model selection and results 140
5.2.3 WHO standards and their comparison with NCHS and CDC 2000 references 153 Charts 154 Tables 158
Comparison with NCHS 176
Comparison with CDC 2000 178
5.3 Weight-for-length/height for girls 180
5.3.1 Sample size 180
5.3.2 Model selection and results 180
5.3.3 WHO standards and their comparison with NCHS and CDC 2000 references 194 Charts 195 Tables 199
Comparison with NCHS 217
Comparison with CDC 2000 219
5.4 Comparisons between boys and girls 221
5.4.1 WHO 222
5.4.2 NCHS 224
5.4.3 CDC 2000 226
6. Construction of the body mass index-for-age standards 229
6.1 Indicator-specific methodology 229
6.2 BMI-for-age for boys 230
6.2.1 Sample size 230
6.2.2 Model selection and results 230
Length-based BMI-for-age for boys 230
Height-based BMI-for-age for boys 241
6.2.3 WHO standards and their comparison with CDC 2000 reference 249 Charts 250 Tables 254
Comparison with CDC 2000 262
6.3 BMI-for-age for girls 263
6.3.1 Sample size 263
6.3.2 Model selection and results 263
Length-based BMI-for-age for girls 263
Height-based BMI-for-age for girls 275
6.3.3 WHO standards and their comparison with CDC 2000 reference 284 Charts 285 Tables 289
Comparison with CDC 2000 297
6.4 Comparisons between boys and girls 298
6.4.1 WHO 299
6.4.2 CDC 2000 300
7. Computation of centiles and z-scores for length/height-for-age, weight-for-age,
weight-for-length, weight-for-height and BMI-for-age 301
8. Conclusion 305
9. Bibliography 309
Figures
Figure 1 Worm plots of z-scores for candidate model with df(µ)=11 and df(σ)=6
with age transformation age0.35 for length/height-for-age for boys 16
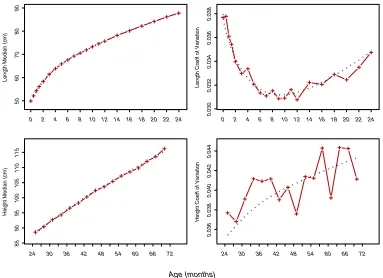
Figure 2 Fitting of µ and σ curves of Model 1 for length/height-for-age for boys
(dotted line) and their respective sample estimates (points with solid line) 17
Figure 3 Centile residuals from fitting Model 1 for length/height-for-age from
0 to 24 months for boys 18
Figure 4 Centile residuals from fitting Model 1 for length/height-for-age from
24 to 71 months for boys 18
Figure 5 Worm plots of z-scores for Model 1 for length/height-for-age for boys 19
Figure 6 Worm plots of z-scores for Model 2 for length/height-for-age for boys 24
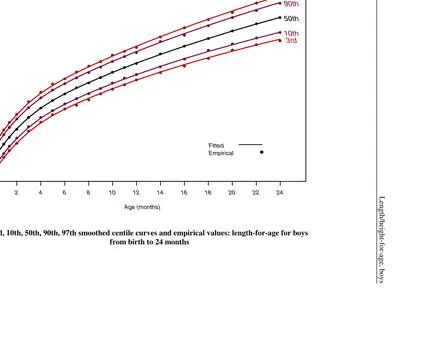
Figure 7 3rd, 10th, 50th, 90th, 97th smoothed centile curves and empirical values:
length-for-age for boys from birth to 24 months 28
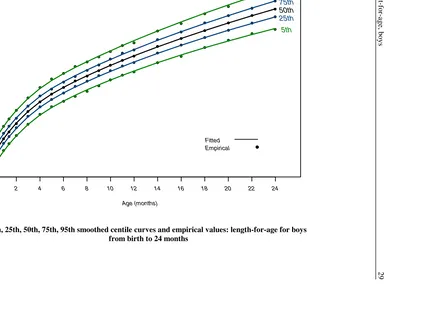
Figure 8 5th, 25th, 50th, 75th, 95th smoothed centile curves and empirical values:
length-for-age for boys from birth to 24 months 29
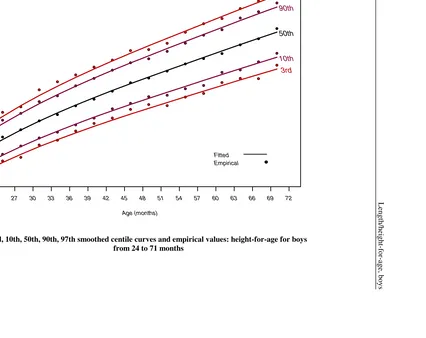
Figure 9 3rd, 10th, 50th, 90th, 97th smoothed centile curves and empirical values:
height-for-age for boys from 24 to 71 months 30
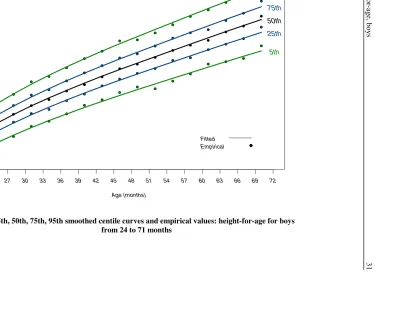
Figure 10 5th, 25th, 50th, 75th, 95th smoothed centile curves and empirical values:
height-for-age for boys from 24 to 71 months 31
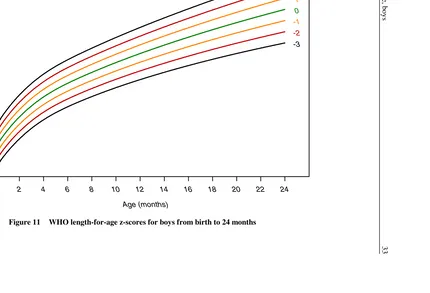
Figure 11 WHO length-for-age z-scores for boys from birth to 24 months 33
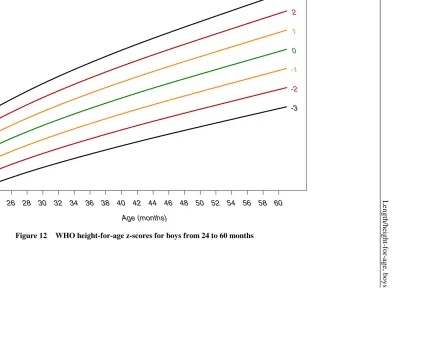
Figure 12 WHO height-for-age z-scores for boys from 24 to 60 months 34
Figure 13 WHO length-for-age percentiles for boys from birth to 24 months 35
Figure 14 WHO height-for-age percentiles for boys from 24 to 60 months 36
Figure 15 Comparison of WHO with NCHS length/height-for-age z-scores for boys 45
Figure 16 Comparison of WHO with CDC 2000 length/height-for-age z-scores for boys 46
Figure 17 Fitting of the µ and σ curves of Model 1 for length/height-for-age for girls
(dotted line) and their respective sample estimates (points with solid line) 49
Figure 18 Centile residuals from fitting Model 1 for length/height-for-age from
0 to 24 months for girls 50
Figure 19 Centile residuals from fitting Model 1 for length/height-for-age from
24 to 71 months for girls 50
Figure 20 Worm plots of z-scores for Model 1 for length/height-for-age for girls 51
Figure 21 3rd, 10th, 50th, 90th, 97th smoothed centile curves and empirical values:
length-for-age for girls from birth to 24 months 55
Figure 22 5th, 25th, 50th, 75th, 95th smoothed centile curves and empirical values:
length-for-age for girls from birth to 24 months 56
Figure 23 3rd, 10th, 50th, 90th, 97th smoothed centile curves and empirical values:
height-for-age for girls from 24 to 71 months 57
Figure 24 5th, 25th, 50th, 75th, 95th smoothed centile curves and empirical values:
height-for-age for girls from 24 to 71 months 58
viii
Figure 27 WHO length-for-age percentiles for girls from birth to 24 months 62
Figure 28 WHO height-for-age percentiles for girls from 24 to 60 months 63
Figure 29 Comparison of WHO with NCHS length/height-for-age z-scores for girls 72
Figure 30 Comparison of WHO with CDC 2000 length/height-for-age z-scores for girls 73
Figure 31 Comparison of boys' and girls' WHO length/height-for-age z-scores 75
Figure 32 Comparison of boys' and girls' NCHS length/height-for-age z-scores 76
Figure 33 Comparison of boys' and girls' CDC 2000 length/height-for-age z-scores 77
Figure 34 Worm plots of z-scores for Model 1 for weight-for-age for boys 81
Figure 35 Fitting of the µ, σ, and ν curves of Model 2 for weight-for-age for boys from 0 to 71 months (dotted line) and their respective sample estimates
(points with solid line) 84
Figure 36 Centile residuals from fitting Model 2 for weight-for-age from
0 to 24 months for boys 85
Figure 37 Centile residuals from fitting Model 2 for weight-for-age from
24 to 71 months for boys 85
Figure 38 Worm plots of z-scores for Model 2 for weight-for-age for boys 86
Figure 39 3rd, 10th, 50th, 90th, 97th smoothed centile curves and empirical values:
weight-for-age for boys from birth to 24 months 90
Figure 40 5th, 25th, 50th, 75th, 95th smoothed centile curves and empirical values:
weight-for-age for boys from birth to 24 months 91
Figure 41 3rd, 10th, 50th, 90th, 97th smoothed centile curves and empirical values:
weight-for-age for boys from 24 to 71 months 92
Figure 42 5th, 25th, 50th, 75th, 95th smoothed centile curves and empirical values:
weight-for-age for boys from 24 to 71 months 93
Figure 43 WHO weight-for-age z-scores for boys from birth to 60 months 95
Figure 44 WHO weight-for-age percentiles for boys from birth to 60 months 96
Figure 45 Comparison of WHO with NCHS weight-for-age z-scores for boys 105
Figure 46 Comparison of WHO with CDC 2000 weight-for-age z-scores for boys 106
Figure 47 Cubic splines fitted for the ν curve with varying numbers of degrees of freedom 110
Figure 48 Fitting of the µ, σ, and ν curves of Model 3 for weight-for-age for girls from 0 to 71 months (dotted line) and their respective sample estimates
(points with solid line) 113
Figure 49 Centile residuals from fitting Model 3 for weight-for-age from
0 to 24 months for girls 114
Figure 50 Centile residuals from fitting Model 3 for weight-for-age from
24 to 71 months for girls 114
Figure 51 Worm plots of z-scores for Model 3 for weight-for-age for girls 115
Figure 52 3rd, 10th, 50th, 90th, 97th smoothed centile curves and empirical values:
weight-for-age for girls from birth to 24 months 118
Figure 53 5th, 25th, 50th, 75th, 95th smoothed centile curves and empirical values:
Figure 54 3rd, 10th, 50th, 90th, 97th smoothed centile curves and empirical values:
weight-for-age for girls from 24 to 71 months 120
Figure 55 5th, 25th, 50th, 75th, 95th smoothed centile curves and empirical values:
weight-for-age for girls from 24 to 71 months 121
Figure 56 WHO weight-for-age z-scores for girls from birth to 60 months 123
Figure 57 WHO weight-for-age percentiles for girls from birth to 60 months 124
Figure 58 Comparison of WHO with NCHS weight-for-age z-scores for girls 133
Figure 59 Comparison of WHO with CDC 2000 weight-for-age z-scores for girls 134
Figure 60 Comparison of boys' and girls' WHO weight-for-age z-scores 136
Figure 61 Comparison of boys' and girls' NCHS weight-for-age z-scores 137
Figure 62 Comparison of boys' and girls' CDC 2000 weight-for-age z-scores 138
Figure 63 Worm plots of z-scores for Model 1 for weight-for-length/height for boys 141
Figure 64 Fitting of the µ, σ, and ν curves of Model 2 for weight-for-length/height for boys (dotted line) and their respective sample estimates (points with
solid line) 143
Figure 65 Centile residuals from fitting Model 2 for weight-for-length/height for boys 144
Figure 66 Worm plots of z-scores for Model 2 for weight-for-length/height for boys 146
Figure 67 3rd, 10th, 50th, 90th, 97th smoothed centile curves and empirical values:
weight-for-length for boys 149
Figure 68 5th, 25th, 50th, 75th, 95th smoothed centile curves and empirical values:
weight-for-length for boys 150
Figure 69 3rd, 10th, 50th, 90th, 97th smoothed centile curves and empirical values:
weight-for-height for boys 151
Figure 70 5th, 25th, 50th, 75th, 95th smoothed centile curves and empirical values:
weight-for-height for boys 152
Figure 71 WHO weight-for-length z-scores for boys from 45 to 110 cm 154
Figure 72 WHO weight-for-height z-scores for boys from 65 to 120 cm 155
Figure 73 WHO weight-for-length percentiles for boys from 45 to 110 cm 156
Figure 74 WHO weight-for-height percentiles for boys from 65 to 120 cm 157
Figure 75 Comparison of WHO with NCHS weight-for-length z-scores for boys 176
Figure 76 Comparison of WHO with NCHS weight-for-height z-scores for boys 177
Figure 77 Comparison of WHO with CDC 2000 weight-for-length z-scores for boys 178
Figure 78 Comparison of WHO with CDC 2000 weight-for-height z-scores for boys 179
Figure 79 Fitting of the µ, σ, and ν curves of Model 2 for weight-for-length/height for girls (dotted line) and their respective sample estimates (points with
solid line) 183
Figure 80 Centile residuals from fitting Model 2 for weight-for-length/height for girls 184
Figure 81 Worm plots of z-scores for Model 2 for weight-for-length/height for girls 186
Figure 82 3rd, 10th, 50th, 90th, 97th smoothed centile curves and empirical values:
x
Figure 83 5th, 25th, 50th, 75th, 95th smoothed centile curves and empirical values:
weight-for-length for girls 191
Figure 84 3rd, 10th, 50th, 90th, 97th smoothed centile curves and empirical values:
weight-for-height for girls 192
Figure 85 5th, 25th, 50th, 75th, 95th smoothed centile curves and empirical values:
weight-for-height for girls 193
Figure 86 WHO weight-for-length z-scores for girls 195
Figure 87 WHO weight-for-height z-scores for girls 196
Figure 88 WHO weight-for-length percentiles for girls 197
Figure 89 WHO weight-for-height percentiles for girls 198
Figure 90 Comparison of WHO with NCHS weight-for-length z-scores for girls 217
Figure 91 Comparison of WHO with NCHS weight-for-height z-scores for girls 218
Figure 92 Comparison of WHO with CDC 2000 weight-for-length z-scores for girls 219
Figure 93 Comparison of WHO with CDC 2000 weight-for-height z-scores for girls 220
Figure 94 Comparison of boys' and girls' WHO weight-for-length z-scores 222
Figure 95 Comparison of boys' and girls' WHO weight-for-height z-scores 223
Figure 96 Comparison of boys' and girls' NCHS weight-for-length z-scores 224
Figure 97 Comparison of boys' and girls' NCHS weight-for-height z-scores 225
Figure 98 Comparison of boys' and girls' CDC 2000 weight-for-length z-scores 226
Figure 99 Comparison of boys' and girls' CDC 2000 weight-for-height z-scores 227
Figure 100 Worm plots of z-scores for Model 1 for length-based BMI-for-age for boys 232
Figure 101 Fitting of the µ, σ, and ν curves of Model 2 for length-based BMI-for-age from 0 to 24 months for boys (dotted line) and their respective sample
estimates (points with solid line) 234
Figure 102 Centile residuals from fitting Model 2 for length-based BMI-for-age from
0 to 24 months for boys 235
Figure 103 Worm plots of z-scores for Model 2 for length-based BMI-for-age for boys 236
Figure 104 3rd, 10th, 50th, 90th, 97th smoothed centile curves and empirical values:
length-based BMI-for-age for boys from birth to 24 months 239
Figure 105 5th, 25th, 50th, 75th, 95th smoothed centile curves and empirical values:
length-based BMI-for-age for boys from birth to 24 months 240
Figure 106 Fitting of the µ, σ, and ν curves of Model 1 for height-based BMI-for-age from 18 to 71 months for boys (dotted line) and their respective sample
estimates (points with solid line) 242
Figure 107 Centile residuals from fitting Model 1 for height-based BMI-for-age from
18 to 71 months for boys 243
Figure 108 Worm plots of z-scores for Model 1 for height-based BMI-for-age for boys 246
Figure 109 3rd, 10th, 50th, 90th, 97th smoothed centile curves and empirical values:
height-based BMI-for-age for boys from 24 to 71 months 247
Figure 110 5th, 25th, 50th, 75th, 95th smoothed centile curves and empirical values:
Figure 111 WHO length-based BMI-for-age z-scores for boys from birth to 24 months 250
Figure 112 WHO height-based BMI-for-age z-scores for boys from 24 to 60 months 251
Figure 113 WHO length-based BMI-for-age percentiles for boys from birth to 24 months 252
Figure 114 WHO height-based BMI-for-age percentiles for boys from 24 to 60 months 253
Figure 115 Comparison of WHO with CDC 2000 BMI-for-age z-scores for boys 262
Figure 116 Cubic splines fitted for the σ curve with varying numbers of degrees of freedom 265
Figure 117 Worm plots of z-scores for Model 1 for length-based BMI-for-age for girls 267
Figure 118 Fitting of the µ, σ, and ν curves of Model 2 for length-based BMI-for-age from 0 to 24 months for girls (dotted line) and their respective sample
estimates (points with solid line) 268
Figure 119 Centile residuals from fitting Model 2 for length-based BMI-for-age from
0 to 24 months for girls 269
Figure 120 Worm plots of z-scores for Model 2 for length-based BMI-for-age for girls 270
Figure 121 3rd, 10th, 50th, 90th, 97th smoothed centile curves and empirical values:
length-based BMI-for-age for girls from birth to 24 months 273
Figure 122 5th, 25th, 50th, 75th, 95th smoothed centile curves and empirical values:
length-based BMI-for-age for girls from birth to 24 months 274
Figure 123 Cubic splines fitted for the µ curve with varying numbers of degrees of freedom 276
Figure 124 Fitting of the µ, σ, and ν curves of Model 1 for height-based BMI-for-age from 18 to 71 months for girls (dotted line) and their respective sample
estimates (points with solid line) 277
Figure 125 Centile residuals from fitting Model 1 for height-based BMI-for-age from
18 to 71 months for girls 278
Figure 126 Worm plots of z-scores for Model 1 for height-based BMI-for-age for girls 279
Figure 127 3rd, 10th, 50th, 90th, 97th smoothed centile curves and empirical values:
height-based BMI-for-age for girls from 24 to 71 months 282
Figure 128 5th, 25th, 50th, 75th, 95th smoothed centile curves and empirical values:
height-based BMI-for-age for girls from 24 to 71 months 283
Figure 129 WHO length-based BMI-for-age z-scores for girls from birth to 24 months 285
Figure 130 WHO height-based BMI-for-age z-scores for girls from 24 to 60 months 286
Figure 131 WHO length-based BMI-for-age percentiles for girls from birth to 24 months 287
Figure 132 WHO height-based BMI-for-age percentiles for girls from 24 to 60 months 288
Figure 133 Comparison of WHO with CDC 2000 BMI-for-age z-scores for girls 297
Figure 134 Comparison of boys' and girls' WHO BMI-for-age z-scores 299
Figure 135 Comparison of boys' and girls' CDC 2000 BMI-for-age z-scores 300
xii
Tables
Table 1 Total sample and number of compliant children in the longitudinal component 4
Table 2 Comparison of mean size at birth for compliant newborns and those that
contributed only birth measurements 5
Table 3 Total sample of children in the cross-sectional component 5
Table 4 Total sample of children in the cross-sectional component by number of
visits and total number of records 5
Table 5 Number of observations by sex and study component included and excluded
on the basis of weight-for-length/height 6
Table 6 Number of observations used in the construction of the WHO child growth
standards by sex and anthropometric indicator 7
Table 7 Interpretation of various patterns in the worm plot 10
Table 8 Summary of differences between recumbent length and standing height in
a sample of children measured both ways 13
Table 9 Longitudinal sample sizes for length/height-for-age for boys 14
Table 10 Cross-sectional sample sizes for length/height-for-age for boys 14
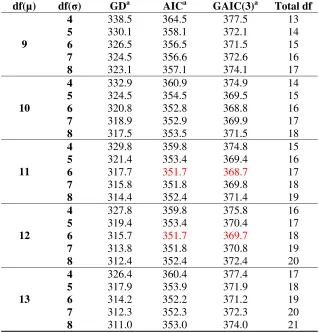
Table 11 Global deviance (GD) for models within the class BCPE(x=ageλ, df(µ)=10,
df(σ)=6, ν=1, τ=2) for length/height-for-age for boys 14
Table 12 Goodness-of-fit summary for models using the BCPE distribution with
fixed ν=1 and τ=2 for length/height-for-age for boys 15
Table 13 Observed proportions of children with measurements below the fitted
centiles from Model 1, length/height-for-age for boys 20
Table 14 Q-test for z-scores from Model 1 [BCPE(x=age0.35, df(µ)=12, df(σ)=6,
ν=1, τ=2)] for length/height-for-age for boys 22
Table 15 Goodness-of-fit summary for models BCPE(x=age0.35, df(µ)=12, df(σ)=6,
df(ν)=?, τ=2) for length/height-for-age for boys 23
Table 16 Q-test for z-scores from Model 2 [BCPE(x=age0.35, df(µ)=12, df(σ)=6,
df(ν)=6, τ=2)] for length/height-for-age for boys 25 Table 17 Observed proportions of children with measurements below the fitted
centiles from Model 2, length/height-for-age for boys 26
Table 18 Length-for-age for boys, age in weeks 37
Table 19 Length-for-age for boys, age in years and months 39
Table 20 Height-for age for boys, age in years and months 41
Table 21 Longitudinal sample sizes for length/height-for-age for girls 47
Table 22 Cross-sectional sample sizes for length/height-for-age for girls 47
Table 23 Global deviance (GD) for models within the class BCPE(x=ageλ, df(µ)=10,
df(σ)=6, ν=1, τ=2) for length/height-for-age for girls 48
Table 24 Goodness-of-fit summary for models using the BCPE distribution with fixed
ν=1 and τ=2 for length/height-for-age for girls 48 Table 25 Observed proportions of children with measurements below the fitted
Table 26 Q-test for z-scores from Model 1 [BCPE(x=age0.35, df(µ)=10, df(σ)=5,
ν=1, τ=2)] for length/height-for-age for girls 54
Table 27 Length-for-age for girls, age in weeks 64
Table 28 Length-for-age for girls, age in years and months 66
Table 29 Height-for-age for girls, age in years and months 68
Table 30 Longitudinal sample sizes for weight-for-age for boys 79
Table 31 Cross-sectional sample sizes for weight-for-age for boys 79
Table 32 Global deviance (GD) for models within the class BCPE(x=ageλ, df(µ)=9,
df(σ)=4, df(ν)=4, τ=2) for weight-for-age for boys 80
Table 33 Goodness-of-fit summary for models using the BCPE distribution with
fixed ν=1 and τ=2 for weight-for-age for boys 80
Table 34 Q-test for z-scores from Model 1 [BCPE(x=age0.35, df(µ)=11, df(σ)=7,
ν=1, τ=2)] for weight-for-age for boys 82 Table 35 Goodness-of-fit summary for models BCPE(x=age0.35, df(µ)=11, df(σ)=7,
df(ν)=?, τ=2) for weight-for-age for boys 83
Table 36 Q-test for z-scores from Model 2 [BCPE(x=age0.35, df(µ)=11, df(σ)=7,
df(ν)=2, τ=2)] for weight-for-age for boys 87
Table 37 Observed proportions of children with measurements below the fitted
centiles from Model 2, weight-for-age for boys 88
Table 38 Weight-for-age for boys, age in weeks 97
Table 39 Weight-for-age for boys, age in years and months 99
Table 40 Longitudinal sample sizes for weight-for-age for girls 107
Table 41 Cross-sectional sample sizes for weight-for-age for girls 107
Table 42 Global deviance (GD) for models within the class BCPE(x=ageλ, df(µ)=9,
df(σ)=4, df(ν)=4, τ=2) for weight-for-age for girls 108
Table 43 Goodness-of-fit summary for models using the BCPE distribution with
fixed ν=1 and τ=2 for weight-for-age for girls 108
Table 44 Q-test for z-scores from Model 1 [BCPE(x=age0.35, df(µ)=11, df(σ)=7,
ν=1, τ=2)] for weight-for-age for girls 109 Table 45 Goodness-of-fit summary for models BCPE(x= age0.35, df(µ)=11, df(σ)=7,
df(ν)=?, τ=2) for weight-for-age for girls 110
Table 46 Q-test for z-scores from Model 2 [BCPE(x=age0.35, df(µ)=11, df(σ)=7,
df(ν)=5, τ=2)] for weight-for-age for girls 111
Table 47 Q-test for z-scores from Model 3 [BCPE(x=age0.35, df(µ)=11, df(σ)=7,
df(ν)=3, τ=2)] for weight-for-age for girls 112 Table 48 Observed proportions of children with measurements below the fitted
centiles from Model 3, weight-for-age for girls 116
Table 49 Weight-for-age for girls, age in weeks 125
Table 50 Weight-for-age for girls, age in years and months 127
Table 51 Sample sizes for boys' weight-for-length/height by length interval 139
xiv
Table 53 Q-test for z-scores from Model 1 [BCPE(x=length (or height+0.7),
df(µ)=13, df(σ)=6, ν=1, τ=2)] for weight-for-length/height for boys 142 Table 54 Goodness-of-fit summary for models BCPE(x=length (or height+0.7),
df(µ)=13, df(σ)=6, df(ν)=?, τ=2) for weight-for-length/height for boys 142 Table 55 Q-test for z-scores from Model 2 [BCPE(x=length (or height+0.7),
df(µ)=13, df(σ)=6, df(ν)=1, τ=2)] for weight-for-length/height for boys 145
Table 56 Observed proportions of children with measurements below the fitted
centiles from Model 2, weight-for-length/height for boys 147
Table 57 Weight-for-length for boys 158
Table 58 Weight-for-height for boys 168
Table 59 Sample sizes for girls' weight-for-length/height by length interval 180
Table 60 Goodness-of-fit summary for models using the BCPE distribution with
fixed ν=1 and τ=2 for weight-for-length/height for girls 181
Table 61 Q-test for z-scores from Model 1 [BCPE(x=length (or height+0.7),
df(µ)=12, df(σ)=4, ν=1, τ=2)] for weight-for-length/height for girls 182
Table 62 Goodness-of-fit summary for models BCPE(x=length (or height+0.7),
df(µ)=12, df(σ)=4, df(ν)=?, τ=2) for weight-for-length/height for girls 183
Table 63 Q-test for z-scores from Model 2 [BCPE(x=length (or height+0.7),
df(µ)=12, df(σ)=4, df(ν)=1, τ=2)] for weight-for-length/height for girls 185
Table 64 Q-test for z-scores from model BCPE(x=length (or height+0.7), df(µ)=12,
df(σ)=4, df(ν)=1, τ=2.13) for weight-for-length/height for girls 187
Table 65 Observed proportions of children with measurements below the fitted
centiles from Model 2, weight-for-length/height for girls 188
Table 66 Weight-for-length for girls 199
Table 67 Weight-for-height for girls 209
Table 68 Longitudinal sample sizes for BMI-for-age for boys 230
Table 69 Cross-sectional sample sizes for BMI-for-age for boys 230
Table 70 Global deviance (GD) for models within the class BCPE(x=ageλ, df(µ)=9,
df(σ)=4, df(ν)=4, τ=2) for length-based BMI-for-age for boys 231
Table 71 Goodness-of-fit summary for models using the BCPE distribution with
fixed ν=1 and τ=2 for length-based BMI-for-age for boys 231
Table 72 Q-test for z-scores from Model 1 [BCPE(x=age0.05, df(µ)=10, df(σ)=4,
ν=1, τ=2)] for length-based BMI-for-age for boys 233 Table 73 Goodness-of-fit summary for models BCPE(x=age0.05, df(µ)=10, df(σ)=4,
df(ν)=?, τ=2) for length-based BMI-for-age for boys 233 Table 74 Q-test for z-scores from Model 2 [BCPE(x=age0.05, df(µ)=10, df(σ)=4,
df(ν)=3, τ=2)] for length-based BMI-for-age for boys 237
Table 75 Observed proportions of children with measurements below the fitted
centiles from Model 2, length-based BMI-for-age for boys 238
Table 76 Goodness-of-fit summary for models using the BCPE distribution with
fixed ν=1 and τ=2 for height-based BMI-for-age for boys 241 Table 77 Goodness-of-fit summary for models BCPE(x=age, df(µ)=4, df(σ)=3,
Table 78 Observed proportions of children with measurements below the fitted
centiles from Model 1, height-based BMI-for-age for boys 244
Table 79 Q-test for z-scores from Model 1 [BCPE(x=age, df(µ)=4, df(σ)=3,
df(ν)=3, τ=2)] for height-based BMI-for-age for boys 245 Table 80 Length-based BMI-for-age for boys, age in weeks 254
Table 81 Length-based BMI-for-age for boys, age in years and months 256
Table 82 Height-based BMI-for-age for boys, age in years and months 258
Table 83 Longitudinal sample sizes for BMI-for-age for girls 263
Table 84 Cross-sectional sample sizes for BMI-for-age for girls 263
Table 85 Global deviance (GD) for models within the class BCPE(x=ageλ,
df(µ)=9, df(σ)=4, df(ν)=4, τ=2) for length-based BMI-for-age for girls 264
Table 86 Goodness-of-fit summary for models using the BCPE distribution with
fixed ν=1 and τ=2 for length-based BMI-for-age for girls 264
Table 87 Q-test for z-scores from Model 1 [BCPE(x=age0.05, df(µ)=10, df(σ)=3,
ν=1, τ=2)] for length-based BMI-for-age for girls 266 Table 88 Goodness-of-fit summary for models BCPE(x=age0.05, df(µ)=10, df(σ)=3,
df(ν)=?, τ=2) for length-based BMI-for-age for girls 267
Table 89 Q-test for z-scores from Model 2 [BCPE(x=age0.05, df(µ)=10, df(σ)=3,
df(ν)=3, τ=2)] for length-based BMI-for-age for girls 271
Table 90 Observed proportions of children with measurements below the fitted
centiles from Model 2 for length-based BMI-for-age for girls 272
Table 91 Goodness-of-fit summary for models using the BCPE distribution with
fixed ν=1 and τ=2 for height-based BMI-for-age for girls 275
Table 92 Goodness-of-fit summary for models BCPE(x=age, df(µ)=4, df(σ)=4,
df(ν)=?, τ=2) for height-based BMI-for-age for girls 276
Table 93 Q-test for z-scores from Model 1 [BCPE(x=age, df(µ)=4, df(σ)=4,
df(ν)=1, τ=2)] for height-based BMI-for age for girls 280
Table 94 Observed proportions of children with measurements below the fitted
centiles from Model 1 for height-based BMI-for-age for girls 281
Table 95 Length-based BMI-for-age for girls, age in weeks 289
Table 96 Length-based BMI-for-age for girls, age in years and months 291
- xvi -
Glossary
BCPE The Box-Cox power exponential distribution.
µ The median of the Box-Cox power exponential distribution.
σ The approximate coefficient of variation of the Box-Cox power exponential distribution — related to the variance.
ν The power of the Box-Cox transformation (to the normal distribution) of the Box-Cox power exponential distribution - related to the skewness.
τ The power exponential parameter of the Box-Cox power exponential distribution — related to the kurtosis.
λ The power of the age (or length/height) transformation.
Body mass index (BMI) The ratio weight (in kg) / recumbent length or standing height (in m2).
Box-Cox transformation A power transformation to the normal distribution.
Coefficient of variation The ratio of the standard deviation to the mean.
Cubic spline A piecewise third-order polynomial function that passes through
a set of m (or degrees of freedom) control points; it can have a very simple form locally, yet be globally flexible and smooth.
Cut-off A designated limit beyond which a subject or observation is
classified according to a pre-set condition.
Degrees of freedom (df) The number of control points used to fit the cubic splines.
Kurtosis An attribute of a distribution describing "peakedness". A high kurtosis portrays a distribution with fat tails in contrast to a low kurtosis, which portrays a distribution with skinny tails.
P-value The probability of falsely rejecting the hypothesis being tested.
In this report all p-values were compared to a level of significance set to 0.05.
Q-test A statistical test which combines overall and local tests
assessing departures from the normal distribution with respect to median, variance, skewness and kurtosis.
Skewness A statistical term used to describe a distribution's asymmetry in
relation to a normal distribution.
Standard deviation score (SD) See z-score.
Worm plots A set of detrended Q-Q plots — plots that compare the
distribution of a given set of observations to the normal distribution.
Z-score The deviation of an individual's value from the median value of
Executive summary
In 1993 the World Health Organization (WHO) undertook a comprehensive review of the uses and interpretation of anthropometric references. The review concluded that the NCHS/WHO growth reference, which had been recommended for international use since the late 1970s, did not adequately represent early childhood growth and that new growth curves were necessary. The World Health Assembly endorsed this recommendation in 1994. In response WHO undertook the Multicentre Growth Reference Study (MGRS) between 1997 and 2003 to generate new curves for assessing the growth and development of children the world over.
The MGRS combined a longitudinal follow-up from birth to 24 months and a cross-sectional survey of children aged 18 to 71 months. Primary growth data and related information were gathered from 8440 healthy breastfed infants and young children from widely diverse ethnic backgrounds and cultural settings (Brazil, Ghana, India, Norway, Oman and USA). The MGRS is unique in that it was purposely designed to produce a standard by selecting healthy children living under conditions likely to favour the achievement of their full genetic growth potential. Furthermore, the mothers of the children selected for the construction of the standards engaged in fundamental health-promoting practices, namely breastfeeding and not smoking.
This report presents the first set of WHO Child Growth Standards (i.e. length/height-for-age, weight-for-age, weight-for-length, weight-for-height and body mass index (BMI)-for-age) and describes the methodical process followed in their development. The first step in this process was a consultative expert review of some 30 growth curve construction methods, including types of distributions and smoothing techniques to identify the best approach to constructing the standards. Next was the selection of a software package flexible enough to allow the comparative testing of the alternative methods used to generate the growth curves. Then the selected approach was applied systematically to search for the best models to fit the data for each indicator.
The Box-Cox-power-exponential (BCPE) method, with curve smoothing by cubic splines was selected for constructing the WHO child growth curves. The BCPE accommodates various kinds of distributions, from normal to skewed or kurtotic. The age-based indicators originating at birth required a power-transformation to stretch the age scale (x-axis) as a preliminary step to fitting the curves. For each set of curves, the search for the best model specification began by examining various combinations of degrees of freedom to fit the median and variance estimator curves. When data had a non-normal distribution, degrees of freedom for parameters to model skewness and kurtosis were added to the initial model and adequacy of fit evaluated. Apart from length/height-for-age, which followed a normal distribution, the other standards required the modelling of skewness, but not kurtosis. The diagnostic tools used iteratively to detect possible model misfits and biases in the fitted curves included various tests of local and global goodness of fit, worm plots and residual plots. Patterns of differences between empirical and fitted percentiles were also examined, as were proportions of observed versus expected percentages of children with measurements below selected percentiles.
The methodology described above was followed to generate ─ for boys and girls aged 0 to 60 months ─ percentile and z-score curves for length/height-for-age, for-age, for-length, weight-for-height and BMI-for-age. The last standard is an addition to the set of indicators previously available as part of the NCHS/WHO reference. In-depth descriptions are presented of how each sex-specific standard was constructed. Also presented are comparisons of the new WHO standards with the NCHS/WHO growth reference and the CDC 2000 growth charts.
xviii
calculated for distributions below and above the median for each of the two indicators. This approach is limited in fitting skewed data, especially at the extreme tails of the distribution, since it only partially adjusts for the skewness inherent in the weight-based indicators. The WHO standards, on the other hand, employed LMS-based methods that fit skewed data adequately and generate fitted curves that follow closely the empirical data. Like the WHO standards, construction of the CDC 2000 growth charts was also based on the LMS method and, therefore, differences between this reference and the WHO standards are largely a reflection of differences in the populations on which the two sets of curves were based.
Length/height-for-age. The standard for linear growth has a part based on length (length-for-age, 0 to 24 months) and another on height (height-for-age, 2 to 5 years). The two parts were constructed using the same model but the final curves reflect the average difference between recumbent length and standing height. By design, children between 18 and 30 months in the cross-sectional component of the MGRS had both length and height measurements taken. The average difference between the two measurements in this set of 1625 children was 0.73 cm. To fit a single model for the whole age range, 0.7 cm was therefore added to the cross-sectional height values before merging them with the longitudinal sample's length data. After the model was fitted, the median curve was shifted back downwards by 0.7 cm for ages above two years, and the coefficient of variation curve adjusted to the new median values to construct the height-for-age growth curves. The same power transformation of age was applied to stretch the age scale for each of the sexes before fitting cubic splines to generate their respective growth curves. The boys' curves required a model with higher degrees of freedom to fit both the median and coefficient of variation curves. The data for both sexes followed the normal distribution.
Weight-for-age. The weights of the longitudinal and cross-sectional samples were merged without any adjustments and a single model was fitted to generate one continuous set of curves constituting each sex-specific weight-for-age standard. The same power transformation was applied to both boys' and girls' age before fitting the curve construction model. The weight data for both sexes were skewed, so in specifying the model, the parameter related to skewness was fitted in addition to the median and the approximate coefficient of variation. In modelling skewness the girls' curves required more degrees of freedom to fit a curve for this parameter.
Weight-for-length/height. The construction of the length (45 to 110 cm) and weight-for-height (65 to 120 cm) standards followed a procedure similar to that applied to construct the length/height-for-age standards. That is, to fit a single model, 0.7 cm was added to the cross-sectional height values, and after the model was fitted, the weight-for-length centile curves in the length interval 65.7 to 120.7 cm were shifted back by 0.7 cm to derive the weight-for-height standards corresponding to the height range 65 cm to 120 cm. The lower limit of the weight-for-length standards (45 cm) was chosen to cover up to approximately -2 SD girls' length at birth. The upper limit for the weight-for-height standards was influenced by the need to accommodate the tallest children at age 60 months, that is, 120 cm is approximately +2 SD boys' height-for-age at 60 months. The overlap between the upper end of the weight-for-length standards and the lower end of the weight-for-height standards is intended to facilitate their application in severely undernourished populations and emergency settings.
overlapping ages likely explains the slight wiggle in the final WHO standards (for both boys and girls) as also observed in other references.
Body mass index-for-age.Body mass index is the ratio weight (in kg)/recumbent length or standing height (in m2). To address the difference between length and height, the approach used for constructing the BMI-for-age standards was different from that described for length/height-for-age. Because BMI is a ratio with squared length or height in the denominator, adding 0.7 cm to the height values and back-transforming them after fitting was not feasible. The solution adopted was to construct the standards for the younger and the older children separately based on two sets of data with an overlapping range of ages below and above 24 months. To construct the BMI-for-age standard based on length (0 to 2 years), the longitudinal sample's length data and the cross-sectional sample's height data (18 to 30 months) were combined after adding 0.7 cm to the height values. Analogously, to construct the standard from 2 to 5 years, the cross-sectional sample's height plus the longitudinal sample's length data (18 to 24 months) were combined after subtracting 0.7 cm from the length values. Thus, a common set of data from 18 to 30 months was used to generate the BMI standards for the younger and the older children. The resulting disjunction between the two standards thus in essence reflects the 0.7 cm difference between length and height. This does not mean, however, that a child at a specific age will have the same length- and height-based BMI-for-age z-score as this is mathematically impossible given the nature of the BMI ratio.
An age power transformation as described for the other age-based standards was required before constructing the length-based BMI-for-age curves. No such transformation was necessary for the height-based BMI-for-age. The WHO length- and height-based BMI-for-age standards do not overlap, i.e. the length-based interval ends at 730 days and the height-based interval starts at 731 days. Cubic spline fitting was achieved with variable degrees of freedom for the length- versus height-based standards, and also for the boys' versus girls' final curves.
Technical aspects of the standards. The method used to construct the WHO standards generally relied on the Box-Cox power exponential distribution and the final selected models simplified to the LMS model. As a result, the computation of percentiles and z-scores for these standards uses formulae based on the LMS method. However, a restriction was imposed on all indicators to enable the derivation of percentiles only within the interval corresponding to z-scores between -3 and 3. The underlying reasoning is that percentiles beyond ±3 SD are invariant to changes in equivalent z-scores. The loss accruing to this restriction is small since the inclusion range corresponds to the 0.135th to 99.865th percentiles.
The weight-based indicators presented right-skewed distributions. When modelled correctly, right skewness has the effect of making distances between positive z-scores increase progressively the farther away they are from the median, while distances between negative z-scores decrease progressively. The LMS method fits skewed data adequately by using a Box-Cox normal distribution, which follows the empirical data closely. The drawback, however, is that the outer tails of the distribution are highly affected by extreme data points even if only very few. A restricted application of the LMS method was thus used for the construction of the WHO weight-based indicators, limiting the Box-Cox normal distribution to the interval corresponding to z-scores where empirical data were available (i.e. between -3 SD and 3 SD). Beyond these limits, the standard deviation at each age (or length/height) was fixed to the distance between ±2 SD and ±3 SD, respectively. This approach avoids making assumptions about the distribution of data beyond the limits of the observed values.
xx
when wasting rates will be substantially higher using the new WHO standards. With respect to overweight, use of the new WHO standards will result in a greater prevalence that will vary by age, sex and nutritional status of the index population.
1. INTRODUCTION
Growth charts are an essential component of the paediatric toolkit. Their value resides in helping to determine the degree to which physiological needs for growth and development are met during the important childhood period. Beyond their usefulness in assessing children's nutritional status, many governmental and United Nations agencies rely on growth charts to measure the general well-being of populations, formulate health and related policies, and plan interventions and monitor their effectiveness.
The origin of the WHO Child Growth Standards dates back to the early 1990s when a group of experts was appointed to conduct a meticulous evaluation of the National Center for Health Statistics/World Health Organization (NCHS/WHO) growth reference that had been recommended for international use since the late 1970s (WHO, 1995). The limitations of the NCHS/WHO reference have been documented (WHO Working Group on Infant Growth, 1994; de Onis and Yip, 1996; de Onis and Habicht, 1996). The data used to construct the reference covering birth to three years of age came from a longitudinal study of children of European ancestry from a single community in the USA. These children were measured every three months, which is inadequate to describe the rapid and changing rate of growth in early infancy. Also, the statistical methods available at the time the NCHS/WHO growth curves were constructed were too limited to correctly model the pattern and variability of growth. As a result, the NCHS/WHO curves do not adequately represent early childhood growth.
The initial phase of the expert group's work documented the deficiencies of the reference and led to a plan for developing new growth charts that would show how children should grow in all countries rather than merely describing how they grew at a particular time and place. The experts underscored the importance of ensuring that the new growth charts were consistent with "best" health practices (Garza and de Onis, 2004).
A logical outcome of this plan was the WHO Multicentre Growth Reference Study (MGRS), which was implemented between 1997 and 2003 (de Onis et al., 2004a). The MGRS is unique in that it was purposely designed to produce a standard rather than a reference. Although standards and references both serve as a basis for comparison, each enables a different interpretation. Since a standard defines how children should grow, deviations from the pattern it describes are evidence of abnormal growth. A reference, on the other hand, does not provide as sound a basis for such value judgments, although in practice references often are mistakenly used as standards.
The MGRS data provide a solid foundation for developing a standard because they are based on healthy children living under conditions likely to favour achievement of their full genetic growth potential. Furthermore, the mothers of the children selected for the construction of the standards engaged in fundamental health-promoting practices, namely breastfeeding and not smoking (de Onis et al., 2004b).
2 Introduction
A key characteristic of the new standards is that they explicitly identify breastfeeding as the biological norm and establish the breastfed child as the normative model for growth and development (WHO Multicentre Growth Reference Study Group, 2006b). Another distinguishing feature of the new standards is that they include windows of achievement for six gross motor developmental milestones which are presented elsewhere (WHO Multicentre Growth Reference Study Group, 2006c). Although WHO in the past issued recommendations concerning attained physical growth, it had not previously made any recommendations for assessing motor development.
2. METHODOLOGY
2.1 Design of the WHO Multicentre Growth Reference Study
The MGRS (July 1997–December 2003) was a population-based study that took place in the cities of Davis, California, USA; Muscat, Oman; Oslo, Norway; and Pelotas, Brazil; and in selected affluent neighbourhoods of Accra, Ghana and South Delhi, India. The MGRS protocol and its implementation in the six sites are described in detail elsewhere (de Onis et al., 2004a). Briefly, the MGRS combined a longitudinal component from birth to 24 months with a cross-sectional component of children aged 18–71 months. In the longitudinal component, mothers and newborns were screened and enrolled at birth and visited at home a total of 21 times on weeks 1, 2, 4 and 6; monthly from 2–12 months; and bimonthly in the second year. In the cross-sectional component, children aged 18–71 months were measured once, except in the two sites (Brazil and USA) that used a mixed-longitudinal design in which some children were measured two or three times at three-month intervals. Both recumbent length and standing height were measured for all children aged 18–30 months. Data were collected on anthropometry, motor development, feeding practices, child morbidity, perinatal factors, and socioeconomic, demographic and environmental characteristics (de Onis et al., 2004b).
The study populations lived in socioeconomic conditions favourable to growth and where mobility was low, ≥20% of mothers followed WHO feeding recommendations and breastfeeding support was available(de Onis et al., 2004b). Individual inclusion criteria were: no known health or environmental constraints to growth, mothers willing to follow MGRS feeding recommendations (i.e. exclusive or predominant breastfeeding for at least 4 months, introduction of complementary foods by the age of 6 months, and continued partial breastfeeding up to at least 12 months), no maternal smoking before and after delivery, single term birth, and absence of significant morbidity (de Onis et al., 2004b).
As part of the site-selection process in Ghana, India and Oman, surveys were conducted to identify socioeconomic characteristics that could be used to select groups whose growth was not environmentally constrained (Owusu et al., 2004; Bhandari et al., 2002; Mohamed et al., 2004). Local criteria for screening newborns, based on parental education and/or income levels, were developed from those surveys. Pre-existing survey data for this purpose were available from Brazil, Norway and the USA. Of the 13 741 mother-infant pairs screened for the longitudinal component, about 83% were ineligible (WHO Multicentre Growth Reference Study Group, 2006d). Families’ low socioeconomic status was the most common reason for ineligibility in Brazil, Ghana, India and Oman, whereas parental refusal was the main reason for non-participation in Norway and USA (WHO Multicentre Growth Reference Study Group, 2006d). For the cross-sectional component, 69% of the 21 510 subjects screened were excluded for reasons similar to those observed in the longitudinal component.
Term low-birth-weight (<2500 g) infants (2.3%) were not excluded. Since it is likely that in well-off populations such infants represent small but normal children, their exclusion would have artificially distorted the standards’ lower percentiles. Eligibility criteria for the cross-sectional component were the same as those for the longitudinal component with the exception of infant feeding practices. A minimum of three months of any breastfeeding was required for participants in the study’s cross-sectional component.
2.2 Anthropometry
methods
4 Methodology
The MGRS data included weight and head circumference at all ages, recumbent length (longitudinal component), height (cross-sectional component), and arm circumference, triceps and subscapular skinfolds (all children aged ≥3 months). However, this report presents only the standards based on length or height and weight. Observers working in pairs collected anthropometric data. Each observer independently measured and recorded a complete set of measurements, after which the two compared their readings. If any pair of readings exceeded the maximum allowable difference for a given variable (e.g. weight, 100 g; length/height, 7 mm), both observers once again independently measured and recorded a second and, if necessary, a third set of readings for the variable(s) in question (de Onis et al., 2004c).
All study sites used identical measuring equipment. Instruments needed to be highly accurate and precise, yet sturdy and portable to enable them to be carried back and forth on home visits. Length was measured with the portable Harpenden Infantometer (range 30–110 cm, with digit counter readings precise to 1 mm). The Harpenden Portable Stadiometer (range 65–206 cm, digit counter reading) was used for measuring adult and child heights. Portable electronic scales with a taring capability, calibrated to 0.1 kg (i.e. UNICEF Electronic Scale 890 or UNISCALE), were used to measure weight. Length and height were recorded to the last completed unit rather than to the nearest unit. To correct for the systematic negative bias introduced by this practice, 0.05 cm (i.e. half of the smallest measurement unit) was added to each measurement before analysis. This correction did not apply to weight, which was rounded off to the nearest 100 g. Full details of the instruments used and how measurements were taken are provided elsewhere (de Onis et al., 2004c).
2.3 Sample
description
The total sample size for the longitudinal and cross-sectional components from all six sites was 8440 children. A total of 1743 children were enrolled in the longitudinal sample, six of whom were excluded for morbidities affecting growth (4 cases of repeated episodes of diarrhoea, 1 case of repeated episodes of malaria, and 1 case of protein-energy malnutrition) leaving a sample of 1737 children (894 boys and 843 girls). Of these, the mothers of 882 children (428 boys and 454 girls) complied fully with the MGRS infant-feeding and no-smoking criteria and completed the follow-up period of 24 months (96% of compliant children completed the 24-month follow-up) (Table 1). The other 855 children contributed only birth measurements, as they either failed to comply with the study's infant-feeding and no-smoking criteria or dropped out before 24 months. The reason for using these measurements was to increase the sample size at birth to minimize the left-edge effect. The size at birth of these 855 children was similar to that of the compliant sample (Table 2). The total number of records for the longitudinal component was 19 900.
Table 1 Total sample and number of compliant children in the longitudinal component
Complianta
Methodology 5
Table 2 Comparison of mean size at birth for compliant newborns and those that contributed only birth measurements
Compliant with infant-feeding and no-smoking criteria and completed the 24-month follow-up.
The cross-sectional sample comprised 6697 children. Of these, 28 were excluded for medical conditions affecting growth (20 cases of protein-energy malnutrition, five cases of haemolytic anaemia G6PD deficiency, two cases of renal tubulo-interstitial disease, and one case of Crohn disease) leaving a final sample of 6669 children (3450 boys and 3219 girls) (Table 3). The total number of records in the cross-sectional component was 8306 as some children in Brazil and the USA were measured two or three times at three-month intervals (Table 4). A full description of the MGRS sample with regard to screening, recruitment, sample attrition and compliance, as well as the baseline characteristics of the study sample is provided elsewhere (WHO Multicentre Growth Reference Study Group, 2006d).
Table 3 Total sample of children in the cross-sectional component
Site Boys Girls Total
Table 4 Total sample of children in the cross-sectional component by number of visits and total number of records
2.4 Data cleaning procedures and exclusions
Data cleaning
6 Methodology
the sites were sent to WHO/HQ every month for master file consolidation and more extensive quality control checking. All errors identified were communicated to the site for correction at source.
After data collection was completed at a given site, a period of about 6 months was dedicated to in-depth data quality checking and master file cleaning. Detailed validation reports, descriptive statistics and plots were produced from the site’s master files. For the longitudinal component, each anthropometric measurement was plotted for every child from birth to the end of his/her participation. These plots were examined individually for any questionable patterns. Query lists from these analyses were sent to the site for investigation and correction, or confirmation, as required. As with the data collection process, the site data manager prepared correction batches to update the master files. The updated master files were then sent to WHO/HQ and this iterative quality assurance process continued until all identifiable problems had been detected and corrected. The rigorous implementation of what was a highly demanding protocol yielded very high-quality data.
Data exclusions
To avoid the influence of unhealthy weights for length/height, observations falling above +3 SD and below -3 SD of the sample median were excluded prior to constructing the standards. For the cross-sectional sample, the +2 SD cut-off (i.e. 97.7 percentile) was applied instead of +3 SD as the sample was exceedingly skewed to the right, indicating the need to identify and exclude high weights for height. This cut-off was considered to be conservative given that various definitions of overweight all apply lower cut-offs than the one used (Daniels et al., 2005; Koplan et al., 2005).
To derive the above-mentioned cut-offs based on the sex-specific weight-for-length/height indicator, the weight median and coefficient of variation curves were modelled continuously across length/height using an approach that accounted for the sample's asymmetry as described below. The data were split into two sets: one set with all points above the median and another with all points below the median. For each of the two sets, mirror values were generated to create symmetrically distributed values around the median for the upper and lower sets. The generation of mirror data was necessary to simulate a symmetric distribution based on the distinct variabilities of the upper and lower sets. For each of the mirror data sets, median and coefficient of variation curves were estimated continuously across the length/height range using the LMS method (Cole and Green, 1992) fixing L=1, i.e. fitting a normal distribution to the data for each specific length/height value, to derive the corresponding cut-offs. In total, only a small proportion of observations were excluded for unhealthy weight-for-length/height: 185 (1.4%) for boys and 155 (1.1%) for girls, most of which were in the upper end of the cross-sectional sample distribution (Table 5).
Table 5 Number of observations by sex and study component included and excluded on the basis of weight-for-length/height
Methodology 7
In addition, a few influential observations for indicators other than weight-for-height were excluded when constructing the individual standards: for weight-for-age boys, 4 (0.03%) and girls, 1 (0.01%) observations and, for length/height-for-age boys, 3 (0.02%) and girls, 2 (0.01%) observations. These observations were set to missing in the final data set and therefore did not contribute to the construction of the weight-for-length/height and body mass index-for-age standards. The final number of observations used in the construction of the WHO child growth standards is shown in Table 6.
Table 6 Number of observations used in the construction of the WHO child growth standards by sex and anthropometric indicator
Indicator Girls Boys Total
Weight-for-length/height 13 623 13 362 26 985
Weight-for-age 14 056 13 797 27 853
Length/height-for-age 13 783 13 551 27 334
BMI-for-age 13 623 13 362 26 985
2.5 Statistical methods for constructing the growth curves
The construction of the growth curves followed a careful, methodical process. This involved:
• detailed examination of existing methods, including types of distributions and smoothing techniques, in order to identify the best possible approach;
• selection of a software package flexible enough to allow comparative testing of alternative methods and the actual generation of the curves;
• systematic application of the selected approach to the data to generate the models that best fit the data.
A group of statisticians and growth experts met at WHO/HQ to review possible choices of methods and to define a strategy and criteria for selecting the most appropriate model for the MGRS data (Borghi et al., 2006). As many as 30 construction methods for attained growth curves were examined. The group recommended that methods based on selected distributions be compared and combined with two smoothing techniques for fitting parameter curves to further test and provide the best possible approach to constructing the WHO child growth standards.
8 Methodology
Apart from other theoretical advantages, the BCPE presents as good or better goodness-of-fit than the modulus-exponential-normal or the SU distribution.
Choice of smoothing technique. The expert group recommended two smoothing techniques for comparison: cubic splines and fractional polynomials (Borghi et al., 2006). Using the GAMLSS software, the two techniques were compared for smoothing length/height-for-age, weight-for-age and weight-for-length/height curves. For the fractional polynomials, a function in GAMLSS was used that estimates the best set of powers among {-2, -1, -0.5, 0, 0.5, 1, 2, 3} within the choices of polynomials with the same number of terms. The best fractional polynomial for 1, 2 or 3 terms was fitted for each parameter curve. A number of combinations were tried among the different parameter curves, considering the Akaike Information Criterion (Akaike, 1974), AIC, defined as:
,
2
2
L
p
AIC
=
−
+
where L is the maximized likelihood and p is the number of parameters (or the total number of degrees of freedom). According to this criterion, the best model is the one with the smallest AIC value.
The cubic spline smoothing technique offered more flexibility than fractional polynomials in all cases. For the length/height-for-age and weight-for-age standards, a power transformation applied to age prior to fitting was necessary to enhance the goodness of fit by the cubic spline technique.
Choice of method for constructing the curves. In summary, the BCPE method, with curve smoothing by cubic splines, was selected as the approach for constructing the growth curves. This method is included in a broader methodology, the GAMLSS (Rigby and Stasinopoulos, 2005), which offers a general framework that includes a wide range of known methods for constructing growth curves. The GAMLSS allows for modeling the mean (or median) of the growth variable under consideration as well as other parameters of its distribution that determine scale and shape. Various kinds of distributions can be assumed for each growth variable of interest, from normal to skewed and/or kurtotic distributions. Several smoothing terms can be used in generating the curves, including cubic splines, lowess (locally weighted least squares regression), polynomials, power polynomials and fractional polynomials. The simplified notation to describe a particular model within the class of the BCPE method is:
BCPE(x=x, df(µ)=n1, df(σ)=n2, df(ν)=n3, df(τ)=n4),
where
df(
·
)
are the degrees of freedom for the cubic splines smoothing the respective
parameter curve and
x
is age (or transformed age) or length/height. Note that when
df(
·
)=1
,
the smoothing function reduces to a constant and when
df(
·
)=2
, it reduces to a linear function.
The GAMLSS software was used to construct the WHO child growth standards. The main selected diagnostic tests and tools are available in this software. To complement and test the software, Dr Huiqi Pan and Professor Tim Cole provided the software LMS Pro, which offers the fitting of growth curves using the LMS method in a user-friendly and interactive way, including some of the available diagnostics for choosing the best set of degrees of freedom for the cubic splines and goodness-of-fit statistics. Wright and Royston's package "xriml", developed in the STATA environment, was used to test the fitting of fractional polynomials (Wright and Royston, 1996).