LAMPIRAN 1
Penentuan target populasi yang akan digunakan pada penelitian
No Nama Perusahaan
Kode
1
2
3
4
Jumlah
7
Bank Negara Indonesia
(Persero) Tbk
BBNI
✓ ✓ - ✓
8
Bank Rakyat Indonesia Tbk
(Persero) Tbk
BBRI
✓ ✓ - ✓
9
Bank Tabungan Negara
(Persero) Tbk
BBTN
18
Charoen Pokphand Indonesia
Tbk
CPIN
✓ ✓ - ✓
19
XL Axiata Tbk
EXCL
✓ ✓ ✓ ✓Sampel 5
20
Gudang Garam Tbk
GGRM
✓ ✓ - ✓21
Harum Energy Tbk
HRUM
✓ ✓ ✓ ✓Sampel 6
22
Indofood CBP Sukses Makmur
Tbk
ICBP
✓ - - ✓
23
Indomobil Sukses
Internasional Tbk
IMAS
- - - ✓
24
Vale Indonesia Tbk
INCO
✓ ✓ ✓ ✓Sampel 7
25
Indofood Sukses Makmur Tbk
INDF
✓ ✓ ✓ ✓Sampel 8
26
Indocement Tunggal Prakasa
Tbk
INTP
31
PP London Sumatera Indonesia
Tbk
LSIP
Lanjutan Penentuan target populasi yang
akan digunakan pada penelitian
No Nama Perusahaan
Kode
1
2
3
4
Jumlah
36
Perusahaan Gas Negara
(Persero) Tbk
PGAS
✓ ✓ ✓ ✓
Sampel 13
37
Tambang Batubara Bukit
Asam (Persero) Tbk
PTBA
42
Telekomunikasi Indonesia
(Persero) Tbk
TLKM
✓ ✓ - ✓
43
United Tractors Tbk
UNTR
✓ ✓ ✓ ✓Sampel 15
44
Unilever Indonesia Tbk
UNVR
✓ ✓ ✓ ✓Sampel 16
45
Wijaya Karya (Persero) Tbk
WIKA
- - ✓ ✓Keterangan :
1.
Perusahaan yang terdaftar dalam saham LQ45 periode 2011-2013
2.
Perusahaan yang membayarkan dividen tunai secara berturut-turut pada
periode 2011-2013
3.
Perusahaan yang memiliki informasi
managerial ownership
pada periode
2011-2013
4.
Perusahaan yang memiliki informasi
institutional ownership
pada periode
LAMPIRAN 2
Data variabel Kepemilikan Manajerial, Kepemilikan Institusional,
Debt to
total Asset
,
Return on Asset
, dan Ukuran Perusahaan periode 2011-2013 :
Data Variabel Kepemilikan Manajerial (%) Tahun 2011-2013 Perusahaan
Sampel yang Terdaftar Di LQ45
Data Variabel Kepemilikan Institusional (%) Tahun 2011-2013 Perusahaan
Sampel yang Terdaftar Di LQ45
Data Variabel
Debt to Total Asset
Ratio
(%) Tahun 2011-2013 Perusahaan
Sampel yang Terdaftar Di LQ45
Data Variabel
Return on Asset
(%) Tahun 2011-2013 Perusahaan Sampel
yang Terdaftar Di LQ45
Data Variabel Ukuran Perusahaan Tahun 2011-2013 Perusahaan Sampel
yang Terdaftar Di LQ45
Data Variabel
Dividend Payout Ratio
(%) Tahun 2011-2013 Perusahaan
Sampel yang Terdaftar Di LQ45
LAMPIRAN 3
Descriptive Statistics
N Minimum Maximum Mean Std. Deviation
DPR 48 24.08 99.98 54.6454 18.78863
MAN 48 .001 1.760 .17754 .424029
INST 48 47.15 84.99 63.5598 10.57462
DAR 48 .04 1.21 .4840 .26255
ROA 48 1.69 71.51 13.9381 13.93233
SIZE 48 15.35 20.41 17.5040 1.37239
LAMPIRAN
4
a. Dependent Variable: DPR
b. Predictors: (Constant), SIZE, MAN, INST, ROA, DAR
Hasil Koefisien Determinasi
Model R R Square Adjusted R Square Std. Error of the Estimate
1 .797a .634 .591 12.01656
LAMPIRAN 5
Hasil Uji Asumsi Klasik
1.
Uji Normalitas
Grafik Histogram
Hasil Uji One-Sample Kolmogorov-Smirnov Test
One-Sample Kolmogorov-Smirnov Test
Unstandardized
Residual
N 48
Normal Parametersa,b
Mean .0000000
Std, Deviation 11.35941337
Most Extreme Differences Absolute .067
Positive .067
Negative -.055
Test Statistic .067
Asymp, Sig, (2-tailed) .200
a, Test distribution is Normal, b, Calculated from data,
2.
Uji Multikolinearitas
Model
Unstandardized Coefficients
Standardized
Coefficients T Sig.
Collinearity Statistics
B Std. Error Beta Tolerance VIF
a. Dependent Variable: DPR
3.
Uji Autokorelasi
Model R R Square Adjusted R
Square
Std, Error of the
Estimate Durbin-Watson
1 ,797a ,634 ,591 12,01656 2,238
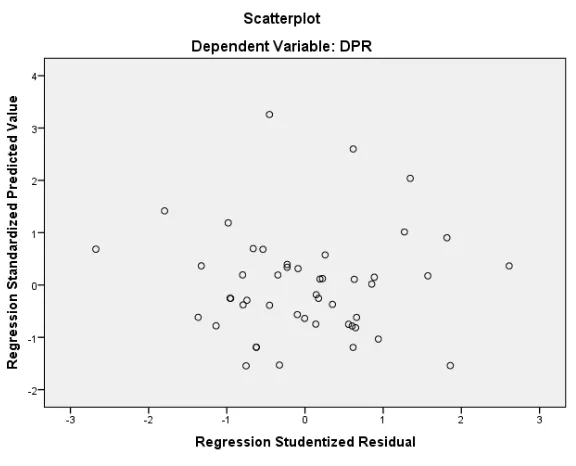
4.
Uji Heterokedastisitas
Grafik Scatterplot
Hasil Uji Glejser
CoefficientsaModel
Unstandardized Coefficients
Standardized
Coefficients t Sig,
Collinearity Statistics
B Std, Error Beta Tolerance VIF