JEJAK
Journal of Economics and Policy http://journal.unnes.ac.id/nju/index.php/jejak
Liquidity Effects on the Simultaneity of Trading Volume and Order
Imbalance
Erman Denny Arfianto1, Nurita Kusumastuti2
1,2Faculty of Economic and Business, Diponegoro University, Indonesia
Permalink/DOI:http://dx.doi.org/10.15294/jejak.v9i2.7624
Received: January 2016; Accepted: March 2016; Published: September 2016
Abstract
The purpose of this research is to analyze the simultaneity between trading volume and order imbalance, the influence of past performance, market risk, market capitalization, tick size to the trading volume and the influence of tick size, depth and bid-ask spread to the order imbalance of companies that were listed on LQ 45 index. The samples in this research were selected by using the purposive sampling method with some selected criteria. Fifty-five companies listed on 2014’s LQ 45 index were chosen as the sample. The results showed that the trading volume is simultaneously related to the order imbalance; past performance, market risk, and market capitalization have the positive and significant effect to the trading volume; tick size has the negative and significant effect to the trading volume; the order imbalance has the negative and insignificant effect to the trading volume; tick size, depth, bid-ask spread, and trading volume have no significant effect to the order imbalance.
Keywords: liquidity effects, trading volume, order imbalance.
How to Cite: Arfianto, E., & Kusumastuti, N. (2016). Liquidity Effects on the Simultaneity of Trading Volume and Order Imbalance. JEJAK: Jurnal Ekonomi Dan Kebijakan, 9(2), 170-179.
doi:http://dx.doi.org/10.15294/jejak.v9i2.7624
© 2016 Semarang State University. All rights reserved
Corresponding author :
Address: Jl. Prof. Soedharto SH Tembalang, Semarang 50239, Phone: +622476486851
E-mail: [email protected]
INTRODUCTION
Liquidity becomes an important thing because the capital market will lose its function and role as a means of investment also financing sources without the liquidity. Liquidity is a state of a security or other asset that can easily be sold or exchanged in cash important meaning. Investors will benefit by the liquid shares because the shares will be easier to be transacted so that investors will have the opportunity to make a profit.
Liquidity can be seen through the activity of trading volume. If the volume of shares traded is greater than the volume of shares issued, then the stock becomes more liquid so that the volume of trading activity will rise. Trading volume explains about the power between supply and demand in the stock market that is a manifestation of investor behavior. Volume describes trading activity in the stock market, and therefore the volume becomes an important indicator in evaluating the condition and market activity. The level of
investor’s interest can be measured by the
volume of trade. If the trading volume is high,
the level of investor’s interest will also high and
vice versa.
The company's past performance can be seen from the return obtained by the company in the previous period, and the investors tend to be more interested in the shares of companies that have a good past performance
such as the high rate of return. The investor’s
interest of past performance of a company will affect the volume of trade and the change of the
stock price because the investors will be very confident of the stocks that have performed very well in the past, and they hope the company will have the same performance in the future so that it can give benefits to the investors. A study conducted by Chan, Kalok and Fong (2000) noted that the past performance has an impact on trading volume. The trading volume may also be affected by the market capitalization of a company. According to Banz (1981), market capitalization is a reflection of the value of the assets of a company and can be used as a measurement of firm size. Pereira (2008) examined the effect of firm size on investment decisions and found out that there was a significant negative correlation between the sizes of the company against the decision of the investors in the investment activity in the stock market, so that the volume of trade was affected. Tick size is also expected to affect the trading volume of stock. Tick size is the limit price that can be determined by the investor. Rise or fall in the multiples of stock fraction is called points. The rate of profit may be affected by the rise or fall of points. If there is a profit, the stock market participants will respond well to these stocks so the trading volume will rise.
Japan iShares funds’ returns. Trade size and order imbalance still play the significant role explaining activity. A decline in imbalance may also be an indicator of less informed trading and better liquidity because the high imbalance leads to less liquidity (Rastogi etc, 2013).
The theory of efficient market hypothesis states that the formed of stock prices is a reflection of all available information, either fundamental or existed information (private information). So the strategy taken by the investor is observing the returns or the past performance of a stock. If the performance of stocks in the past had a good history then the investor would be interested in buying the shares. Gervais and Odean (2001) who analyzed about the overconfident investors on the performance and past return said that a high level of overconfident investors would increase the volume of stock trading.
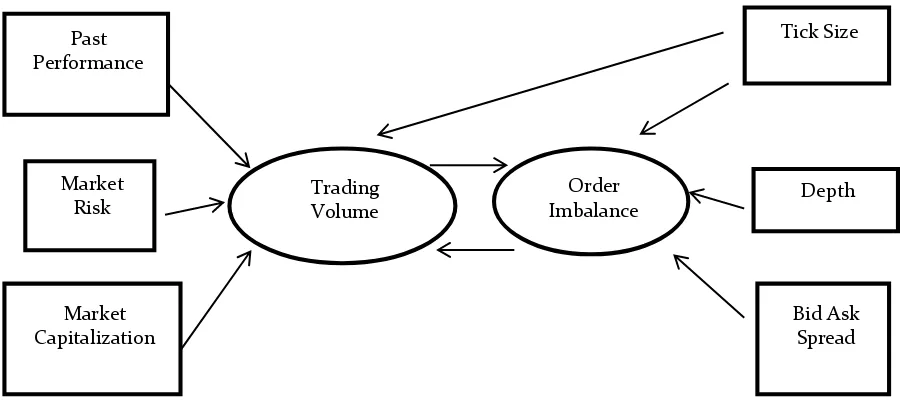
The hypothesis can be described with the image of the frame hypothesis below.
The hypothesis 1 (H1) : Past
performance has a positive effect on the trading volume. Market risk is measured by beta that
can be obtained with the calculation of market return and stock return. In the Efficient Market
Hypothesis’s theory, the current stock price
reflects the previous stock price with the addition of random information. So, it means that the random factor can be called as a return. The research conducted by Schadewitz and Niskala (2010) proved that beta stocks have a positive relationship with liquidity.
The hypothesis (H2) : Market risk has a negative effect on the trading volume.
Companies that have large market
capitalization will be considered to have certainty in obtaining the benefits and may influence the investors in making the decisions that will affect the business risk factors. Fama and French three-factor model suggested that the stocks with large firm size will attract the investors to buy, so the volume of trade will rise.
The hypothesis (H3) : Market
Capitalization has a positive effect on the trading volume.
Figure 1. Theoretical Framework
Past Performance
Bid Ask Spread Depth Market
Risk
Tick Size
Trading Volume
Order Imbalance
Reduction in tick size can make changes in the liquidity that is correlated inversely with the price and has a direct connection with the stock trading volume (Harris, 1994). It happens because if the stocks have the high volume and low price, the fraction of the price will become a factor that can affect the liquidity of its shares. The impact of the reduction in the stock fraction may theoretically be positive or negative due to various factors, by estimating that there will be enhancement in volatility as a result of reduction of tick size, and it can make a lot of transactions cancelled, so it will decrease the volume of stock trading (Porter and Weaver, 1997). Market capitalization also affects the long-term performance (Zhakanova & Emeagwali, 2014).
The hypothesis (H4) : Tick size has a
negative effect on the trading volume. According to Porter and Weaver (1997), the trading volume will decline after the reduction of tick size. And the volatility will increase, so it
will cause the cancellation of stock
transactions. If the volatility has increased during the reduction of tick size, the tick size could be expected to have a negative affect on the order imbalance because it would arise when the volatility increased.
The hypothesis 5 (H5) : The tick size has
a negative effect on the order imbalance. Depth is closely related to the liquidity and the volume within a security. Theoretically, depth is the volume of shares on the lowest selling order price and the highest buying order price. Depth indicates the depth of the market, if the securities are traded more and more, the depth of the market will be greater. Depth is able to describe the changes in liquidity thoroughly.
The hypothesis 6 (H6) : Depth has a
positive effect on the order imbalance. Bid-ask spread can be used as a benchmark by the investors in doing an investment activity. Reduction of bid-ask spread shows the
reduction in trade costs experienced by the investors. A research conducted by Sumani (2013) found a significant relationship between the stock liquidity and the bid-ask spread.
The hypothesis 7 (H7) : Bid-ask spread
has a negative effect on the order imbalance. In Chan and Fong (2000), a model of Admati and Pfleiderer (1988) states that the informed traders would prefer to conduct the trading activities in the deep market while the liquidity traders will choose to do the trading activity when the market is crowded. Because the informed traders prefer to conduct the trading activity during the high trading day, it will be an excess supply that only occurs on one side (buying or selling), which will cause the order imbalance and volatility of the stock prices. According to Chordia (2002), there are two reasons why the order imbalance can be said to have a strong influence on the liquidity as follows: (1) Order Imbalance sometimes provides the private information that may reduce the liquidity for the time being and will also permanently change the market price. (2) High and random order imbalance will exacerbate the investment problems faced by the market maker, which is later explained by a change in the bid-ask spread that changes the pricing. So the order imbalance has a significant influence on the stock returns and liquidity. And it will affect the volume of trade.
The Hypothesis 8 (H8) : Trading volume
liquidity. The purpose of this research is to ascertain if there is a simultaneity effect between the trading volume and the order imbalance and what factors that may affect them.
RESEARCH METHODS
Population is the whole subject of research. In this research, the population used is all from the companies that are listed in index LQ 45 of 2014. Sample is a part of the subject population representing the entire population of fifty-five companies. The sample in this study is conducted by using the purposive sampling method. The methods of data collection are obtained through the financial books and international journals. The data used in this research is taken from the yahoo finance and the Indonesian Stock Exchanges. The analysis method used in this research is two stage least squares (2SLS) method that is used to answer whether there is a simultaneity relation between the trading volume and the order imbalance and what factors that may affect them.
Specification of variables used in this research is:
Y1 = Trading volume
X3 = Market capitalization
Y2 = Order imbalance
X4 = Tick Size
X1 = Past performance
X5 = Depth
X2 = Market risk
X6 = Bid-ask spread
RESULTS AND DISCUSSION
The equation of simultaneity test:
Table 1. Simultaneity test between trading volume and order imbalance by Two Stage
Least Squares (2SLS)
Variable Coefficient t-Statistic
C 0.030485 6.840714***
Y2 -12.15250 -0.631895
X1 0.008150 2.346865***
X2 0.004240 9.502352***
X3 8.59E-05 4.796411***
LNX4 -0.021694 -2.440781***
Sources: Eviews6 ***) sig 1%
According to table 1.1, the form of simultaneity test is:
Y1 = 0.030485 - 12.15250*Y2 + 0.008150*X1 + 0.004240*X2 + 0.0000859*X3 -0.021694*LNX4
which means that any increment of the risk market by 1000 will increase the volume of trade (Y1) by 4.240. The value of market risk is positive, indicating that the market risk has a positive effect on the trading volume, which means that the increasing of the market risk will make the increment in the trading volume. (e) Coefficient of market capitalization (X3) is 0.0000859, which means that any increment in market capitalization by 10,000 will increase the volume of trade (Y1) by 0.859. The coefficient of market capitalization is positive, indicating that market capitalization has a positive effect on the trading volume, which means that the increasing of the market capitalization will increase the trading volume. (f) Coefficient of tick size (X4) is -0.021694, which means that any increment in tick size by 1000 will decrease the trading volume (Y1) by 21.694. Value of tick size has a negative coefficient, indicating that the tick size negatively affects the trading volume (Y1), which means that the increasing value of the tick size will decrease the trading volume.
Table 2. Simultaneity test between order imbalance and trading volume by Two Stage Least
Squares (2SLS)
Variable Coefficient t-Statistic
C -4.15E-05 -0.116907 Y1 0.001598 0.144178 LNX4 0.000145 0.753727 X5 0.007015 0.921361 X6 0.004901 1.804926**
Sources: Eviews6 ; **) sig 5%
According to table 1.2, the form of simultaneity test is:
Y2 = 0,0000415 - 0.001598*Y1 - 0,000145*X4 + 0.007015*X5 + 0.004901*X6
The results can be explained as follows: (a) Constanta is 0.0000415, stating that if the independent variables are considered constant;
the average of the order imbalance is equal to 0.0000415. (b) Coefficient of trading volume decrease the trading volume. (c) Coefficient of tick size (X4) is 0.000145, which means that any increment of tick size by 1000 will decrease the order imbalance (Y2) to 0,145. Positive value of tick size indicates that tick size has a positive influence on the order imbalance, which means that the increment of the order imbalance will
increase the tick size. (d) Depth’s coefficient Coefficient of bid-ask spread (X6) is 0.004901, which means that any increment of the bid-ask spread by 1000 will increase the order imbalance (Y2) to 4.901. The coefficient of the bid-ask spread is positive, indicating that the depth has a positive effect on the order imbalance, which means that the increasing value of the bid-ask spread will increase the order imbalance.
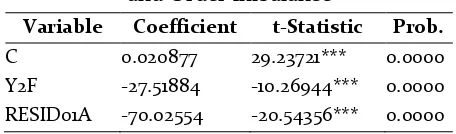
Table 3. Hausman Test of Trading Volume and Order Imbalance
Variable Coefficient t-Statistic Prob.
C 0.020877 29.23721*** 0.0000 Y2F -27.51884 -10.26944*** 0.0000 RESID01A -70.02554 -20.54356*** 0.0000
According to table 3, the probability of the order imbalance is significant because the
order imbalance’s probability is smaller than
the significance level (0.0000 < 0.05). So, there is a problem of simultaneity between the trading volume and the order imbalance.
Hypothesis Test
F Test. Based on the output result from Eviews 6, the value of the F statistic is smaller than the significance level (0.00000 < 0.05) so that the order imbalance, past performance, market risk, market capitalization and tick size have the significant effect on the trading volume simultaneously. Trading volume, tick size, depth and bid-ask spread have the simultaneity effect on the order imbalance.
Determination Test (R2). Based on the
output result of table 1.1, the R-squared and Adjusted R-squared are 0.751613 dan 0.747528, which means that the trading volume can be explained 75.16% by the order imbalance, past
performance, market risk and market
capitalization, while the rest 24.84% is explained by the factors that exclude from the model. On table 1.2, the R-squared and Adjusted R-squared are 0.583975 and 0.578519, which means that the order imbalance can be explained 58.39% by the trading volume, tick size, depth and bid-ask spread, while the rest 41.61% is explained by other factors outside the model.
T-Test. According to the result of table 1 and 2, the results can be explained as follows: (a) The effect of order imbalance on trading volume. The results show a negative coefficient of the order imbalance and theris no significant effect on the trading volume. The Hausman test shows that there is a simultaneity relation between the order imbalance and the trading volume. The coefficient of the order imbalance
is -12.15250, which means that if the order imbalance has increased, the trading volume will decrease. The value of the order
imbalance’s probability is 0.5279, which is
greater than the significance level (0.5279> 0.05). So, the order imbalance has no effect on the trading volume individually. (b) The effect of past performance on trading volume.The results show the positive coefficient and there is a significant effect on the trading volume. Coefficient of the past performance is 0,008150, which means that if the past performance has increased, the trading volume will also increase. The value of e
probability from the past performance is 0.0196, which is smaller than the significance level (0.0196 < 0.05). So, the past performance has the effect on the trading volume individually. (c) The effect of market risk on trading volume. The results show the positive coefficient and there is a significant effect on the trading volume. Coefficient of market risk is 0.00240, which means that if the market risk has increased, the trading volume will also capitalization on trading volume. The results show the positive coefficient and there is a significant effect on the trading volume. The
coefficient of market capitalization is
on trading volume. The results show the negative coefficient and there is a significant effect on the trading volume. The coefficient of tick size is -0.0217, which means that if the tick size has increased, the trading volume will decrease. The value of probability from tick size is 0.0152, which is smaller than the significance level (0.0152 < 0.05). So, the tick size has no effect on the trading volume individually. (f) The effect of trading volume on order imbalance. The results show the positive coefficient and there is no significant effect on the order imbalance. The Hausman test shows that there is a simultaneity relation between the trading volume and the order imbalance. The coefficient of trading volume is 0.001598, which means that if the trading volume has increased, the order imbalance will also increase. The value of probability from trading volume is 0.885, which is greater than the significance level (0.885 > 0.05). So, the trading volume has no effect on the order imbalance individually. (g) The effect of tick size on order
imbalance. The results show positive
coefficient and there is no significant effect on order imbalance. The coefficient of tick size is 0.000145, which means that if the tick size has increased, the order imbalance will also increase. The value of probability from tick size is 0.4516, which is greater than the significance level (0.4516 > 0.05). So, the tick size has no effect on the order imbalance individually. (h) The effect of depth on order imbalance. The results show the positive coefficient and there is no significant effect on the order imbalance. The coefficient of depth is 0.007015, which means that if the depth has increased, the order imbalance will also increase. The value of probability from depth is 0.3576, which is greater than the significance level (0.3576 > 0.05). So, the depth has no effect on the order imbalance individually. (i) The effect of bid-ask spread on order imbalance. The results show
positive coefficient and there is no significant effect on the order imbalance. The coefficient of bid-ask spread is 0.004901, which means that if the bid-ask spread has increased, the order imbalance will also increase. The value of probability from the bid-ask spread is 0.0721, which is greater than the significance level (0.0721 > 0.05). So, the bid-ask spread has no effect on the order imbalance individually.
Discussion
This research was performed on the companies listed in index LQ 45 of 2014. After going through some classical assumption test
(normality test, heterokedasticity test,
multicolinierity test and autocorrelation test), the model of this research is passed, which means that the regression model used in this research is feasible and there is no deviation. The result of the first hypothesis said that past performance has the positive and significant effect on the trading volume supporting the Efficient Market Hypothesis, a research conducted by Gervais and Odean (2001).
The result of the second hypothesis said that market risk has the positive and significant effect on the trading volume, which rejected the hypothesis and accepted the theory from Fama and French three factor models. Companies that have the high risk will make the high liquidity for the stock because it fits in
with the philosophy that ‘the high risk brings
about the high return’ and the investors believe
that. It supported the Fama and French three factors model but rejected the Efficient Market Hypothesis.
make a great future and give them the great return in the future because the company can survive well.
The result from the fourth hypothesis showed that tick size has the negative and significant effect on the trading volume. The trading volume will decline after the reduction of the tick size. And volatility will increase, so it will cause the cancellation of the stock significant effect on order imbalance. The result of sixth hypothesis showed that depth has positive but has no significant effect on order imbalance. The deepness of market in Indonesia cant measure the order imbalance in Indonesia. The result of seventh hypothesis showed that bid-ask spread has positive and no significant effect in order imbalance that rejected the theory of liquidity bid-ask spread. The result from eight hypothesis showed that there is simultaneity effect between trading volume and order imbalance but each of variable has no significant effect on each other.
CONCLUSION
The result of this research showed that the past performance, market risk, market capitalization and tick size has the effect on the trading volume but the order imbalance has no significant effect on the trading volume, meanwhile the trading volume, tick size, depth and bid-ask spread has no significant effect on the order imbalance. There is a simultaneity effect between the trading volume and the order imbalance. It means that in Indonesia, the investors can use the past performance, market risk, market capitalization, and tick size as the benchmark on their investment activity
because those variables are proven to have relations with the liquidity measured by the trading volume. Meanwhile, this research cannot give the factors that have the effect on the order imbalance. The trading volume, tick size, depth and bid-ask spread have no effect on the order imbalance in Indonesia. For further research, the researchers expect to look for the other variables that may more reflect the Intraday Patterns: Volume and Price Variability.
The Review of Financial Studies,Vol. 1, No. 1 (Spring, 1988), 3-40
Banz, Rolf W. 1981. “The Relationship Between Return and
market Value of common stocks”. Journal of
Financial Economics, Volume 9, Issue 1, March 1981, Pages 3-18
Chan, Kalok and Wai-Ming Fong. 2000. Trade size, order imbalance, and the volatility-volume relation.
Journal of Financial Economics 57, 247-273 Chordia, Tarun and Avanidhar Subrahmanyam. 2004.
“Order Imbalance and Individual Stock Returns:
Theory and Evidence”. Journal of Financial
Economics 72 pp 485-518
Chordia, Tarun., Richard Roll, and Avanidhar Subrahmanyam. 2002. “Order Imbalance,
Liquidity, and Market Returns”. Journal of
Financial Economics 65 pp 111-130
Fama, Eugene F. 1970. “Efficient Capital Markets: A
Review of Theory and Empirical Work”. The
Journal of Finance, Vol.25, No. 2
Fama, Eugene F and Kenneth R. French. 1992. “The
Cross-Section of Expected Stock Returns”. The Journal of
Finance, Vol. XLVII No. 2
Gervais, Simon and Terrance Odean. 2001. “Learning to Be
Overconfident”. Review of Financial Studies.
Volume 14, Issue 1, pp. 1- 27
Ghysels, E. and J. P. Pereira. 2008. “Liquidity and Conditional Portfolio Choice: A Nonparametric
Investigation.” Journal of Empirical Finance,
Volume 15, 2008, 679–699.
Harris, Lawrence. 1994. Order Exposure and Parasitic Traders. Paper for Deuttsche Borse AG, Marshall School of Business
Traded Funds. Journal Economic Finance Vol 37 pp 293-307.
Porter, David. and Daniel Weaver, 1997. Tick size and Market Liquidity, Financial Management 26, 5-26. Rastogi, Nikhil, Reddy V.N and Kiram Kumar Kotha. 2013. Order Imbalance and Returns : Evidence From India. International Journal of Managerial Finance
Vol 9 No 2 pp 92-109.
Schadewitz, H. and Niskala, M. 2010. Communication via responsibility reporting and its effect on firm value in Finland. Corporate Social Responsibility and Environmental Management, 17: 96–106.
Sumani, Christine Suhari. 2013. “Analisis Pengaruh Risiko Sistematis dan Likuiditas Terhadap Tingkat Pengembalian Saham dalam Perusahaan non-keuangan LQ 45 Periode 2007-2009”. Bina Ekonomi Majalah Ilmiah Fakultas Ekonomi Unpar.
Widarjono, Agus. 2007. Ekonometrika Teori dan Aplikasi, Edisi kedua, Ekonisia. Fakultas Ekonomi, UII Yogyakarta Zhakanova, Aliya and Okewuchu Lawrence Emeagwali.