54
Spatial Statistic Analysis of Earthquakes in Aceh Province Year 1921-2014:
Cluster Seismicity
Muzailin Affan
1*,
Muhammad Syukri
2,
Linda Wahyuna
1,
Hizir Sofyan
3Departement of Informatics Faculty of Mathematics and Natural Sciences, Syiah Kuala University, Banda Aceh, Indonesia; , Departement of Physics Faculty of Mathematics and Natural Sciences, Syiah Kuala University, Banda Aceh, Indonesia; Department of Statistics, Faculty of Mathematics and Natural Sciences, Syiah Kuala University,
Banda Aceh, Indonesia. Corresponding author, email: [email protected]
Received : 15 Juni 2016 Accepted : 22 Agustus 2016 Online : 30 Agustus 2016
Abstract - The purpose of this study is to apply the analysis of spatial patterns of earthquakes in the province of Aceh by detecting clusters and looking for spatial patterns locally and globally during the period 1921-2014 using GIS (Geographic Information System). The selected techniques are Average Nearest Neighbor, Moran Global Index, the Getis-Ord General G, Anselin Local Moran Index, the Getis-Ord Gi*, and Kernel Density Estimation. Each technique is implemented using GIS so that calculations can be done efficiently and quickly. The results of this study indicate that (1) The techniques can detect clusters of dots on the spatial pattern of earthquakes; (2) Both globally and locally, it shows that earthquakes clustered in the southwestern heading to the northern part of the province; (3) An earthquake with a greater magnitude generally concentrated in the district of Simeulue, the western part of Aceh Besar and northwest of Sabang.
Keywords: Earthquake; Clusters; Spatial pattern analysis; GIS; Aceh Province
Introduction
Aceh Province is situated in the western part of Sumatra Island. This province is geographically located in 2º-6ºN and 95°- 98°E and lies between the two tectonic plates, the Eurasian plate and the Indo-Australian plate. The movement between the Eurasian plate and the Indo-Australian plate produces a series of island arc (Forearch Islands) or non-volcanic prismatic accretion zone and Bukit Barisan mountains with volcanic tracks in the middle, and the active fault "The Great Sumatran Fault" which divides the island of Sumatra from the Gulf Semangko to Banda Aceh and extended into the sea of Andaman (Rusydy, 2013). This fault makes Sumatra Island as the areas prone to earthquakes. Therefore, the province of Aceh also is on the high seismic activity zone.
The high level of the damage and casualties caused by the occurrence of earthquakes in Sumatra, especially in the areas that were directly adjacent to the centers of the epicenter, a high danger zone, indicates that the mitigation efforts by both the government and society were still low. Mitigation and preparedness in anticipating the earthquake land were still very low and did not have a planned and systematic road map.
In anticipating earthquakes and following disaster, it is necessary to study the form of a geographic information system that maps the earthquake zones, particularly in the province of Aceh. This is a way to anticipate the possibility of damage caused by earthquakes, and the preparedness for earthquakes. In this research, data is analyzed based on the seismic classification by location, magnitude, and depth of the earthquake derived from historical data of post-tsunami earthquakes recorded by the Geologycal United States Survey (USGS) station using geographic information system (GIS). GIS is an information system that is enable to acquire, store, update, manipulate, analyze, and display all forms of geographically referenced information dealing with the problems mentioned above. In addition, GIS is also a system that can support decision making both spatially and temporally and can integrate location descriptions with the characteristics of a phenomenon found in the locations (Aronoff, 1989). In this study, the phenomenon is the earthquake. So the result of this study can be used as a reference and sources of earthquake information for the Province of Aceh.
Aceh International Journal of Science and Technology
ISSN: 2088-9860
55
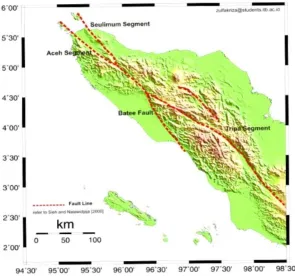
Aceh province lies on three active segment of Sumatra. This causes the province of Aceh often experiences earthquakes. In the last 30 years, there were 100 times earthquake more than 5 RS magnitude (Rusydy, 2013). Generally the earthquakes were caused by the movement of the plates around the province of Aceh. For example, the earthquake occurred on 26 December 2004. The earthquake occurred on the subduction zone along the 1600 km that stretched from Simeulue Island to the Andaman Islands region (Natawidjaja, 2007). The Aceh Province lies on three segments of the Sumatra fragment system, namely segment of Tripa, Aceh and Seulimeum.
Figure 1. Map of Northern Sumatra Fault (Sugiyanto et al., 2011)
Materials and Methods
Tripa, Aceh and Seulimeum Segments
Tripa runs between Southeast Aceh and Central Aceh. This segment has experienced an earthquake in 1990 in the district of Gayo Luwes with a magnitude of 6.8 Ms and in Southeast Aceh in 1936 with a magnitude of 7.2 Ms. Aceh segment extends from Central Aceh to Mata Ie and up to Pulau Aceh. Prior to 1892 this segment has not experienced an earthquake above 6 Mw. In 2013 this segment experienced a quake with a magnitude of 6 Mw in the region of Central Aceh and Bener Meriah.
The Seulimeum segment represents the active segment of the Sumatra fault that stretches from the northern part of Aceh. Active track segment is characterized by steep cliffs and divided sediment young volcano on the southwest side of Seulawah Agam volcano then passed the Seulimeum rivulet (Sieh and Natawidjaja, 2000). In this segment, frequent earthquakes occurred in 1964and December 17, 1975 with a magnitude of 6.2 Mw in Krueng Raya (Rusydy, 2013).
Spatial data
56
method (1985) to separate between the data of the main quake and the aftershocks. The result of de-clustering process for the USGS is the earthquake data of 3776 from 4901 data.
Analysis of Spatial Statistics Average nearest neighbor analysis.
The average Nearest Neighbor (ANN) calculates the distance between each feature centroid and the closest central neighbors location. Then averaging all distances nearest neighbors (Environmental Systems Research Institute, 2009).
ANN= D̅O
D̅E ... ...(1) D̅O is the mean distance between each feature and the nearest neighbor.
D̅O= ∑ni=1di
n ... (2)
di is the distance between the feature and the nearest neighbor i, n is the total number of features, A is the total area of research and is the average distance expected between features.
D̅E= 0,5
√n/A...(3)
ANN calculate nearest neighbor index based on the average distance from each feature to its nearest neighboring feature (only the x and y coordinates) and the associated z values. If the index is less than 1, the pattern is clustered. If the index is more than 1, the pattern shows a tendency to spread. A Z-score, or measurements of a standard deviation, indicating a statistically significant value. If the Z value is less than 1.96 or more than 1.96 indicates that a significant grouping pattern or scattered (p <0.05). If the value Z between values of 1.96 and 1.96, the pattern of random distribution (Mitchell, 2005).
Global Moran index (Global Moran's I)
Global Moran Index provides a measure of the degree of spatial autocorrelation based on the location of the events and the values associated with the event during the same time. The index indicates the level of spatial concentration or dispersion of a specific point pattern (Scott and Janikas, 2010). The associated GMI and value of Z will be calculated to determine whether the spatial patterns of the earthquake are in groups, scattered or random. If the Z value is less than -1.96 or more than 1.96 in the analysis of spatial autocorrelation, then the pattern is dispersed or clustered (p <0.05). If the Z value is between -1.96 and 1.96, then the pattern is randomized (Mitchell, 2005).
GMI=Sn coefficient ranges between -1 and +1. The autocorrelation is negative (no correlation) when the index value between 0 and -1. Meanwhile, if the autocorrelation is positive (correlation), the index value between 0 and +1. Moran's index values which are negative and positive have spatial relationship with the surrounding area.
The Getis-Ord general G
Statistical method Getis-Ord General G (GOGG) was developed by Getis and Ord as global statistics tool to analyze spatial patterns (Getis and Ord, 1992). GOGG is inferential statistics tool, the technique of data analysis used to determine the extent of the similarity between the results obtained from a sample and the results to be obtained in the overall population, which means that the results of this analysis be interpreted in the context of the null hypothesis. Null hypothesis at GOGG states that no spatial grouping is on the feature values.
This method quantifies grouping levels to high or low value to find out whether it is a hotspot or coldspot. If the z value is positive and the index value observed by this method is greater than expected, then it indicates that the high values are clustered in the research area. While if the z value is negative and the GOGG observed value is smaller than expected, then low values are clustered in the study area. This method overall is calculated by the formula as follow:
GOGG=∑ ∑ni=1 nj=1ωi,jxixj
57 Kernel Density Estimation
Kernel Density Estimation (KDE) is a non-parametric spatial interpolation method which analyzes the nature of the first orde from distribution point by calculating the density (Silvermen, 1986).The general form of KDE functions on two-dimensional plane is:
λ(s)=∑ni=1πr12k
dis
r ... (6)
Where λ (s) is the density at location s, r is the radius or bandwidth of KDE, n is the number of sample points, and k is the weight of point i on distance dis to location s. Surface value is the value of the location point minus the distance from the point, close to zero at the radius point. The variable k is usually modeled as a function of the ratio between the kernel and r. KDE is applied for research that produces a continuous surface map on the quake density based on the location and the value of the quake, where the density of a location reflects the concentration of earthquakes in the surrounding area (Ahmadi et al., 2014).
Because the kernel density calculations in ArcGIS are raster-based, the grid size will greatly affect the level of detail on the calculation result estimation. There is no general criteria that can be used as a reference. Not necessarily meaning the smallest size grid will give the best results because it will provide more detailed outputs. The width of the study area, the quality of data, the distance between the reference point and the volume combination of each reference point greatly affect the accuracy and the depth of the calculation results (Handayani and Rudianto, 2012).
Anselin Local Moran Index
This method aims to measure the strength of the pattern for each feature. Anselin (1995) suggested that Anselin Local Moran Index of identifying local clusters and outliers can be calculated by the following
xiis an attribute of the feature i, X̅ is the average of the corresponding attributes, and ωi,jis spatial weights between the feature i and j. The positive value of this method indicates that a feature has neighboring features with the same attribute values either high or low (Anselin, 1995). Clusters of value comprise the high value (High-High) and lower value (Low-Low) (Anon., 2012). Negative values identify the dissimilarity value of neighboring features that are considered outliers. This feature is surrounded by different values. Statistical significant outliers can be surrounded by a high value or low value (Anselin, 1995). A high-value feature which is surrounded by a low value would be High-Low and a low-value feature which is surrounded by a high value would be Low-High (Anon., 2012). In both cases, the p-values should be small enough (p> 0.05) for the cluster or outlier to be considered statistically significant (Anselin, 1995).
Getis Ord Gi *
This method is a local form of the Getis-Ord General G method that shows hot spots, a cluster of high values and cold spots, a cluster of low value. To be statistically significant value then the point hotspot and coldspot to be surrounded by the same values that are lower or higher than the value of its neighbors (Anon., 2012). The calculation of the Getis Ord Gi value is as follows:
Gi*= ∑nj=1ωi,jxj-X̅ ∑nj=1ωi,j √[n∑nj=1ωi,j2-∑nj=1ωi,j 2]
n-1
s ...(8)
� is the attribute value of feature j and �, is the spatial weights between the feature i and j for n features. Gi* uses basic environment either on adjacent or far apart features and restore the value of Z. For Z positive
58
Results and Discussion
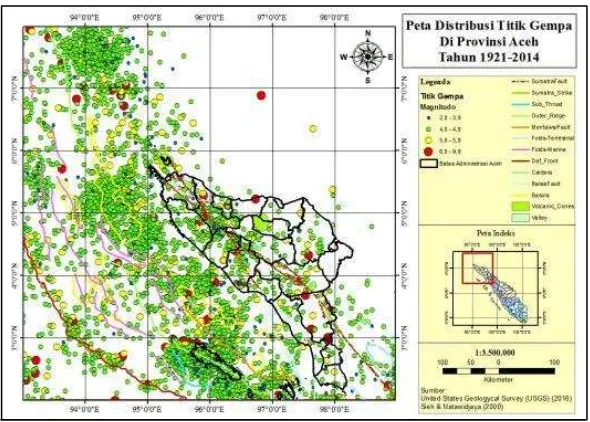
This study covers 3,776 of earthquake data from 1921-2014 with a magnitude > 2 RS which was obtained from the USGS. The statistic description can be seen in Table 1.1. The percentage of the highest earthquake is the 4> M> 4.9 scaled earthquake with a value of 79.16%. For the 5> M> 5.9 magnitude, occurred at 10.83%. These statistics show that Aceh province has an active seismic. After the seismic data is converted into the database ArcMap and geometry correction using WGS 1984, the results obtained can be seen in Figure 2.
Table 1. Statistic table of earthquakes that happened in 1921-2014
Magnitude Earthquake
Total % earthquake
Minimum Magnitude
Maximum Magnitude
Mean Magnitude
SD Magnitude
2≤M≤3.9 159 4.21 2.7 3.9 3.8 0.2
4≤M≤4.9 2989 79.16 4.0 4.9 4.5 0.2
5≤M≤5.9 542 10.83 5.0 5.9 5.3 0.3
6≤M≤9.9 86 1.85 6.0 9.1 6.4 0.5
2≤M≤9.9 3776 100.00 2.7 9.1 4.6 0.5
Table 2. Analysis Result of Average Nearest Neighbor
Magnitude Average Nearest Neighbor
Index Z Statistic P value Pattern type
2≤M≤3.9 0.864845 -3.260327 0.001113 Clustered
4≤M≤4.9 0.717000 -29.599259 0.000000 Clustered
5≤M≤5.9 0.667905 -14.790833 0.000000 Clustered
6≤M≤9.9 0.756497 -4.320015 0.000016 Clustered
2≤M≤9.9 0.724027 -32.442462 0.000000 Clustered
59
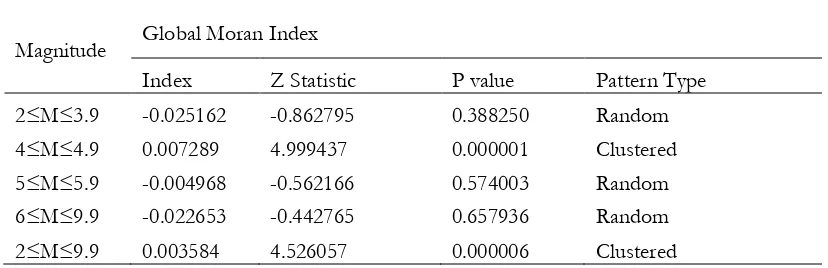
Table 3. Analysis result of Global Moran Index
Magnitude Global Moran Index
Index Z Statistic P value Pattern Type
2≤M≤3.9 -0.025162 -0.862795 0.388250 Random
4≤M≤4.9 0.007289 4.999437 0.000001 Clustered
5≤M≤5.9 -0.004968 -0.562166 0.574003 Random
6≤M≤9.9 -0.022653 -0.442765 0.657936 Random
2≤M≤9.9 0.003584 4.526057 0.000006 Clustered
Table 4. Analysis result of Getis-Ord general
Magnitude Getis-Ord General Index
Index Z Statistic P value Pattern type
2≤M≤3.9 0.126136 0.247256 0.80471 Highly Clustered
4≤M≤4.9 0.082739 3.285682 0.001017 Highly Clustered
5≤M≤5.9 0.167431 0.425931 0.670158 Highly Clustered
6≤M≤9.9 0.244874 0.379736 0.704141 Highly Clustered
2≤M≤9.9 0.152044 0.928326 0.353238 Highly Clustered
The calculations of ANN, IGM and GOGG are global spatial statistical calculations. The results of ANN, IGM and GOGG respectively are; 0.724, 0.003 and 0.152044, where the value is smaller than 1 which indicates that the pattern of earthquake is clustered. Thus, these three methods showed that the pattern of an earthquake in Aceh province is spatially clustered. According to Table 2, 3, and 4, it is found that for each category of magnitude, only ANN method that showed the consistency of spatial clustered data. In contrast to the IGM method, the results indicate the data grouping is only in the magnitude category 4≤M≤4.5 and 2≤M≤9.9, where other categories showed spatial random data. GOGG method showed high spatial groupings for all categories.
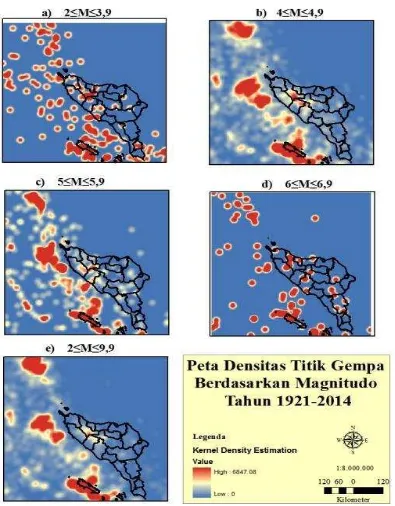
Figure 3 shows the pattern of earthquake spots distribution based on the height of magnitude by using KDE method. In the Figure 3.a, the earthquake points are spread almost evenly in several areas of Aceh province. In the Figure 3.b and c, there are concentration earthquake points in the western region of Aceh Besar, northwestern city of Sabang and Simeulue. As for the Figure 3d, concentration earthquake point is at Simeulue region.
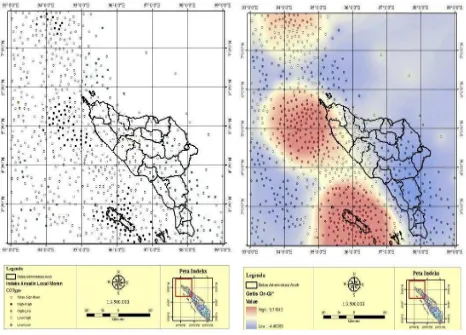
From Figure 4 it can be seen that the points that are valued High-High (colored in black) located around the western part of Aceh Jaya and around the Simeulue Island, it indicates that the dots have a high cluster, so that the region has high seismic activities. As for the points that are valued Low-Low (blue colored), spread around the eastern region of Aceh province indicating that this point has a low cluster, so that the region has low seismic activities.
60
61
Conclusions
The results of ANN, IGM and GOGG, respectively, are 0.724, 0.003 and 0.152044, where the value is smaller than 1 which indicates that the pattern of earthquakes is clustered. Thus these three methods showed that the pattern of earthquakes in Aceh province is spatially clustered.
The results of KDE method that was presented in main text explained that for 2≤M≤3.9 magnitude, the earthquake points are spread almost evenly in several areas of the province. For 4≤M≤4.9 and 5≤M≤5.9 point magnitude earthquake are concentrated in the western region of Aceh Jaya which coordinates 5º- 94º- 5.5º N and 94º- 95º E, northwest of Sabang city in the coordinates 7.5º- 8.0º N and 94º- 94.5º E and Simeulue at coordinates 2.3º- 3.0º N dan 95.6º- 96.6º E. As for the point magnitude earthquake 6≤M≤6.9 concentrated in the Simeulue. Based on the method Anselin Local Moran Index and the brittle-Ord Gi * indicates that the area around the western Aceh Jaya and around the island Simeulue, has high seismic activity. As for the eastern region of Aceh province showed low seismic activity.
References
Ahmadi, K. A., Amri, A. A. and See, L. 2014. A spatial statistical analysis of the occurrence of earthquakes along the Red Sea floor spreading: Clusters of seismicity. Arabian Journal of Geosciences, 7(7): 2893-2904.
Anonimous. 2012. Spatial statistics using GIS. https://libraries.mit.edu/files/gis/spatialstat presentation_iap2012.pdf. Accessed on 24 June 2016.
Anselin, L. 1995. Local indicators of spatial association – LISA. Geographical Analysis, 27(2): 93-115
Aronoff, S. 1989. Geographic information system: a management perspective. WDL Publisher Ottawa, Canada. Environmental Systems Research Institute (ESRI). 2009. ESRI.
http://webhelp.esri.com/arcgisdesktop/9.3/index.cfm? TopicName= How%20Average%20Nearest%20Neighbor%20Distance%20(Spatial%20Statistics)%20works. Accessed on 7 December 2015
Getis, A. and Ord, K. 1992. The analysis of spatial association by use of distance statistics. Geographical Analysis, 24(3): 189-206.
Figure 4. Spatial Clustering Map, using Anselin
62
Handayani, W. and Rudianto, I. 2012. Dinamika persebaran penduduk Jawa Tengah: perumusan kebijakan perwilayahan dengan metode kernel density. Diponegoro University Institutional Repository, Semarang.
Mitchell, A. 2005. The ESRI guide to GIS analysis, spatial measurements. ESRI, Redlands, CA.
Natawidjaja, D. H. 2007. Gempabumi dan tsunami di Sumatra dan upaya untuk mengembangkan lingkungan hidup yang aman dari bencana alam. Geospasial, Kementerian Lingkugan Hidup, Jakarta.
Reasenberg, P. 1985. Second-order moment of central California seismicity, 1969-1982. Journal of Geophysical Research, 90: 5479 - 5495
Rusydy, I. 2013. Melihat kembali patahan yang berada di Aceh.http://www.ibnurusydy.com/melihat-kembali-patahan-yang-berada-di-aceh. Accessed on 16 November 2014.
Scott, L. M. and Janikas, M. V. 2010. Spatial statistics in ArcGIS. In: Fischer, A.A. and Getis, A. (eds.), Handbook of Applied Spatial Analysis.Springer-Verlag, Berlin Heidelberg.
Sieh, K. and Natawidjaja, D. 2000. Neotectonics of the Sumatran fault, Indonesia. Journal of Geophysical Research, 105: 28295-28326.
Silvermen, B. 1986. Density estimation for statistics and data analysis. Chapman Hall, London.
Sugiyanto, D., Zulfakriza, Ismail, N., Adriansyah, F., Meilano, I., Hasanuddin, Z.A. 2011. Analisa deformasi permukaan patahan aktif segmen Seulimum dan Segmen Aceh. Banda Aceh. Prosiding Hasil Penelitian Kebencanaan TDMRC Unsyiah, Banda Aceh, 13-19 April 2011. pp. 72-77.
USGS. 2012. Earthquake hazards program. http://earthquake.usgs.gov/earthquakes/ eqarchives/year/eqstats.php. Accessed on 16 June 2016.