111
Sediment of Porong River Estuary
Eny Susilowati
1*, Arief Rahmansyah
2, Sudarto
31 Environment and Development Management, Graduate Programme, Brawijaya University 2Civil Engineering Department, Faculty of Engineering, Brawijaya University
3Soil Science Department, Faculty of Agriculture, Universitas Brawijaya
Abstract
Study on heavy metal contaminants in sediments provide major role because they have longer residence time. Increased levels of heavy metals in water which originally required for various metabolic processes may turn out to be toxic to aquatic organisms. The metal will be absorbed in the sediment then accumulated into microorganisms through the food chain. The purpose of this study is to analyze the spatial concentration of heavy metals in aquaculture’s sediments of in Porong River estuary. Firstly, this research was conducted by examined content of eight heavy metals in the sediment, then tested with ICP-MS instruments. Then, the calculation of some parameters was analyzed spatially with ArcGIS. IgeO Parameter of aquaculture sediment of Porong River Estuary from largest to smallest is are Hg> Pb> Cd> Mn> As> Cu> Zn> Co. EF value of aquaculture sediment of Porong river estuary from largest to smallest values are Hg> Pb> Cd> Mn> Cu> As> Zn> Co. DC Results obtained in all 12 stations of this study has value between is 27.47- 36.35 within the categorization Very High Degree of Contamination. ERI value shows that almost entirely area of Porong river estuary shows High Risk result.
Keywords: Aquaculture, Heavy metal contamination, Porong river estuary, Sediment, Spatial
INTRODUCTION(
In the hydrological cycle less than 1% of the dissolved pollutants in water while more than 99% is stored in sediments which are the main carriers of contaminants in aquatic environments [6]. Spatial survey of metal concentrations in sediments were compared with baseline from unpolluted environment. This is a key step in the understanding of transport and deposition of metal contaminants in aquatic systems [11]. Analysis of sediment plays an important role in the assessment of pollution status and determination of sources of contaminants [13]. The river has always been a place that has contaminated sediment disposal. Contamination in the river can be analyzed using either water or sediment suspended, the study of sediments provide a major role because they have a longer residence time [10] [14]. Increased levels of heavy metals in water which originally required for various metabolic processes may turn out to be toxic to aquatic organisms. As a result, the metal will be absorbed and stored in the sediment, then accumulated into microorganisms through the food chain [4] [5] [8].
Correspondence address:
Eny Susilowati
Email : [email protected]
Address : Program Pasca Sarjana, Universitas Brawijaya Jl. Mayjen Haryono 269, Malang 651145
Heavy metal density at least five times higher than the density of water. Heavy metals are easily adsorbed to sediments, which can act as a sink and secondary source of these contaminants in water and aquatic biota [12] .Porong River estuary has been used as aquaculture ponds with main commodities are shrimp and fish [7]. Increase and development of the industries along the river Porong beside gave positive impacts on development, it can also have negative impacts on the surrounding aquatic ecosystems.
One of GIS products is in the form of a map. A map is basically a set of information obtained from the processing and analysis of data. Spatial distribution of heavy metals in sediments is also very important to explain the history of contamination of aquatic ecosystems, and very useful for distinguish heavy metals in sediments that affected by natural or anthropogenic factors [11].
MATERIAL AND METHOD
112
Cn is the concentration of heavy metals in sediment,
Bn is the background concentration geochemical or reference value,
Factor of 1.5 is used to minimize variations in the background for geogenic effect.
Igeo Index are divided into seven classes of the following categories:
≤0 Unpolluted
0–1 Unpolluted to moderately polluted 1–2 Moderately polluted
2–3 Moderately polluted to strongly polluted 3–4 Strongly polluted
4–5 Strongly to extremely polluted >5 Extremely polluted
In addition, there are also Enrichment Factors (EF). They were originally developed to estimate the origin of metals in the atmosphere, precipitation, or seawater. EF index was developed further to study the soil, lake sediment, peat, tailings, and other environmental materials. EF analysis is used to detect the source of pollutants, whether from natural or anthropogenic activities. EF method will normalize the measured data concentration of heavy metals in sediment samples with reference [1] [4]. The formula for calculating EF has been defined by the Buat-Menerd and Chesselt in 1979, while the formula is as follows:
EF =
Cn (sample) is the content of metals in the environment checked,
Cref (sample) is the content of the reference element in the environmental review,
Bn (background) is the content of the metal examined in a reference environment, Bref (background) is the reference in the metal
content of the reference environment.
EF grades are divided into five classes, namely
EF ≤ 2 Deficiency to minimal enrichment 2 < EF ≤ 5 Moderate enrichment 5 < EF ≤ 20 Significant enrichment 20 < EF ≤ 40 Very high enrichment
40 < EF Extremely high enrichment
Degree of Contamination (DC) is used to assess the level of contamination / pollution by multi-metals in sediments. Hakanson (1980)[9], propose indicators of the overall contamination by integrating data for a series of seven specific heavy metals and organic pollutants PCB [8]. This method was based on calculations for each pollutant of the contamination factor (Cf). However, Cf requires at least five sediment samples to produce an average pollutant concentrations compared to the reference level. The formula for calculating the level of contamination (DC) are:
Cfi is metal contamination factor i,
C0-1 is the average value of the metal from at least five sampling sites,
Cni is the pre-industrial concentration of individual metal (equal to the metal geochemistry background value n).
DC is divided into 4 classes:
DC ≤ 6 Low degree of contamination
6 < DC ≤ 12 Moderate degree of
contamination
12 < DC ≤ 24 Considerable degree of
contamination
24 < DC Very high degree of contamination
In this study PCB is replaced with other heavy metals so that total of 8 heavy metals that being examined, and in addition to 5 samples then it used only 2 repetitions.
Ecological Risk Index (RI) is based on the characteristics of the metal and environmental behavior. This index is used to evaluate the ecological risks of multi-metal contaminants in sediments [8]. The formula for calculating the ecological risk factor index (RI) are:
Er I is potential ecological risk factors metals i, T r I is a metal toxic response factor i,
113
150 < RI ≤ 300 Moderate risk 300 < RI ≤ 600 Considerable risk
600 < RI High risk
Data Collection
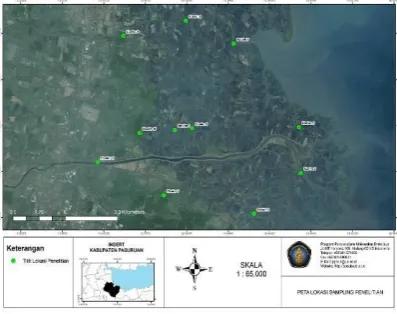
Using the grid method, the location of the samples was determined by specific locations which were chose to represent the characteristics of the local ponds. Sediment sampling sites chose at each grid. Whereas intake of sediment is determined at the location of aquaculture pond around the north and south along Porong river estuary. Reference stations that describe the environment conditions at the time of the pre-industrial has been arboretum in the village Sumber Brantas, Bumiaji, Batu City.
Figure 1. Sediment sampling location
The sediment samples which taken in this study is the surface sediment, sediment were taken with a grab sampler that has been modified. Firstly, laboratory testing was conducted by destructing samples, the destruction were performed using a Microwave Digester Mars 6. Then, samples that have been calculated with MS-Excel for data computation to get a spatial map used ArcGIS 9.3.
RESULT AND DISCUSSION
Heavy Metal concentrations that examined in this study are Aluminum (Al), calcium (Ca), Manganese (Mn), Cobalt (Co), copper (Cu), zinc (Zn), arsenic (As), cadmium (Cd),
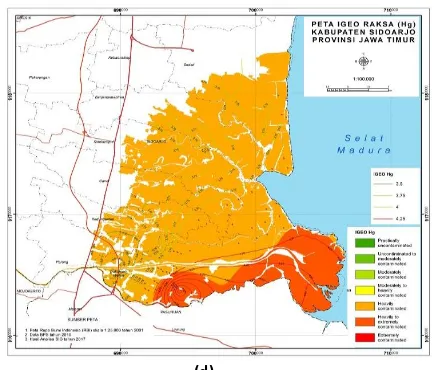
parameters of heavy metals such as Mn, Co, Cu, As and Cd showed category Igeo ≤1 almost in the entire area of research defining that aquaculture area is not contaminated by the heavy metal. Other patterns of Zn metal shown that the vast majority (20.192 ha) is in the range 1 <Igeo≤ 2 which shows the level of pollution being moderate. Hg showed a very different pattern in 17.373 ha in the range of 3 <IgeO ≤4 and the
balance of 3961 hectares in the range 4 <Igeo≤5
showing the heavily polluted up to extreme polluted. Pb shows that most of the study area (21.184 ha) is in the range of 2 <IgeO≤3. This indicates the region in the level of polluted moderate to heavily polluted.
Igeo distribution pattern for heavy metals in aquaculture sediments of Porong river estuaries obtained results that indicate the distribution of heavy metals contained in the sediments Hg higher on the south side Porong estuaries, and almost similar pattern is also seen in metal Cu. Igeo of sediment Cultivation Around Porong River Estuary from largest to smallest is Hg> Pb> Cd> Mn> As> Cu> Zn> Co.
114
(a)
(b)
( c)
(d)
Figure 2: Distribution of geoaccumulation index of (a) Cd,
Igeo ≤ 1; (b) Zn, 1 <Igeo≤ 2); (c) Pb (2 <Igeo≤ 3); (d) Igeo Hg (3 <Igeo≤ 4 dan 3 <Igeo≤ 4)
(a)
115 (c)
(d)
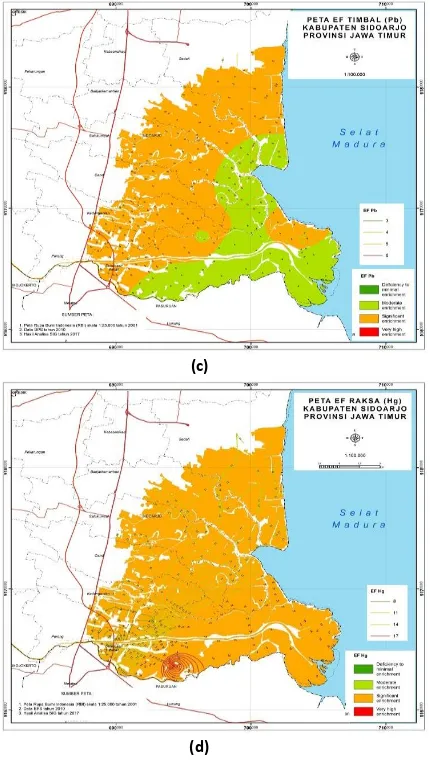
Figure 2: Distribution of Enrichment Factor index of (a) Co
(EF≤2, Natural Source Enrichment); (b) Cu
(EF≤2, Natural source enrichment)); (c) Pb
(2<EF≤5, Partly Anthropogenic enrichment); (d)
EF Hg (Anthropogenic enrichment)
The Degree of contamination (DC) is an index to assess the extent of multi-metal contamination in the sediments, which is different from a single metal factor. The level of contamination is the sum value of each individual metal which is shared with the pre-industrial concentration (background), in this study was obtained from the sum of 8 individual metals (Mn, Co, Cu, and Zn, As, Cd, Hg and Pb).
DC Results obtained in all 12 stations in this study gave value 27.47 – 36.35 and the overall area of 21.334 hectares of the research area shows the results of Very High Degree of Contamination. At The starting point of the Porong River flow at Station 12 (Mlirip Zone) has obtained results that indicate the condition of the level of contamination is very high.
Figure 4. Degree of Contamination (DC) Aquaculture sediment of Porong River estuary.
Ecological Risk Index (ERI) is based on the characteristics and behavior of metal in environment. This index is used to evaluate the ecological risks of multi-metal contaminants in sediments. Value ERI showed almost total (20.767 of 21 344 Ha) of overall land in area aquaculture of Porong river estuary shows the results of High Risk, both in the area adjacent to the sea (Stations 3,4 and 7), adjacent to the river (Stations 3 and 11) and adjacent to the area of rice cultivation (station 1, 10 and 11). If the terms of the original flow in Porong river contamination (especially Hg) is located in an area between the water source Sumber Brantas until before the location of the station 12
.
116
CONCLUSION
In general, the condition of aquaculture sediment in Porong River estuaries meet the threshold. Igeo distribution pattern indicated that the distribution of heavy metals contained in the sediments Hg higher on the south side of estuaries. EF value of aquaculture sediment around Porong river estuary, from largest to smallest values, are Hg> Pb> Cd> Mn> As> Cu> Zn> Co. DC results obtained in all 12 units of this study gave value 27.47 – 36.35 is within categorization of Very High Degree of Contamination. ERI value shows that almost the entirely of the area shows the results of High Risk. Spatial analysis concluded sediment conditions in the area of aquaculture in Porong River estuaries in conditions that are contaminated by heavy metals, and heavy metals Hg (mercury / mercury) provided the largest contribution.
ACKNOWLEDGEMENT
The author would like to thank. Dr.rer.nat. Ir. Arief Rahmansyah and Dr.Ir.Sudarto, MS, as a team of tutors who leads the author from the beginning to the end of the study.
REFERENCES
[1]. Abrahim, G.M., Parker, R.J., 2008. Assessment of heavy metal enrichment factors and degree of contamination in marine sediments from Tamaki Estuary, Auckland, New Zealand, Environ Monit Asses 136 : 227-238
[2]. Boumans, P.W.J.M (Editor).1987. Inductively coupled plasma-emission
spectroscopy (Methodology,
Instrumentation and Performance)-Part 1. John Wiley & Sons. New York
[3]. Carman Ip, C.M., Li, X.D., et al. 2006. Trace Metal distribution in sediment of the Pearl River Estuary and surrounding coastal area, South China, Environmental Pollution 147:311-323
[4]. Cheng, W.H., Yap, C.H. 2015. Potential human risk from toxic metal via mangrove snail consumption and their ecological risk assessment in the habitat sediment from Peninsular Malaysia. Chemosphere 135: 156-165
[5]. Cheng, Z., Man, Y.B., Nie, X.P., Wong 2013 Trophic relationship and health risk assessment of trace metals in aquaculture pond ecosystem of Pearl River Delta, China. Chemosphere 90:2142-2148.
[6]. Edokpayi,J.N., Odiyo,J.O., Popoola,O.E., Msagati,T.A.M., 2016.Asesssment of trace metal contamination of Surface water and Sediment : A Case study of Mvudi River, South Africa. Sustainibility 8 : 135
[7]. Garno, Y.S. 2004. Pengembangan budidaya Ningxia-Inner Mongolian reaches, Yellow River, China, Chemosphere 144: 29-42 [9]. Hakanson, L. (1980) Ecological Risk Index for
Aquatic Pollution Control. A Sediment logical Approach. Water Research, 14, 975-1001
[10]. Mutia,T.M., Virani, M.Z., Motuei,W.N., Muyela,B., Mavura,W.J., Lalah,J.O 2012 Copper, Lead and Kadmium concentrations in surface water, sediment and fish,C.Carpio, samples from lake Naivasha : Effect on recent anthropogenic activities. Environ.Earth Sci 67: 1121-1130
2015. Spatial variation, environmental risk and biological hazard assessment of heavy metals in surface sediments of the Yangtze River estuary, Marine Pollution Bulletin, 93:250–258.
[14]. Wang, J., Liu, R, .et.al 2015. Spatial variation, environmental assessment and source identification of heavy metals in sediments of the Yangtze River Estuary, Marine Pollution Bulletin 87:364–373.
ABBREVIATION :
DC : Degree of Contamination EF : Enrichment Factor ERI : Ecological Risk Index
GIS : Geographical Information System ICP-MS : Inductively Coupled Plasma- Mass Spectrometry