SPATIAL REGRESSION ANALYSIS TO EVALUATE
INDONESIAN PRESIDENTIAL GENERAL ELECTION
ALAN DUTA DINASTY
DEPARTMENT OF STATISTICS
FACULTY OF MATHEMATICS AND NATURAL SCIENCES BOGOR AGRICULTURAL UNIVERSITY
PERNYATAAN MENGENAI SKRIPSI DAN SUMBER
INFORMASI SERTA PELIMPAHAN HAK CIPTA*
Dengan ini saya menyatakan bahwa skripsi berjudul Spatial Regression Analysis to Evaluate Indonesian Presidential General Election adalah benar karya saya dengan arahan dari komisi pembimbing dan belum diajukan dalam bentuk apa pun kepada perguruan tinggi mana pun. Sumber informasi yang berasal atau dikutip dari karya yang diterbitkan maupun tidak diterbitkan dari penulis lain telah disebutkan dalam teks dan dicantumkan dalam Daftar Pustaka di bagian akhir skripsi ini.
Dengan ini saya melimpahkan hak cipta dari karya tulis saya kepada Institut Pertanian Bogor.
Bogor, Juni 2014
ABSTRACT
ALAN DUTA DINASTY. Spatial Regression Analysis to Evaluate Indonesian Presidential General Election. Advised by ASEP SAEFUDDIN and YENNI ANGRAINI.
Indonesia has held two presidential elections in 2004 and 2009. The result of these elections shows that number of voter abstention is very high. On the first term of 2004 presidential election, about 21.77% of official voters were abstain. On the second term, it increased to 23.37%. Five years later, the number of voter abstention was still high which increased to 27.19%. This research aims to identify spatial pattern and spatial relationship of 33 provinces that produce voter abstention number in the 2009 presidential elections and to identify voter characteristics. The data used are secondary data from General Election Commision of Indonesia (KPU) for an official result of 2009 presidential election and Central Bureau Statistics of Indonesia (BPS) for characteristics of provinces. The results of this research show that there is positive spatial autocorrelation for voter abstention data, which means that there are similiar proportion of provinces to their neighbors in Indonesia. Provinces that are significant to spatial autocorrelation are Riau, Riau Islands, West Sumatera, Central Kalimantan, and Gorontalo. According to significant provinces, there are not province identified as hotspot or coldspot observation. Determining factors that are significantly affected to voter abstention using Spatial Error Model (SEM) is better than Spatial Autoregressive Model (SAR) and Multiple Linier Regression. There are six significant explanatory variables, i.e. percentage of poor people, monthly average of wage/salary/income of employee, mean years of schooling population 15 years of age and over, human development index, school enrollment ratio 16-18 years of age, and life expectancy at birth.
Scientific Paper
to complete the requirement for graduation of Bachelor Degree in Statistics
at
Department of Statistics
SPATIAL REGRESSION ANALYSIS TO EVALUATE
INDONESIAN PRESIDENTIAL GENERAL ELECTION
ALAN DUTA DINASTY
DEPARTMENT OF STATISTICS
FACULTY OF MATHEMATICS AND NATURAL SCIENCES BOGOR AGRICULTURAL UNIVERSITY
Title : Spatial Regression Analysis to Evaluate Indonesian Presidential General Election
Name : Alan Duta Dinasty NIM : G14100072
Approved by
Prof Dr Ir Asep Saefuddin, MSc Yenni Angraini, SSi, MSi Advisor I Advisor II
Acknowledged by
Dr Anang Kurnia, MSi Head of Department
ACKNOWLEDGEMENTS
Alhamdulillahi rabbil ‘alamin, the great praise only to Allah SWT, God of The Universe. The author felt deeply grateful to Allah SWT for all mercy, blessing and guidance especially in completing this paper entitled “Spatial Regression Analysis to Evaluate Indonesian Presidential General Election”.
The author realizes that the completion of this research would not be possible without the support and help from many people. The author would like to express his sincere gratitude to the advisors, Prof Dr Ir Asep Saefuddin, MSc and Yenni Angraini, SSi, MSi for his/her guidance and suggestion for this research. The author is also grateful to his beloved mother, Rina Utami and great father, alm. Sunarso and also brother Enggal Augusendy for their never ending prayer, love, and support. Sincere gratitude is also expressed to Penny Septina for her support, prayer, and motivation to author completing his study. Appreciation is
presented to author’s all friends, especially to Statistika 47 for the empathy and togetherness in finding knowledge and friendship. Hopefully all the kindness by Allah SWT and this paper could be useful for all those who read.
Bogor, June 2014
CONTENT
LIST OF TABLE viii
LIST OF FIGURE viii
LIST OF APPENDIX viii
INTRODUCTION 1
Background 1
Objectives 2
METHODOLOGY 2
Data Sources 2
Methods 3
RESULT AND DISCUSSION 8
Data Exploration 8
Multiple Linier Regression 10
Spatial Autocorelation 10
Global and Local Moran Index 11
Spatial Regression Model 13
Spatial Weight Matrix 13
Spatial Effect Test 15
Spatial Error Model (SEM) 15
CONCLUSION AND RECOMMENDATION 19
Conclusion 19
Recommendation 20
REFERENCES 20
APPENDIX 22
LIST OF TABLE
1
.
Independent and explanatory variables 22
.
Descriptive statistic of voter abstention 9 3. Parameter estimates and p-values of ten explanatory variables 10 4. Result of diverse approaches of weight matrix 145. Value of lagrange multiplier 15
6. Result of Spatial Error Model (SEM) 15
LIST OF FIGURE
1.
The distribution of voter abstention for all provinces 82. Quantile map of voter abstention 9
3. Significance map of local moran index 11
4. Cluster map of local moran index 11
5. Moran scatter plot 12
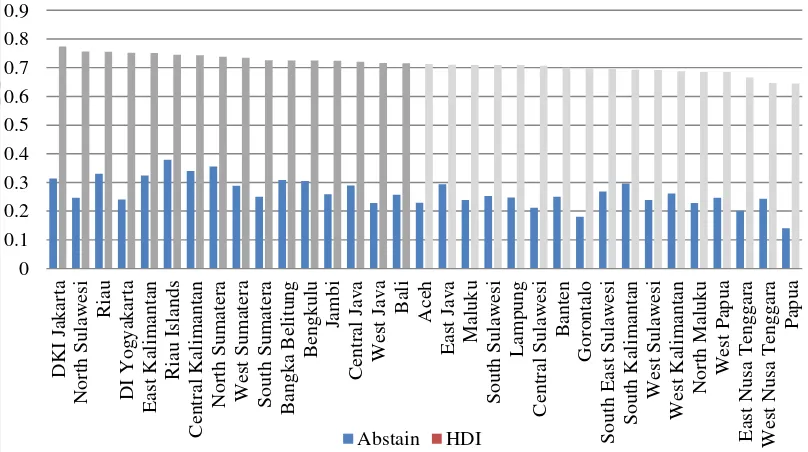
6. Conectivity histogram of k-nearest neighbor (k=5) 14 7. Conectivity histogram of threshold distance 14 8. Distribution of voter abstention and percentage of poor people 17 9. Distribution of voter abstention and monthly average of wage/salary/
income of employee 18
10. Distribution of voter abstention and human development index 19
LIST OF APPENDIX
1. Syntax of R 22
2. Plot of normality, homoscedasticity and independent error of OLS
residual 23
3. Value of local moran index 24
4. k-nearest neighbor matrix with k = 5 25
5. Threshold distance matrix 26
6. Plot of normality, homoscedasticity and independent error of SEM
residual 27
7. Map of local moran index 28
INTRODUCTION
Background
General election is part of democracy that has been improving and developing in Indonesia. Since 1955, Indonesia has implemented ten general elections for legislative and presidential election. Presidential technical election that is previously choosen by People's Consultative Assembly of the Republic of Indonesia (MPR) has been replaced and agreed as a direct election by all of Indonesian peoples. This new rule election has been implemented for a twice, i.e. in 2004 and 2009.
The policy to change the authority of vote from MPR to peoples has raised some problems. One of the problem is voter abstention, which has been actually happening since the first legislative election in 1955. The result of the last two elections shows that number of voter abstention is very high. In the first term of 2004 presidential election, 21.77% of official voters were abstain. In the second term, it increased to 23.37%. Five years later, it was still in a high level, which increased to 27.19%. This condition will be feared to be increased for the next election.
According to Arianto (2010), abstention is a behavior that refuse to give a vote as a participation in election based on some factors and reasons. In the survey of social and political science from Eriyanto (2007), there are three reasons why peoples become abstain in election, i.e. administrative reason, individual or technical reason, and political reason. Political reason became the lowest choice than other reasons based on that survey. Moreover, three categories of voter abstention are identified by DeSipio et.al. (2006). The first is Registered Not Voted, that is citizens who have a vote and actually registered but they do not use their vote. Second is Citizen Not Registered, that is citizens who have a vote but does not registered so that they unable to get a vote. The last is Non Citizen, that is peoples who do not have a vote because they are not citizen on the region which hold an election. This research use those first two categories of abstention produced by provinces in Indonesia to explore some clusters formed by neighboring provinces that is indicated spatial effect. Thus, this research desire to observe the pattern of voter abstention in Indonesia.
A research about voter abstention had been done by Nyarwi (2009) using a correlation. The result explained that voter abstention was influenced by several factors using some approaches, that were model approach of sociology, psychology and rational choice. Mujani (2007) did a survey and research about voter abstention behavior which almost produce a similar influenced categories that was compared with Nyarwi (2009). In an aspect of sociology, factor of income, occupation, education, urbanism, age, religion, and gender have a significant correlation to voter abstention behavior. In an aspect of psychology, significant correlation coming from factor of political information and partisanship. The previous research about voting behavior are regardless to consider spatial effect between neighboring province. According to Anselin
(1988) in W Tobler’s First Law about Geography, observation in one region is
but something close has more effect than one far. Determination hotspot provinces and factors that affect significantly to voter abstention is important to be evaluated for next election. Thus, this research aims to identify factors that affect significantly to voter abstention behavior in Indonesia with enhancing factor of spatial in order to be useful for related stakeholders for improving the better general election in Indonesia.
Objectives
1. Identify spatial pattern of 33 provinces that produce voter abstention number in the 2009 presidential elections.
2. Identify characteristics of province in order to know factors that boost the abstention in the 2009 presidential elections.
METHODOLOGY
Data Sources
The data used are secondary data from General Election Commision of Indonesia (KPU) for an official result of 2009 presidential election and Central Bureau Statistics of Indonesia (BPS) for characteristics of provinces.
Table 1 Independent and explanatory variables
Data Source
Percentage of voter abstention of 2009 presidential general election (Y) KPU
Percentage of poor people (X1) BPS
Monthly average of wage/salary/income of employee (X2) BPS
Open unemployement rate (X3) BPS
Mean years of schooling population 15 years of age and over (X4) BPS
Human development index (X5) BPS
School enrollment ratio 16-18 years of age (X6) BPS
Percentage of “A” number of accredited school (X7) BPS
Life expectancy at birth (X8) BPS
There are several researches concerned about voting or non voting (abstain) behavior considering factor of socio-economic status. According to American Psychological Associaton (APA), socio-economic status is a conceptualization of social standing or class of individual or group measured as a combination of income, education, and occupation. Sigelman et.al (1985), Nevitte et.al (2000), Mujani (2007), Brown (2009), and Nyarwi (2009) include factor of socio-economic status as explanatory variables to the research about non voting behavior by voter abstention. Most of those variables are focused to income and education.
Including factor of spatial to related research is considered important. Thus, this research uses variable of income and education that are then represented by percentage of poor people (X1), monthly average of wage/salary/income of employee (X2), mean years of schooling population 15 years of age and over (X4), school enrollment ratio 16-18 years of age (X6), and percentage of “A” number of accredited school (X7). Regarding income, variable of X1 and X2 can be specialized to describe the financial condition of citizen, even though they are not highly correlated each other. In connection with education, choosing variable of X4 and X6 emphasize to a level of education of offical voters. X4 records mean years of schooling for all of peoples who have riched 15 years of age and over then covers the minimun age of official voters that is 17 years old, while X6 informs about school enrollment 16-18 years of age which describe normally to senior high school student. It is taken into account to analyse the group of beginner voters with less political awareness. Then, X7 gives information that describe level of quality of school implemented by accreditation to enhance quality of education. Variable of open unemployement rate (X3) is considered to be included because it is part of socio-economic status related to factor of occupation of citizen in every province.
Other explanatory variables added to this research are Human Development Index (HDI) (X5) and life expactancy at birth (X8). Some previous researches about voting behavior from myriad kind of countries gave typical characteristics. High social-economic status usually dicreases voter abstention in developed countries, while it gives constrastingly with developing or poor countries. This condition is triggered to include HDI as a indicator of development of every country as an added variables to this research. Life expactancy at birth (X8)
related to people’s health and prosperity. Healthy people will easily to go to
voting stand to give their vote and it is expected to suppress number of voter abstention.
The algorithm of methodology can be seen in Appendix 1. Softwares applied for this research are R 3.0.3 and GeoDa.
Methods
Spatial Regression Model
Spatial regression is one of analysis of statistics that evaluates the relationship between variable and other variables by considering spatial effect. General model of spatial regression is: effects and a spatial autocorrelation, is a spatial error model coefficient and is an error autocorrelation vector (Anselin 1988).
In the general model of spatial regression, if ≠ 0 and = 0 then the model is called Spatial Autoregressive Model (SAR). This model is a linier regression with the response variable having spatial autocorrelation. General model of SAR is:
, (2) model is a linier regression with the error variable having spatial autocorrelation. General model of SEM is : needs a numerical iteration (Anselin 1988, referred from Arisanti 2011).
Methodologies of this research are summarized as follows: 1. Exploring the data using descriptive statistics.
2. Predicting and testing parameters that are significant to voter abstention using multiple linier regression analysis.
3. Defining spatial weight matrix.
Spatial regression analysis needs spatial weight matrix to construct the model. It is generated to visualize the proximity between location. Initially, the matrix is filled by that is only value of 1 if the i location is adjacent with j location and the other is filled by 0. There are several approaches constructing the matrix, one of them is k-Nearest Neighbor (k-NN) which is used in this research. The steps of defining spatial weight matrix as follows:
a. Determining the centroid of each province. This research uses centroid of the capital city of each province.
b. Calculating the distance between centroid using euclidean distance . To get the distance of province located on coordinate and claimed as adjacent unit. Data of PD is obtained from (BPS 2010) and categorized into four classes which are not dense (less than 50 people per km2), less dense (51-250 people per km2), dense enough (251-400 people per km2) and very dense (greater than 400 people per km2). The categorization follows the Government Regulation in Lieu of Law number 56 of 1960.
4. Testing spatial autocorrelation for voter abstention data using Global Moran Index.
The hypothesis of Global Moran Index (Moran’s I) is : H0 : I = 0 (there is no spatial autocorrelation)
H1 : I > 0 (there is positive spatial autocorrelation) I < 0 (there is negative spatial autocorrelation)
The equation of Moran’s I is : deviation from Moran Index and is number of area (Ward & Gleditsch 2007).
5. Testing spatial autocorrelation for voter abstention data using Local Moran Index.
Local Moran is defined as :
̅
∑ ̅ ∑ ( ̅) (15)
(16)
where is value of observation in location i, is value of observation in location j, ̅ is the mean from attributes of observation, and is value of spatial weighted matrix for region i and j, is a function from , is value of observation in province i, and is other value of observation in province j in area or cluster i (Anselin 1995).
(Anselin 1999). Statistics of follows chi-square distribution
7. Predicting and testing parameters that are significant to voter abstention using spatial regression analysis.
a. Determining spatial kind of model according to Lagrange Multiplier in step 6.
b. If ≠ 0 and = 0 then the model is called Spatial Autoregressive Model (SAR).
c. If = 0 and ≠ 0 then the model is called Spatial Error Model (SEM). d. Checking and testing for the assumption of spatial regression model. 8. Comparing the goodness of fit of spatial regression model based on value
of AIC and Log Likelihood. The lower AIC value is, the better model is likely to choose. The equation to calculate AIC is:
(21)
where is log likelihood and number of parameters. Ward & Gleditsch (2007) identified log likelihood for classical regression, spatial autoregressive model, and spatial error model. Log likelihood for classical regression (17), SAR (18), and SEM (19) are:
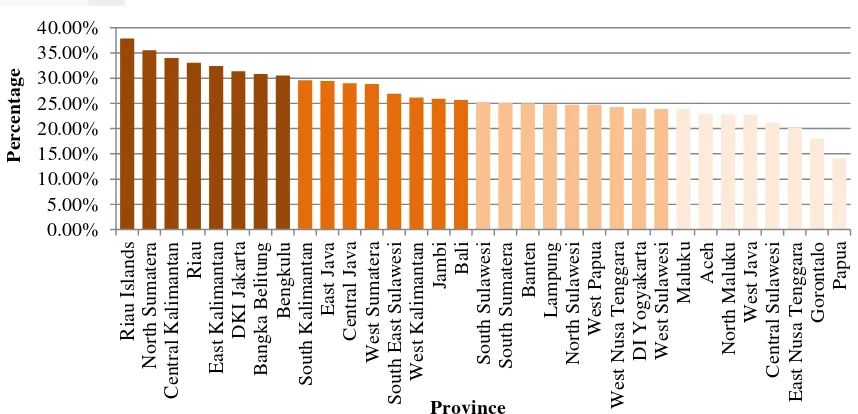
0.00% voter list of 2009 presidential election is 175.263.774 peoples. About 27.19% or 47.648.099of them did not give a vote. This percentage is obtained by comparing number of voter abstention and final voter list in each provinces. The distribution of voter abstention number of each provinces is shown on Figure 1. Riau Islands
is recorded as the highest province’s number of voter abstention with 37.91% and
followed by North Sumatera with 35.57%. Nevertheless, it is different with the provinces located in the East part of Indonesia. Papua and Gorontalo come up to the lowest number with 14.05% and 18.03%. Based on Table 2, mean and median of voter abstention are 26.52% and 25.31%. A quite similar mean and median indicates that data is normally distributed. This condition is supported by Normality Plot in Appendix 2 where voter abstention is normally distributed.
In Figure 2, the map shows geographically the distribution of voter abstention for all of provinces. There are some typical patterns created by
Figure 2 Quantile map of voter abstention
Table 2 Descriptive statistic of voter abstention Statistic Voter Abstention
Mean 26.52%
Median 25.31%
Maximum 37.91%
Minimum 14.05%
Std. Error 0.90%
Std. Deviation 5.00%
neighboring provinces. For example, the darkest orange huge cluster formed consisted of North Sumatera, Riau, Riau Islands, and Bangka-Belitung in Sumatera and Central and East Kalimantan in Kalimantan Island that have similar high number of abstention with range from 30.5% until 37.91%. Other cluster formed are West Sumatera and Jambi in Sumatera and Central and East Java in Java Island for brighter orange with range of 25.69% until 29.63%. The second brighter orange consisted of South Sumatera, Lampung, and Banten with 23.92% until 25.31% of range. For the brightest orange - range between 14.05% until 23.91% - are dominated by provinces in East part of Indonesia, that are Gorontalo, Central Sulawesi, Maluku, North Maluku, East Nusa Tenggara, and Papua. This pattern could be indicated that there is factor of spatial correlation for voter abstention in neighboring provinces.
The indication of spatial correlation for neighboring provinces does not focused in each islands. It is also considered to analyse the correlation between province in other islands. As the reason of national scope observation for an Archipelagic Indonesia, this research uses distance approach to accomodate a thorough spatial correlation. k-Nearest Neighbors is part of distance approach used in this research to construct spatial weight matrix.
Multiple Linier Regression
Generating multiple linier regression model is aimed as a beginning step of spatial regression to compare each result then choose the best model for the
data. This modeling produce some significant explanatory variables for α = 10 %,
that are percentage of poor people (X1), human development index (X5), and life expectancy at birth (X8). The R-squared of the model is 63.8% which means that model resulted by multiple linier regression can tell the variance of data for about 63.8%, while 36.2% is explained by other explanatory variables outside the model. Testing is also performed the following assumption:
1. Normality
Normality test is performed by Kolmogorov-Smirnov test with it’s value of 0.120 and p-value greater than 0.1 which means that normality assumption for Ordinary Least Square (OLS) residual is completed (see Appendix 2.I)
2. Homoscedasticity
Breusch-Pagan Test is used for checking this assumption. BP-value resulted from the data is 5.526 and p-value is 0.700. Based on it, p-value of BP test is greater than 0.1 which means that this assumption is also completed (see Appendix 2.II)
3. Independent error
The assumption of independent error can be analysed by considering the graph on Appendix 2. The graph shows that there are not certain patterns formed. Therefore, this assumption is not violated (see Appendix 2.III) 4. Multicolinierity
According to Table 3, there are not VIF value which are greater than 10. It is indicated that there is no multicolinierity among explanatory variables.
and other value of attribute in other locations (Fotheringham & Rogerson 1993). According to Figure 2, provinces which have such similar number of voter abstention that they tend to construct some clusters. These clusters distinguised by color sign that there is a positive spatial autocorrelation. It means that there is a similiar value owned by neighboring locations (Silk 1979).
In 1995, Anselin introduce a thorough technique for spatial association that is Local Indicator of Spatial Association (LISA). It is a tool of data exploration area that can detect hotspot and coldspot in spatial analysis and find a local pattern
of spatial autocorrelation (Local Moran Index) with testing each area and it’s
influence to the global aspects (Global Moran Index).
Global and Local Moran Index
Moran Index is divided into global and local correlation. Global Moran
Index or Statistics Moran’s I is a measurement of correlation between observation
in one location and other locations which is contiguous each other (Anselin 1995).
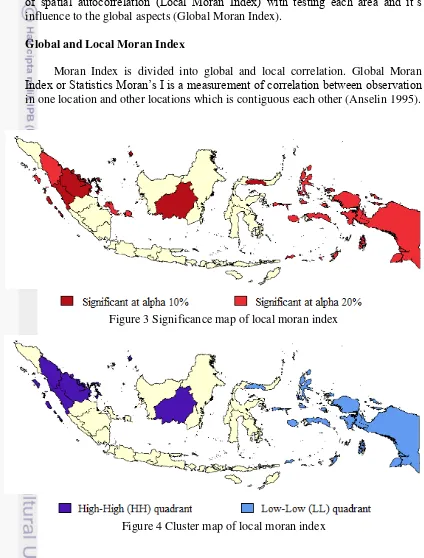
Figure 3 Significance map of local moran index
Figure 4 Cluster map of local moran index
Number of voter abstention in Indonesia affected by neighboring provinces can be
detected by measuring Global Moran’s I. The result of Global Moran’s I for voter
abstention is 0.244 with p-value 0.016 (significant at α = 10 %). This result means that there is a positive correlation so that neighboring provinces establish some clusters which have similar characteristics inside of each cluster. This condition is supported by previous explanation about spatial autocorrelation.
Global Moran’s I explained that there is positive spatial correlation for case of voter abstention in Indonesia, but it did not tell what province affected significantly to spatial clustering arround its observations. Anselin (1995)
explained about Local Moran’s I that the indication level of significant spatial clustering of similar values arround observation could be given by LISA for each observation. According to probability value in each province using Local Moran’s I in Appendix 3, there are five significant provinces for α = 10 %, that are Riau, Riau Islands, West Sumatera, Gorontalo, and Central Kalimantan and also six for
α = 20 % that are North Sumatera, Bangka Belitung, Maluku, North Maluku,
Papua, and West Papua. In Figure 3, these 10% of alpha significant provinces are shown with darker red and brighter red for 20% of alpha. Thus, according to equation 16, this result of significant province means that there is a correlation between the value observed in the neighborhood of one province in the area of another significant province.
Figure 5 Moran Scatter Plot
high number of voter abstention are identified to HH provinces. The low number
of abstention’s provinces that are Gorontalo, Maluku, North Maluku and Papua
step into LL province. According to Cluster Map in Figure 4, the darker blue signs to HH provinces and brighter blue for LL provinces. Other kinds of quadrants are High-Low (HL) and Low-High (LH) located in the lower right and upper left indicate high values surrounded by low neighboring values (HL) and low values surrounded by high values (LH). These two quadrants in this research do not filled by any significant provinces.
These results above show typically that province which has cluster or neighboring similar value of voter abstention tends to be affected significantly to its neighbors. Beside that, the significant provinces which are then plotted to
quandrants have a positive association where high number of voter abstention’s
provinces are identifed to spatial clustering of similar high value (HH) and common spatial weight such as contiguity approach does not appropriate for this research because of geographical condition of the observation. There are seven observations which can be called province and island at once, i.e. Riau Islands, Bangka Belitung, Bali, West and East Nusa Tenggara, Maluku, and North Maluku. It is problem to construct the matrix by using contiguity because it will result spatial weight matrix of certain singularities (rows and columns composed entirely of zeros). Direct contiguity can be too restrictive as islands typically have some contact with non-contiguous units. Another approach is using k-NN for social science cases as an alternative way to construct spatial weight matrix (Ward & Gleditsch 2007).
The result of k-NN using diverse number of k produces the best matrix evaluated by value of AIC and log likelihood (see Table 4). Based on p-value of Lagrange Multiplier (LM), there are not significant spatial dependences by SAR, while SEM gives all of significant spatial dependence, except k=3. According to that significance of SEM, k-NN with k=5 obtains the lowest AIC value with 122.60 that is lower than AIC of OLS from Multiple Linier Regression with -118.14. It also has the biggest log likelihood value with 72.29 which is higher than OLS with 69.07. The modification of k for this case gives different result. For lower k (k<5), it tends to make some no neighbor provinces so that excluding province supposed to be included will be happened. While, for bigger k (k>5), there are unnecessary provinces included to the matrix.
0
order to ensure that each province has at least one neighbor. The result of weight matrix related to k-NN and TD are given in Appendix 4 and 5. TD matrix produce more neighboring provinces than k-NN. It is because high default threshold used can include unappropriate provinces to the matrix, although each province has at least one neighbor. For example, Lampung has 12 neighbors according to TD, where D.I. Yogyakarta as one of it’s neighbor. Figure 7 shows that TD gives 25 province which have neighbor greater than 5. Contrastingly, too small d could be produce an islands so it will create some no neighbor provinces. k-NN gives more stable result of neighboring province than TD if it is compared with real condition. According to Table 4, it is strenghthen the previous explanation that kNN is better than TD. AIC value of kkNN with 122.60 is smaller than TD with -120.56, while loglikelihood value of k-NN with 72.29 is greater than TD with 71.28. As those consideration, k-NN spatial weight matrix is used in this research for further analysis.
Figure 6 Conectivity Histogram of Figure 7 Conectivity Histogram of k-NN (k=5) Threshold Distance
Table 4 Result of diverse approaches of weight matrix
Spatial Effect Test
Spatial effect test is divided into two effects, there are spatial dependence effect and spatial heterogeneity effect. Test of spatial dependence effect using Lagrange Multiplier Test and using Breush-Pagan Test for spatial heterogeneity effect.
The result of multiple linier regression explained that all of the assumptions are completed, but exploring data from map indicates that there is spatial correlation beetwen observations. Therefore, it seems necessary to check spatial dependence by Lagrange Multiplier. According to Table 4, p-value of SEM is 0.035 that is significant at α = 10 % with LM value about 3.440. It is indicates that there is spatial dependence of error for case of voter abstention in Indonesia so that Spatial Error Model (SEM) is the suitable spatial model to consider spatial effect which is not determined in Multiple Linier Regression.
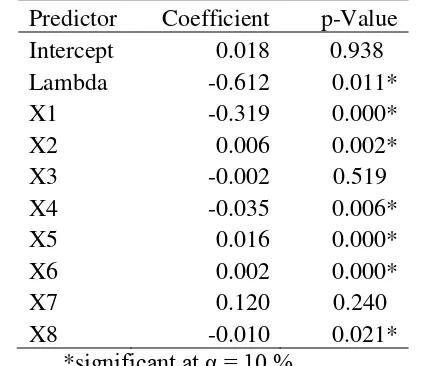
According to Table 6, there are six significant explanatory variables, that are percentage of poor people (X1), monthly average of wage/salary/income of employee (X2), mean years of schooling population 15 years of age and over (X4), human development index (X5), school enrollment ratio 16-18 years of age (X6), and life expectancy at birth (X8). SEM gave more significant explanatory variables than Multiple Linier Regression. Five significant variables on full model still on the track, it was then added by three more significant variables in SEM model. Beside that, SEM also obtain Lambda (λ) that is significant with p-value = 0.000 and coefficient of 0.612. It means that province which is surrounded by n-province(s) so that the effect from each surrounding province is about 0.612 multipled by mean of residual. This model has a better AIC value than full model. AIC value of SEM is -122.6 lower than full model with -118.14. All of the assumption of SEM are completed based on Appendix 6.
The significant explanatory variables divided into two parts, i.e positive and negative significances. There are three positive and three negative significant variables. Coefficient of X1 is -0.319, it means, every 1% increase of poor
people’s percentage, it will reduce percentage of mean of voter abstention for about 0.319 in each province. X2 with coefficient of 0.006 means, every Rp 1 increase of monthly average of employee’s wage/salary/income, it will increase percentage of mean of voter abstention for about 0.006 in each province. Coefficient of X4 is 0.035, means that mean of voter abstention’s percentage will be reduced 0.035 if there is 1 point increment of mean years of schooling population 15 years of age and over. X5 with coefficient of 0.016 means, every 1 point increase of human development index, it will increase percentage of mean of voter abstention for about 0.016. School enrollment ratio (X6) has 0.002 of coefficient which means, if there is 1 point increase of it, for about 0.002 as an enhancement of mean of voter abstention’s percentage in each province. Coefficient of X8 is 0.010, it means, every 1 point increase of life expectancy at birth, it will enhance 0.010 of mean of percentage of voter abstention. Each variable considers the assumption that the change of one variable will be builed if other variables are constant.
Constructing an interpretation of case study of social sciences is more likely complex than other case. In Brown (2009), some studies in social science
show that considering people’s socioeconomic status, a measurement which factor in person’s education, occupation, and income, will directly affect their behavior,
including person’s voting behavior. Significant variables in this research related to
education are mean years of schooling population 15 years of age and over (X4) and school enrollment ratio 16-18 years of age (X6). X4 is affected negatively to voter abstention, while X6 is positive. This distinction of sign’s siginifances of education status should have taken into account. According to Sigelman et.al (1985) about considering level of education to voting behavior, the more years of formal education one has, the greater the probability that one will vote. It is correspond to the result with including spatial factor that mean years of schooling population 15 years of age and over is negatively significant to voter abstention.
0
In contrast, the school enrollment ratio 16-18 years of age variable is different to others. Regardless spatial factor, Mujani (2007) implied that voting behavior in
Indonesia is not contrary with voter abstention. The higher person’s education
level is, the more they less likely to vote. People who is being aphatetic and sceptic toward politics comes from higher educational groups. Indeed, this pattern is different from U.S presidential election. Logically, education is a powerful gun for every problem. School enrollment ratio 16-18 years of age can be equated as senior high school level that they are as an beginner voter with less of political awareness. Print et.al (2009) emphasizing to strengthen a civic education for youth political participators. The principle objective of civic education is to teach civic literacy, which can be a knowledge for understanding of the basic principles of government and enhancing skills to face democracies.
Beside education, economic status is also being noted. Variables related are percentage of poor people (X1) and monthly average of wage/salary/income of employee (X2). Both of them have different sign of significance to voter abstention. While X1 is negative, X2 is positive. The SEM result show that, poor people is more likely to vote than the rich. This result is correspond with Figure 1 and 2 on data exploration. Provinces which have low number of voter abstention are most located in East part of Indoensia, such as Papua, Gorontalo and Maluku. Data of percentage of poor peoples used in this research then tabulated with voter abstention and the result is that most of provinces which have high number of percentage of poor people are having low abstain (see Figure 8). Mujani (2007) again implied that election in Indonesia is like a party for poor people. Characteristics of country may indicate the result. In some other countries, Sigelman et.al (1985) explained about economic status that poor people is being less likely to vote. However, Gupta (2004) implied in the research of election in India which has the same characteristics of developing country as Indonesia that the poor are more likely to vote than the rich. In one side, it is a good condition when people give a vote on election, but in other side it is susceptible to election violation such as money politics and voter suppression.
0
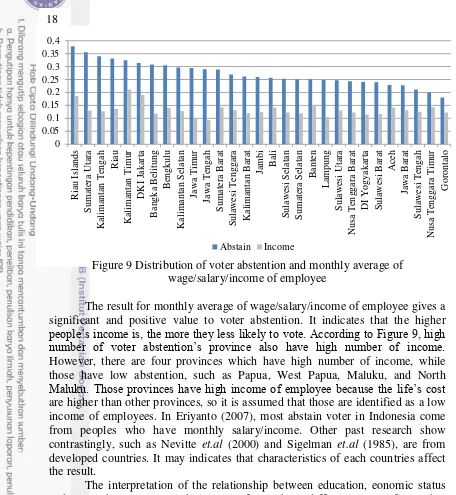
Figure 9 Distribution of voter abstention and monthly average of wage/salary/income of employee
The result for monthly average of wage/salary/income of employee gives a significant and positive value to voter abstention. It indicates that the higher
people’s income is, the more they less likely to vote. According to Figure 9, high number of voter abstention’s province also have high number of income.
However, there are four provinces which have high number of income, while those have low abstention, such as Papua, West Papua, Maluku, and North
Maluku. Those provinces have high income of employee because the life’s cost
are higher than other provinces, so it is assumed that those are identified as a low income of employees. In Eriyanto (2007), most abstain voter in Indonesia come from peoples who have monthly salary/income. Other past research show contrastingly, such as Nevitte et.al (2000) and Sigelman et.al (1985), are from developed countries. It may indicates that characteristics of each countries affect the result.
The interpretation of the relationship between education, eonomic status and voter abstention, regarding spatial factor, have different pattern from other country explained by other related research. Human Development Index (HDI) which have utility to represents country identified as poor, developing, or developed one, then can be observed. HDI (X5) gives positive and significant with voter abstention. Gupta (2004) again gives an example of the research about voting behavior in India which have similar characteristics of the result to
0
Figure 10 Distribution of voter abstention and Human Development Index
Then, life expectancy at birth (X8) has negative association with voter
abstention. This kind of variable related to people’s health and prosperity will
reduce voter abstention if it is increased because healthy people will easily to go to voting stand to give their vote.
CONCLUSION AND RECOMMENDATION
Conclusion
There is positive spatial autocorrelation for voter abstention data, which means that there are similiar values owned by neighboring provinces in Indonesia. Provinces that are signifficant to spatial autocorrelation are Riau, Riau Islands, West Sumatera, Central Kalimantan, and Gorontalo. According to significant provinces, there are not province that identified as hotspot or coldspot observation.
Determining factors that are significantly affected to voter abstention using Spatial Error Model (SEM) is better than Spatial Autoregressive Model (SAR) and Multiple Linier Regresion. There are six significant explanatory variables, that are percentage of poor people (X1), monthly average of wage/salary/income of employee (X2), mean years of schooling population 15 years of age and over (X4), human development index (X5), school enrollment ratio 16-18 years of age (X6), and life expectancy at birth (X8).
Recommendation
Mahalanobis Distance for case of social science could be used as a comparation between Euclidean for calculating centroid distance in designing spatial weight matrix.
REFERENCES
Anselin, L., 1988. Spatial Econometrics: Methods and Models. Dordrecht (NLD): Academic Publisher.
Anselin, L., 1995. Local Indicators of Spatial Association. Research Paper 9331 Regional Research. Virginia (US) : Institute West Virginia.
Anselin, L., 1999. Spatial Econometrics. Dallas (US): Bruton Center.
Arbia, G., 2006. Spatial Econometrics: Statistical Foundation and Application to Regional Convergence. Berlin: Springer-Verlag.
Arianto, B., 2010. Analisis Penyebab Masyarakat Tidak Memilih dalam Pemilu. Tanjungpinang (ID): Fakultas ISPOL, Universitas Maritim Raja Ali-Haji. 1(1).
Arisanti, R., 2011. Performance Spatial Regression Models for Detecting Factors of Poverty in East Java Province [Thesis]. Bogor: Faculty of Mathematics and Natural Statistics, Bogor Agricultural University.
[BPS] Badan Pusat Statistik, 2010. Trends of The Selected Socio-Economic Indicators of Indonesia. Jakarta: Badan Pusat Statistik.
Brown, C.R., 2009. Issue Brief: Voting Behavior based On Socioeconomic Status.
Chatterjee, S., Hadi, A.S., 2006. Regression Analysis by Example. New Jersey (US) : John Wiley & Sons, Inc.
DeSipio, L., Masuoka, N., Stout, C., 2006. The Changing Non-Voter: What Differentiates Non-Voters and Voters in Asia, American and Latino Communities?. CSD Working Paper. California (US): University of California.
Eriyanto, 2007. Golput dalam Pilkada. Kajian Bulanan Lingkaran Survei Indonesia. [Internet]. [Edisi 05 September 2007]. Jakarta (ID).
Fotherningham, A.S., Rogerson, P.A., 1993. GIS and Spatial Analytical Problems. New York (US): University of Buffalo.
Getis, A., Aldstadt J. 2003. Constructing the Spatial Weight Matrix Using a Local Statistics. Journal of Geographical Analysis, Vol. 36, No. 2. Ohio (US): The Ohio State University.
Gupta, D., 2004. Analysis of Election in India. Sydney (AUS).
[KPU] Komisi Pemilihan Umum, 2009. Sertifikat Rekapitulasi Perhitungan Suara Pemilu Presiden dan Wakil Presiden Tingkat Nasional. Jakarta: Komisi Pemilihan Umum.
Mujani, S., 2007. Voting Behavior Kasus Indonesia. Bahan Kuliah Program Pasca Sarjana Master Manajemen Komunikasi. Jakarta (ID): FISIP, Universitas Indonesia.
presentation at the XVIIIth World Congress of the International Political Science Association. Quebec.
Nyarwi, A., 2009. Golput Pasca Orde Baru : Merekonstruksi Ulang Dua Perspektif. Jurnal Ilmu Sosial dan Ilmu Politik. 12(2): 257-390.
Print, M., Milner, H., (2009). Civic Education and Youth Political Participation. Rotterdam (NLD): Sense Publishers.
Sigelman, L., Roeder, P., Jewell, M., Baer, M., (1985). Voting and Nonvoting: A Multi-Election Perspective. American Journal of Political Science, Vol. 29, No. 4. (Nov., 1985), pp. 749-765.
Silk, J., 1979. Statistical Concept in Geography. London (UK) : George Allen & Unwin.
Ward, M., Gleditsch, K., 2007. An Introduction to Spatial Regression Models in the Social Sciences.
Appendix 1 Syntax of R
##Running Spatial Effect Test – Lagrange Multiplier (LM)
Appendix 2 Plot of normality (I), homoscedasticity (II) and independent (III) error of OLS residual
(I)
(II)
(III)
Appendix 6 Plot of normality (I), homoscedasticity (II) and independent (III) error of SEM residual
(I)
(II)
(III)
Appendix 7 Map of local moran index
BIOGRAPHY
The author was born in Bogor, August 30th 1992 as the son of (alm) Sunarso and Rina Utami. He is the second son of two children. The author graduated from SDN Semplak II Bogor in 2004 and SMPN 4 Bogor in 2007. By the year 2010, he graduated from SMAN 5 Bogor and at the same year, he enrolled in Bogor Agricultural University through USMI as a student of Department of Statistics, Faculty of Mathematics and Natural Sciences.
During his study, he was active in organization and commitee activities. He was a staff of database center and department of science at student association of Gamma Sigma Beta Department of Statistics from 2011 until 2013. He was also mandated as project officer of The 8th Statistika Ria 2012 (National Scope) and head division of sponsorship and public relation of Komstat Junior Pesta Sains FMIPA 2013 (National Scope). From June 1st until August 31st, he had fulfilled his intership in Lingkaran Survei Indonesia (LSI), Jakarta on Research Division.