www.elsevier.com / locate / econbase
Export price responses to exogenous exchange rate movements
*
Malin Adolfson
Stockholm School of Economics, Department of Economics, Box 6501, S-113 83 Stockholm, Sweden Received 25 February 2000; accepted 20 September 2000
Abstract
The export price responses to three different exogenous exchange rate movements are investigated, using data on Swedish exports of automobiles and kraft paper to three destination countries. A price determining error correction model indicates results consistent with price discrimination. 2001 Elsevier Science B.V. All rights reserved.
Keywords: Exchange rates; Export prices; Market shares; Pass-through; Pricing to market
JEL classification: E30; F41
1. Introduction
An extensive empirical literature on the relationship between exchange rates and price adjustments has been built up since the large fluctuations of the U.S. dollar in the mid-1980s (for surveys see Menon, 1995; Goldberg and Knetter, 1997). If exporters have some market power and markets are segmented, an exchange rate change may induce price discrimination across destination markets (pricing to market according to Krugman, 1987) such that exporters set different prices, in the exporters’ currency, in different destinations. This implies that the exchange rate pass-through, i.e. the response of the import price to an exchange rate change, is incomplete (local currency price stabilization). The exporters consider the conditions on the different markets when setting their prices and a destination specific markup adjustment thus absorbs part of the exchange rate change so that there are deviations from the law of one price. Consequently, price discrimination gives rise to different sizes of the exchange rate pass-through across the destinations.
Most empirical studies of the producer’s price determination are done within a single equation framework, possibly on error correction form (see e.g. Gagnon and Knetter, 1995; Feenstra et al.,
*Tel.:146-8-736-96-47; fax: 146-8-31-32-07.
E-mail address: [email protected] (M. Adolfson).
1996). This implies that the pass-through coefficient will estimate the partial effect exchange rate fluctuations have on the price setting relation. However, exchange rate changes are not necessarily exogenous to the price determination, if for example aggregate data are used. By analyzing price data for individual firms or industries and exchange rate movements that can be treated as exogenous, such as a devaluation, the simultaneity between prices and exchange rates will be eliminated which enables one to estimate the pass-through coefficient more accurately.
In this paper the empirical analysis is done in a multivariate setting. This allows for several long run (cointegrating) relations between the variables determining export prices, market shares and exchange rates. This also makes it possible to explicitly treat problems of identifying the price setting relation. However, when leaving the partial-equilibrium, single equation framework the question arises of how to measure exchange rate pass-through. One is forced to make a distinction between partial and total pass-through coefficients. The partial pass-through measures the effect an exchange rate change has on the price setting relation, excluding the effects going through other variables and other equilibrium relations. The total pass-through, in contrast, measures the entire effect on the export price an exchange rate change causes, working through every interaction of prices, quantities and exchange rates. Here, the total pass-through to prices of Swedish exports of automobiles and kraft paper from three different and exogenous exchange rate movements is estimated. The study focuses on the devaluations of the Swedish krona in 1981 and 1982, and the shift from a fixed to a floating exchange rate regime in 1992. For comparison, the partial elasticities of the export prices with respect to the exchange rate are also reported.
2. The model
The model used here follows along the lines suggested by Gagnon and Knetter (1995), Kasa
1
(1992), Feenstra et al. (1996), and Feenstra and Kendall (1997). Assuming adjustment costs on the supply side implies that the price determination in an imperfectly competitive setting (with differentiated products and segmented markets such that the exporter can price discriminate) can be modelled in an error correction framework. The price change then depends on prior deviations from the long run cointegrating relations, as well as prior changes in the explanatory variables and the export price itself. This also seems like a suitable specification of the econometric model given the commonly accepted non-stationarity of nominal variables such as price levels and exchange rates.
The interactions between the export price, export volume and the exchange rate are analyzed using Johansen’s (1988) maximum likelihood procedure, which consists in estimating a vector auto-regressive (VAR) model. The model (presented in its empirical form) has the following form:
k21
zt21
Dzt5
O
GjDzt2j1a bs 9 b6dS D
t 1m1FDt1´t t51, . . . , T (1)j51
sub
where z is a five-dimensional column vector, z5( p, ppi, sh, e, p )9. p is the export price denoted in the exporter’s currency, ppi is a disaggregated producer price index in the exporter’s country used as a proxy for the marginal cost, sh is the market share defined as the Swedish export volume of a certain
1
good divided by the total volume of imports of that good to one destination market, e is the exchange sub
rate (exporter’s currency per unit of importer’s currency) and p is the price of competing products, defined as other imports of the good, denoted in the buyer’s currency (all variables are logarithmic values). m is a vector of constants, D is a vector of deterministic variables (three centered seasonal dummies, three intervention dummies and three dummies for excluding apparent outliers) and ´t is a vector of IID disturbance terms. The intervention dummies consist of the large devaluations of the Swedish krona in September 1981 and October 1982 and the shift to a floating exchange rate in November 1992: a (532) matrix of adjustment coefficients toward the long run equilibrium, b9 is a (235) matrix of
3
the cointegration vectors and t is a linear trend capturing composition effects in unit values and
4
productivity growth.
5
A total short-run pass-through in the error correction model (Eq. (1)), due to a pure exogenous shock to the system (i.e. a change in the dummy variables representing the devaluations in 1981 (D )1,t and 1982 (D ) respectively), is calculated by comparing the pricing equation’s response with the2,t
6
response in the exchange rate equation. In addition, the total pass-through is determined for the depreciation in 1992 (which is identified by a change in DD ), following the shift from a fixed to a3,t
floating currency regime. However, this dummy variable (D ) represents the regime shift and not the3,t explicit exchange rate shock per se, so the resulting pass-through might capture the effects of a combination of the depreciation and the switch to a floating currency.
The total exchange rate pass-through estimate includes all the consequences an exogenous exchange rate change causes to the export price, i.e. the effect working through the entire short-run dynamics (all partial coefficients in G) as well as the effect working through both cointegration vectors. To see this explicitly, formulate the system in the following way:
e
Since the exchange rate series consist of quarterly averages of the spot rates, the timing (within a quarter) of a fluctuation matters for what quarter a change primarily is reflected in. The devaluation in September 1981 appears, in the data, mainly in the last quarter of 1981.
3
The cointegration rank is set to two for all markets, in accordance with the regular (trace) likelihood ratio test. The subsequent analysis is carried out with unrestricted cointegration vectors.
4
The number of lags, k, are two for all destination markets except for the export of automobiles to Germany (three lags). Standard mis-specification tests have been used to determine lag length.
5
The partial short-run pass-through is found in the dynamics of the pricing equation (Gj,14) in the error correction model (see Eq. (1)).
6
Hence, the B-matrix will capture the complete effect on all variables and both the channels the exchange rate change is working through (i.e. the short-run run dynamics and both cointegration vectors). The resulting response in vector y due to a shift in the dummy variable in period t is thus;t
s 7
(response ( yt1s))5Bu1. Since Dzt5Gy where Gt 5[I 05 532], the response in the levels of the
s j
z-variables is (in period t1s following a depreciation in period t); (response (zt1s))5oj50GBu1. The total pass-through to the export price in period t1s of an exchange rate change in period t could
thus be calculated as; (response ( pt1s)) /(response (e )).t
3. Empirical results
The model is estimated using quarterly data for exports of automobiles and kraft paper from Sweden to Germany and the United Kingdom for the period 1980:1–1994:4, and to France for
8
1984:1–1994:4.
9
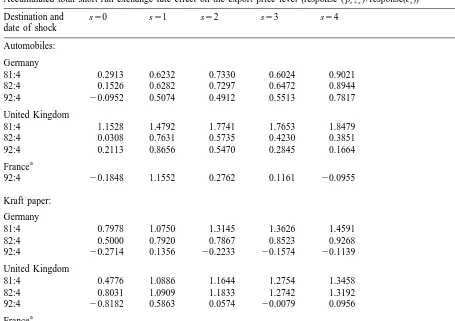
The most apparent evidence of a non-zero and incomplete short-run pass-through is seen in the automobile exports to Germany where the export price absorbs about 63% of the devaluations in 1981
and 1982 within a quarter, implying a total pass-through of 137% (see Table 1). The overall
impression is that the export prices of automobiles and kraft paper have reacted quite strongly to the exchange rate movements implying that the local currency prices are stabilized. Both goods show similar price responses, perhaps with a somewhat smaller pass-through on average for the kraft paper markets.
On average the results indicate no great difference between the two devaluations in the 1980s (with an exception for the British automobile market). However, the responses, in all markets, are more unstable after the regime shift and depreciation in 1992 than after the devaluations in 1981 and 1982. Given the costs of adjusting the supplied quantity, the price setting and pass-through will be a result of exchange rate expectations (see Gagnon and Knetter, 1995). Expectations probably varied more after the regime shift in 1992 than after the devaluations under the fixed exchange rate regime. Greater uncertainty about the future development of the exchange rate can thus, in principle, explain the different pricing response 1992–1993. On average the exchange rate change is passed through to the local currency price to a greater extent after the depreciation in 1992 compared to the devaluations in the 1980s. There is thus less pricing to market in the 1990s than in the 1980s.
For comparison, the partial short-run dynamics, i.e. the exchange rate coefficient in the pricing equation (Gj,14), as well as a likelihood ratio test on whether the partial short-run exchange rate elasticity of the export price is complete (G1,1451), are displayed in Table 2. The partial export price responses are, for most destinations, smaller compared to the total responses, implying a larger partial
7
This follows from; response ( yt21)50, response ( y )t 5u1, response ( yt11)5B3response( y )t 5B3u1and so on. The response to the depreciation in 1992 is determined by the same formula given that the exchange rate change is captured by
DD .3,t
8
The data sources are Statistics Sweden, Bank of International Settlements, OECD Main Economic Indicators, Konjunkturinstitutet, Statistiches Bundesamt, EUROSTAT and Central Statistical Office. See Adolfson (1999) for a more detailed discussion of the data, and Alexius and Vredin (1999) for an earlier application of the same data on export prices.
9
Table 1
Accumulated total short-run exchange rate effect on the export price level (response ( pt1s) / response(e ))t Destination and s50 s51 s52 s53 s54
date of shock Automobiles: Germany
81:4 0.2913 0.6232 0.7330 0.6024 0.9021
82:4 0.1526 0.6282 0.7297 0.6472 0.8944
92:4 20.0952 0.5074 0.4912 0.5513 0.7817
United Kingdom
81:4 1.1528 1.4792 1.7741 1.7653 1.8479
82:4 0.0308 0.7631 0.5735 0.4230 0.3851
92:4 0.2113 0.8656 0.5470 0.2845 0.1664
a
France
92:4 20.1848 1.1552 0.2762 0.1161 20.0955
Kraft paper: Germany
81:4 0.7978 1.0750 1.3145 1.3626 1.4591
82:4 0.5000 0.7920 0.7867 0.8523 0.9268
92:4 20.2714 0.1356 20.2233 20.1574 20.1139 United Kingdom
81:4 0.4776 1.0886 1.1644 1.2754 1.3458
82:4 0.8031 1.0909 1.1833 1.2742 1.3192
92:4 20.8182 0.5863 0.0574 20.0079 0.0956
a
France
92:4 20.4896 0.3005 20.0029 20.1694 20.1009
a
Note: The sample period for France is 1984:1–1994:4.
Table 2
Partial short-run dynamics of the exchange rate
Destination Coefficient in the pricing equation LR-test ( p-value)
Det21 (G1,14) H :0 G1,1451
Automobiles:
Germany 0.032 0.00
United Kingdom 0.466 0.05
a
France 1.135 0.83
Kraft paper:
a
Germany 0.492 0.00
United Kingdom 0.174 0.00
a
France 0.639 0.15
a
exchange rate pass-through. Note that half of the partial coefficients are insignificant (in that case rendering a full pass-through).
4. Conclusions
Once leaving the single equation, partial equilibrium framework, it is not easy to define and estimate the pass-through of exchange rate changes to export and import prices. There are several long run equilibrium relations between exchange rates and prices. The approach taken in this paper is to look at purely exogenous exchange rate changes such as devaluations. The empirical results reveal large differences between partial and total pass-through coefficients. The differences in the total pass-through coefficients across the destination markets suggest that pricing to market is present in Swedish exports of automobiles and kraft paper.
Acknowledgements
¨
I would especially like to thank Anders Vredin and Paul Soderlind for valuable suggestions and advice. I have also benefited from comments by Nils Gottfries, Richard Friberg, Tor Jacobson, Helen
¨
Jakobsson and Anders Warne. Financial support from Ragnar Soderberg’s foundation is gratefully acknowledged. Part of this work was done while visiting the Research Department at Sveriges Riksbank.
References
Adolfson, M., 1999. Swedish export price determination: pricing to market shares? Working Paper No. 96, Sveriges Riksbank.
Alexius, A., Vredin, A., 1999. Pricing-to-market in Swedish exports. Scandinavian Journal of Economics 101 (2), 223–239. Feenstra, R.C., Gagnon, J.E., Knetter, M.M., 1996. Market share and exchange rate pass-through in world automobile trade.
Journal of International Economics 40, 187–207.
Feenstra, R.C., Kendall, J.D., 1997. Pass-through of exchange rates and purchasing power parity. Journal of International Economics 43, 237–261.
Gagnon, J.E., Knetter, M.M., 1995. Markup adjustment and exchange rate fluctuations: evidence from panel data on automobile exports. Journal of International Money and Finance 14 (2), 289–310.
Goldberg, P.K., Knetter, M.M., 1997. Goods prices and exchange rates: what have we learned? Journal of Economic Literature XXXV, 1243–1272.
Johansen, S., 1988. Statistical analysis of cointegration vectors. Journal of Economic Dynamics and Control 12, 231–254. Kasa, K., 1992. Adjustment costs and pricing-to-market. Journal of International Economics 32, 1–30.
Krugman, P., 1987. Pricing to market when the exchange rate changes. In: Arndt, S.W., Richardson, J.D. (Eds.), Real-Financial Linkages Among Open Economies. MIT Press, pp. 49–70.