Across and Within Countries
Tammy A. Rapp and Subhash C. Sharma
This paper utilizes cointegration testing and common-feature testing to investigate market efficiency among daily spot and forward exchange rates of the G-7 countries. Efficiency of the exchange rates was tested across countries and within countries. Across country efficiency was tested for co-movement between spot exchange rates and between forward exchange rates of different countries. The across-country evidence supports efficiency, as no co-movement was detected. Within-country efficiency was investigated using three different tests, and the results are mixed. Market efficiency within countries is supported by the finding of co-movement between the forward rate and the corresponding spot rate, and by the finding of stationarity of the forecast errors. However, the rate of depreciation and the forward premium were not found to exhibit the co-movement that efficiency would imply. © 1999 Elsevier Science Inc.
Keywords:Exchange rates; Efficiency; Common feature; Cointegration JEL classification:F, F3
I. Introduction
There is a growing interest among researchers, currency traders, and politicians as to whether or not the exchange rates are determined efficiently in the markets. The concept of efficient markets was originated by Fama (1965), who described an efficient market as consisting of a large number of competitive profit maximizers interacting in a market utilizing all available information in a rational manner. In an efficient market, prices must fully reflect all relevant and available information; hence, no profit opportunities are left unexploited. If currency markets are efficient, the spot (forward) exchange rates should embody all relevant information, and it should not be possible to forecast one spot
Department of Economics and Finance, Northeast Louisiana University, Monroe, Louisiana; Department of Economics, Southern Illinois University, Carbondale, Illinois.
Address correspondence to: Dr. T. A. Rapp, College of Business Administration, Department of Economics and Finance, Northeast Louisiana University, Monroe, LA 71209-0130.
Journal of Economics and Business 1999; 51:423– 439 0148-6195 / 99 / $–see front matter
(forward) exchange rate as a function of another. Also, the current forward rate should be an unbiased predictor of the future spot rate if we assume risk neutrality and a covariance stationary risk premium. That is, the current forward exchange rate should forecast the future spot rate if the markets are efficient.
To test for exchange rate market efficiency across countries, a number of researchers, such as MacDonald and Taylor (1989), Coleman (1990), Hakkio and Rush (1989), Copeland (1991), Sephton and Larsen (1991), Baillie and Bollerslev (1994), and Diebold et al. (1994), have applied the concept of cointegration to spot exchange rates. If spot exchange rates are cointegrated, then the series can be expressed with a causal ordering in at least one direction. Thus, it is hypothesized that if the exchange rates are cointe-grated, then it is possible to predict one from another, thereby violating the efficient market hypothesis. Depending on the time period, selection of exchange rates, and methodology utilized, these researchers have differed in their rejection of the Efficient Market Hypothesis (EMH) for spot exchange rates. Similarly, Baillie and Bollerslev (1989) and Hakkio and Rush (1989) investigated market efficiency across countries among forward exchange rates by applying the concepts of bivariate and multivariate cointegration.
Exchange rate efficiency can also be tested within a single country by testing for co-movement between a single country’s spot and forward exchange rates. Studies utilizing cointegration to investigate exchange rate efficiency within a country include Baillie and Bollerslev (1989), Hakkio and Rush (1989), and Crowder (1994). Generally, the results have supported market efficiency within the countries studied.
This study investigates the efficiency of the spot and forward exchange rates markets across countries and within countries. To test for market efficiency across countries, the daily spot exchange rates and one-month forward exchange rates, with respect to the U.S. dollar, from June 1, 1973 through December 31, 1996 for the Group of Seven countries (i.e., United States, Germany, Italy, Japan, the United Kingdom, France, and Canada) were utilized. Cointegration testing within the context of bivariate models were utilized for spot and for forward exchange rates to determine whether a long-run relationship between the spot exchange rates or between the forward exchange rates exists. If a long-run relationship exists, this would violate the EMH, as one spot (forward) exchange rate could be predicted as a function of another spot (forward) exchange rate. For bivariate pairs not found to have a cointegrating relation, common feature tests were used in order to analyze stationary co-movement between exchange rates. A common serial correlation feature between spot exchange rates or between forward exchange rates would indicate market inefficiency.
To test for market efficiency within the individual countries, the same data were utilized as for the efficiency tests across countries except, in this analysis, we took the spot and forward exchange rate of a single country, and investigated co-movement between the two rates. For the within-country efficiency tests there were a total of three tests performed. The forward rate should be an unbiased predictor of the future spot rate. Therefore, a spot and forward rate of the same country should exhibit co-movement. The first test investigated the existence of this predicted co-movement through the use of cointegration. The finding of a cointegrating vector would support market efficiency in this case. If no cointegrating vector is found, then common feature analysis could be utilized to test for stationary co-movement between the variables. To support market efficiency in this unbiased predictor hypothesis of the forward rate and spot rate, some co-movement, either nonstationary or stationary, needs to be ascertained. The second test
for co-movement tested for the existence of a unit root in the forecast error. If the forecast error is nonstationary, then this would imply market inefficiency. The third test was a new application of the common feature test, as proposed by Engle and Kozicki (1993), and tested for co-movement between the rate of depreciation and the forward premium. If the markets are efficiently determined, than a common feature should exist between the rate of depreciation and the forward premium.
This study has several distinct features. First, we performed a variety of tests to investigate exchange rate efficiency across countries and within countries. Across coun-tries, we investigated co-movement between the spot exchange rate of different countries and between forward exchange rates of different countries. Within countries, we per-formed three sets of tests to ascertain the existence of efficiency between forward exchange rates and the corresponding future spot rate for a single country. Second, we investigated both the daily spot and forward exchange rates for a large number of countries, and for an extended time period. Third, we allowed for nonstationarity of the data in our analysis. Fourth, we utilized a new methodology to test for the stationary co-movement between variables which did not have nonstationary co-movement, as indicated by the cointegration tests. This test, called common serial correlation feature test, allowed us to extend our test of inefficiency across countries where exchange rates may not reject efficiency due to the lack of a cointegrating vector. This test extended our test of efficiency within countries where a lack of a cointegrating vector would imply inefficiency but the data may actually contain stationary co-movement. Common feature testing also extended our test of efficiency across countries by investigating co-movement between the forward premium and the rate of depreciation.
The paper is organized as follows. Section II presents the methodology utilized. Section III provides the empirical results and interpretation. Section IV concludes.
II. Methodology
The existence of long-term relationships among the spot and forward exchange rates was tested using the Johansen (1988) and Johansen and Juselius (1990) methodology for cointegration. The existence of a cointegrating relation would imply causal ordering in at least one direction [see Granger (1986, p. 218)]. The bivariate pairings which did not demonstrate a cointegrating relation were subjected to a more stringent test for co-movement called “common serial correlation feature tests” developed by Engle and Kozicki (1993). The finding of a common serial correlation between variables would imply at least one-way causality [see Engle and Kozicki (1993, p. 373)].
The use of cointegration tests are relatively common in the literature, and the reader is referred to Johansen (1988) and Johansen and Juselius (1990) for a complete discussion. However, an introduction to cointegration and its application to exchange rate efficiency testing is included here.
Given that two series,Y1,tandY2,t, are nonstationary in levels and stationary in first differences, it is relevant to investigate the existence of a long-run relation through cointegration. Following Engle and Granger (1987), a linear combination of I(1) variables,
Y1,t5a01b1Y2,t1et, (1)
andY2,tare cointegrated, then no standard finite-dimensional autoregressive approxima-tion is feasible. The error correcapproxima-tion term,zt21, needs to be included to guarantee that the two variables,Y1,tandY2,t, do not drift too far apart. The error correction model would be:
DY1,t5a0zt211gi
O
DY2,t211biO
DY1,t211et. (2)Using Cointegration to Test Exchange Rate Efficiency Across Countries Market efficiency implies that the prices from two efficient markets for different assets cannot be cointegrated [Granger (1986)]. The first test of market efficiency across countries is to test whether various spot exchange rates are cointegrated. The spot exchange rates of two countries which are under a flexible exchange rate regime are two separate asset prices. In equation (1), letY1,tbe the spot exchange rate of country A, and Y2,tbe the spot exchange rate of country B. If the two spot exchange rates are cointegrated, then an error correction model exists which implies that part of the change in the spot rate of country A is predictable. That is, the two spot exchange rates are inefficiently determined in the market. The second test for market efficiency across countries is similar to that of the spot exchange rates, except it involves the forward exchange rates. That is, in equation (1), letY1,tbe the forward exchange rate of country A, andY2,tbe the forward exchange rate of country B.
Using Cointegration to Test Exchange Rate Efficiency Within Countries
A test for efficiency within a country focuses on a single currency, and investigates the relation between the forward exchange rate and a future spot rate. The forward exchange rate should be an unbiased and efficient predictor of the spot exchange rate. Therefore, there should exist a long-run relation between a forward rate and its corresponding future spot rate. An unbiased predictor is one that is correct on average. That is, over the long run, the forward exchange rate is just as likely to overpredict the future spot rate as it is to underpredict. If the forward rate is found to be an unbiased predictor, then this necessitates that the risk premium is zero. The risk premium, if one exists, serves as an insurance premium to induce risk-averse traders to participate. However, if a risk premium exists, then the current forward rate would consistently overpredict the future spot rate. In equation (1),Y1,tis the current forward rate for country A, andY2,tis the corresponding future spot rate for country A. Within the context of daily exchange rates and 30-day forward rates, it is natural to think that the relevant future spot rate is 22 days (22 working days in a month) in the future, as this is the time period over which the expectation typically takes place.1If the variables are cointegrated, then an error correction model is correctly specified. The model would be misspecified and yield inconsistent estimates of the parameters if we simply regressed the first difference of the future spot exchange rate on the first difference of the forward exchange rate, as this would not include the equilibrating error from the long-term model. The forward rate and future spot rate cannot drift too far apart if the markets are efficient. If the variables are cointegrated, then this is a necessary but not sufficient condition for market efficiency. In the cointegrating vector,
1The data is weekday data and the average month has 22 working days. The precedence of the use of the
22 days to represent the relevant spot rate associated with the 30-day forward rate is given in Baillie and Bollerslev (1989) and Hodrick (1987).
represented by equation (1), we must test the hypothesis that the intercept,a0, equals 0 and the slope,b1, equals 1. If this hypothesis is true, then market efficiency is supported.
Use of Common Feature Testing to Investigate Efficiency
Cointegration tests investigate long-term relationships by analyzing forms of co-movement of variables which are nonstationary. In order to investigate the forms of co-movement that are stationary, common features can be analyzed. Common serial correlation is tested by using the test statistic developed by Engle and Kozicki (1993). If two variables are not found to be cointegrated, then it would be relevant to test for common features to ascertain the existence of a long-run relation. There was a possible total of four applications of common feature testing in this study. First, for analysis of efficiency across countries, there exists two possible applications. If there was no cointe-grating vector found to exist between the spot (forward) exchange rates of the various countries, then it would be relevant to investigate common features. In the case of testing efficiency across countries, the first differences of the logs of the spot (forward) exchange rates should not share common features if the spot (forward) exchange rates are being determined efficiently in the market. The common feature tested for was serial correlation. The finding of a common serial correlation feature between two spot (forward) exchange rates would imply at least one way causality. Therefore, the past information of one exchange rate could be used to predict another, and this violates the EMH for exchange rates across countries.
Second, for analysis of efficiency within countries, there exists two possible applica-tions. The first application within countries is that the forward exchange rate and the corresponding future spot rate should share some type of movement. This co-movement could be detected through the use of cointegration tests or common feature tests. The lack of a cointegrating relation between the forward rate and future spot rate would not support market efficiency, due to lack of co-movement. However, we could extend the test for co-movement, if necessary, by testing for a common feature between the two variables. The second application within countries is that the rate of depreciation (St122 2 St) should share a co-movement with the forward premium (Ft 2 St). This co-movement could be established through the use of common feature testing.2
Engle and Kozicki (1993) stated that if a feature is present in each individual series, and if there exists a non-zero linear combination of the series which does not have the feature, then the feature is common between the series. They developed some regression-based tests for common features. Consider the following regression model:
yt5xtb 1ztg 1 et. (3)
We can test the null hypothesis H0: g 5 0 against the alternative H1: g Þ 0, where rejection of the null indicates the presence of a feature. Testing for serial correlation, we could specify {z} to include lags ofy, and {x} could be a constant.
2The rate of depreciation is generally accepted to be stationary, and we later provide unit root tests to
Assuming weak exogeneity of {x,z}, and joint stationarity of {y,x,z}, we can then compute a Lagrange multiplier (LM) statistic, under the simplifying assumption that there are no {x} in the model, which is given by:
is a consistent estimate of the residual variance, and the statistic equalsTR2from the regression ofyagainstz.
Next consider two series, y1tandy2t, each being tested for the presence of a feature within their individual series using the following regression model:
y1t5xtb11ztg11e1,t;
(5) y2t5xtb21ztg21e2,t,
where the set of regression {z,x} is the same for both series. To test for a common feature, we tested whether there is ad such thatut5 y1t 2dy2tdoes not have the feature. The parameterd was chosen to minimized as follows:
s~u!5mins~y12dy2!5u9Mxz~z9Mxz! 21z9M
xu/su29, (6)
whereMxis the projection matrix,Mx5I2 x(x9x) 21
x9. An alternative estimator, given by the LIML estimate of d in the following regression, was shown to have the same asymptotic properties:
y1t5dy2t1xtb 1 et, (7)
where the instruments are {x,z}. This resulted in the following statistic:
S~un!5u9Mxz~z9Mxz!21z9Mxun/su2. (8) The statistic was computed, in its LM form, as TR2 from the regression of the LIML residuals on {x, z}, and the number of degrees of freedom equaled the number of over-identifying restrictions. The feature can be said to be common if the null that the linear combination of the two series fails to have the feature, even though each of the series individually has it, cannot be rejected. Intuitively, we were testing whether the dependence of one of the variables with the past is only through the channels that relate other variables to the past.
III. Empirical Results
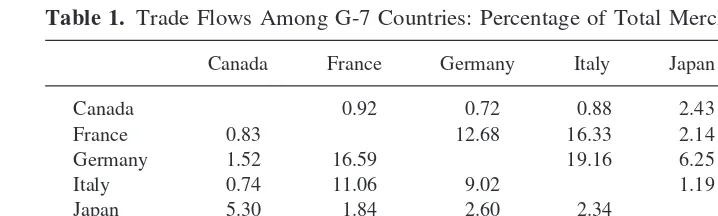
The daily bilateral spot exchange rates and daily one-month bilateral forward exchange rates from June 1, 1973 to December 31, 1996 for Canada, France, Germany, Italy, Japan and the United Kingdom in terms of U.S. dollars per unit of foreign currency were obtained from DRI/McGraw Hill, Inc. Weekday data were used, as trading does not occur on Saturday and Sunday. The G-7 countries were investigated because of their interre-latedness, due to trade and economic alliances. Table 1 provides information on trade flows between the G-7 countries as a percent of total merchandise exports. Approximately 83% of Canadian exports are to other G-7 countries. France, Germany, Italy, Japan, the United States and the United Kingdom can account for 40% to 53% of their exported merchandise with trade to G-7 countries.
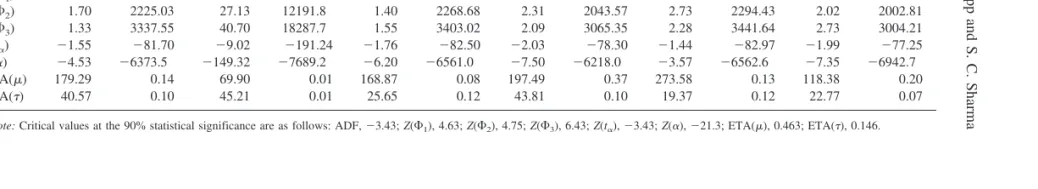
Prior to cointegration and common feature testing, the order of integration needed to be ascertained. The order of integration of the individual time series was determined, using the augmented Dickey-Fuller test [Fuller (1976); Dickey and Fuller (1981)], Phillips and Perron tests [Perron (1988); Phillips (1987); Phillips and Perron (1988)] and the Kwiat-kowski test [KwiatKwiat-kowski et al. (1992)]. Irrespective of the country considered, all of the spot and forward exchange rates were concluded to be integrated of order one. The results are provided in Tables 2 and 3.
Efficiency Tests Across Countries
The first part of testing for market efficiency among the exchange rates is to determine whether a cointegrating vector exists on a bivariate basis between any two spot exchange rates and between any two forward exchange rates. The lag lengths to be used in the bivariate cointegration models were determined by Akaike’s AIC criteria (Akaike, 1973). The null hypothesis for the maximum eigenvalue statistic is that there arercointegrating vectors, and the alternative hypothesis that there arer11 cointegrating vectors. The null hypothesis for the trace statistic is that there areror fewer cointegrating vectors, and the alternative hypothesis, that there are at leastr11 cointegrating vectors.
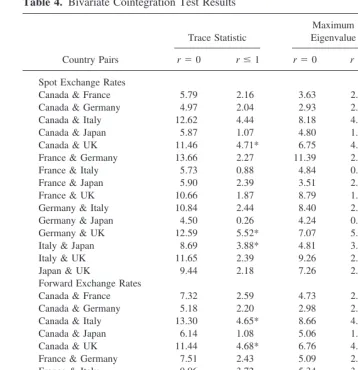
The results of these bivariate cointegration tests for the spot exchange rates and for the forward exchange rates are reported in Table 4. Starting with the maximum eigenvalue results for spot exchange rates, the statistics for the null hypothesis of no cointegration (r50) ranged from a low of 2.93 for the pairing of Canada and Germany, to a high of 11.39 for the pairing of France and Germany. We accepted the null hypothesis for all countries at the 95% level of significance. Furthermore, as the null hypotheses ofr50 was accepted in all cases, we did not continue with the test of the hypothesis forr51. For the trace test results for the spot exchange rates for the null hypothesis of no cointegration (r5 0) verses the alternative hypothesis ofr $ 1, we accepted the null hypothesis in all cases at the 95% level of significance. Therefore, for the spot exchange rates, we conclude that no cointegrating vector exists between any of the bivariate pairings, and these findings support market efficiency.
Considering the forward exchange rates, the maximum eigenvalue tests indicated that in all cases, the null hypothesis of r 5 0 was accepted. The values of the maximum eigenvalue test statistic ranged from a low of 2.98 for the pairing of Canada and Germany, to a high of 13.21 for the pairing of France and the United Kingdom. As the null hypothesis ofr50 was accepted, we did not continue to test the hypothesis ofr51. For the trace test, the null hypothesis ofr50 was accepted in all but one case. For the pairing
Table 1. Trade Flows Among G-7 Countries: Percentage of Total Merchandise Exports, 1990
Canada France Germany Italy Japan US UK
Canada 0.92 0.72 0.88 2.43 21.07 1.83
France 0.83 12.68 16.33 2.14 3.50 10.27
Germany 1.52 16.59 19.16 6.25 4.82 12.97
Italy 0.74 11.06 9.02 1.19 2.03 5.41
Japan 5.30 1.84 2.60 2.34 12.44 2.70
US 71.97 5.99 7.07 7.62 31.60 12.43
UK 2.27 8.76 8.29 7.06 3.82 6.09
Table 2. Unit Root Test Results for Spot Exchange Rates
Test
Canada France Germany Italy Japan UK Level 1st Diff. Level 1st Diff. Level 1st Diff. Level 1st Dif. Level 1st Diff. Level 1st Diff. ADF 21.34 216.56 21.56 224.85 21.22 244.50 21.96 217.38 20.70 217.21 22.34 275.11
Z(F1) 2.18 3153.12 1.03 3057.91 1.33 2968.61 1.52 2917.97 4.03 2965.17 3.13 2821.30
Z(F2) 1.68 2101.65 0.79 2037.98 1.39 1978.54 2.29 1944.82 2.69 1977.85 2.01 1881.44
Z(F3) 1.27 3152.47 1.14 3056.96 1.53 2967.81 2.06 2917.22 2.19 2966.77 2.70 2822.16
Z(ta) 21.52 279.40 21.18 278.19 21.75 277.04 22.02 276.38 21.40 277.03 21.97 275.13
Z(a) 24.38 26205.7 23.01 26133.2 26.13 26058.0 27.38 26076.2 23.43 26054.0 27.26 25891.6 ETA(m) 177.68 0.14 73.25 0.23 170.29 0.08 198.50 0.38 273.98 0.13 118.50 0.21 ETA(t) 40.23 0.10 47.11 0.13 26.08 0.12 44.23 0.11 19.96 0.13 23.08 0.07
Note:Critical values at the 90% statistical significance are as follows: ADF,23.43;Z(F1), 4.63;Z(F2), 4.75;Z(F3), 6.43;Z(ta),23.43;Z(a),221.3; ETA(m), 0.463; ETA(t), 0.146.
Table 3. Unit Root Test Results for Forward Exchange Rates
Test
Canada France Germany Italy Japan UK Level 1st Diff. Level 1st Diff. Level 1st Diff. Level 1st Diff. Level 1st Diff. Level 1st Diff. ADF 21.40 220.17 21.70 224.69 21.29 224.64 22.00 217.56 20.69 217.19 22.32 277.50
Z(F1) 2.21 3338.32 1239.13 90168.0 1.33 3410.01 1.51 3066.03 4.09 3444.32 3.04 3004.56
Z(F2) 1.70 2225.03 27.13 12191.8 1.40 2268.68 2.31 2043.57 2.73 2294.43 2.02 2002.81
Z(F3) 1.33 3337.55 40.70 18287.7 1.55 3403.02 2.09 3065.35 2.28 3441.64 2.73 3004.21
Z(ta) 21.55 281.70 29.02 2191.24 21.76 282.50 22.03 278.30 21.44 282.97 21.99 277.25
Z(a) 24.53 26373.5 2149.32 27689.2 26.20 26561.0 27.50 26218.0 23.57 26562.6 27.35 26942.7 ETA(m) 179.29 0.14 69.90 0.01 168.87 0.08 197.49 0.37 273.58 0.13 118.38 0.20 ETA(t) 40.57 0.10 45.21 0.01 25.65 0.12 43.81 0.10 19.37 0.12 22.77 0.07
Note:Critical values at the 90% statistical significance are as follows: ADF,23.43;Z(F1), 4.63;Z(F2), 4.75;Z(F3), 6.43;Z(ta),23.43;Z(a),221.3; ETA(m), 0.463; ETA(t), 0.146.
430
T.
A.
Rapp
and
S.
C.
of France and the United Kingdom, the null hypothesis ofr5 0 for the trace test was rejected, with a trace test statistic of 17.68. However, following the convention stated in Johansen and Juselius (1990), that one should expect the maximum eigenvalue test to produce the most clear results, we conclude that no cointegrating vector exists in the pairing.
Overall, our cointegration results for the spot and forward exchange rates indicate no long-run relation between the variables, that is, no cointegrating vector. Therefore, based upon the cointegration results, we concluded that there is no evidence that the exchange rates are inefficiently determined in the market. Next, we proceeded to further test the market efficiency hypothesis by testing for common serial correlation among all of the bivariate pairings, as no cointegrating vectors were found.
The first step of the bivariate common serial correlation feature test was to establish the existence of the feature in each individual series. Equation (5) was estimated, wherezis
Table 4. Bivariate Cointegration Test Results
Canada & France 5.79 2.16 3.63 2.16 0
Canada & Germany 4.97 2.04 2.93 2.04 0
Canada & Italy 12.62 4.44 8.18 4.44 0
Canada & Japan 5.87 1.07 4.80 1.07 0
Canada & UK 11.46 4.71* 6.75 4.71* 0
France & Germany 13.66 2.27 11.39 2.27 0
France & Italy 5.73 0.88 4.84 0.88 0
France & Japan 5.90 2.39 3.51 2.39 0
France & UK 10.66 1.87 8.79 1.87 0
Germany & Italy 10.84 2.44 8.40 2.44 0
Germany & Japan 4.50 0.26 4.24 0.26 0
Germany & UK 12.59 5.52* 7.07 5.52* 0
Italy & Japan 8.69 3.88* 4.81 3.88* 0
Italy & UK 11.65 2.39 9.26 2.39 0
Japan & UK 9.44 2.18 7.26 2.18 0
Forward Exchange Rates
Canada & France 7.32 2.59 4.73 2.59 0
Canada & Germany 5.18 2.20 2.98 2.20 0
Canada & Italy 13.30 4.65* 8.66 4.65* 0
Canada & Japan 6.14 1.08 5.06 1.08 0
Canada & UK 11.44 4.68* 6.76 4.68* 0
France & Germany 7.51 2.43 5.09 2.43 0
France & Italy 9.06 3.72 5.34 3.72 0
France & Japan 6.19 1.06 5.13 1.06 0
France & UK 17.68* 4.47* 13.21 4.47* 0
Germany & Italy 8.25 2.67 5.59 2.67 0
Germany & Japan 4.42 0.27 4.16 0.27 0
Germany & UK 12.94 5.68* 7.26 5.68* 0
Italy & Japan 8.66 3.70 4.96 3.70 0
Italy & UK 12.93 2.32 10.61 2.32 0
Japan & UK 9.80 2.39 7.41 2.39 0
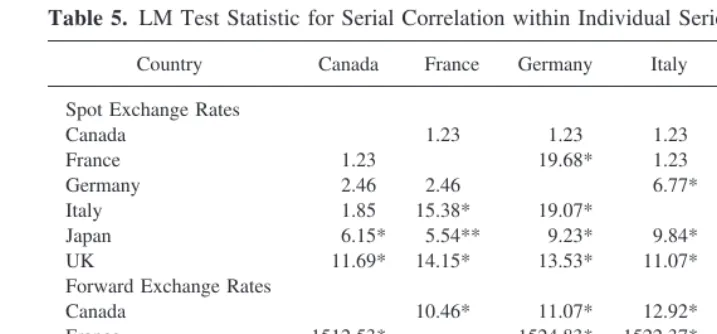
a vector of lags ofy1t andy2t, and the results are presented in Table 5 for the spot and forward exchange rates. In the table, the corresponding LM test statistic is given and is distributedx2with two degrees of freedom. The null hypothesis is that no feature exists, and the alternative hypothesis is that a feature exists within the series. The critical value at the 10% level is 4.61. First, for the spot exchange rates, of the 30 least square regressions, 16 showed evidence of serial correlation by rejecting the hypothesis that all coefficients are zero at the 10% level. Of these, four of the possible fifteen pairs showed a feature in both countries. That is, for the spot exchange rates, four pairs of countries had serial correlation in both of the individual series. These pairings, for the spot exchange rates, are France and the United Kingdom; Germany and Italy; Italy and the United Kingdom; and Japan and the United Kingdom. It was with these four pairings for the spot exchange rates that we proceeded with the common feature test.
Second, for the forward exchange rates, of the 30 least square regressions, 25 showed evidence of a cycle by rejecting the hypothesis that all coefficients are zero at the 10% level. Of these, 10 of the possible 15 pairs showed a feature in both countries. These pairings, demonstrating a serial correlation feature in each of the individual series, include Canada and France; Canada and Germany; Canada and Japan; Canada and Italy; France and Germany; France and Italy; Germany and Japan; Germany and Italy; Italy and the United Kingdom; and Japan and Italy. It was with these 10 pairings for the forward exchange rates that we proceeded with the common feature test.
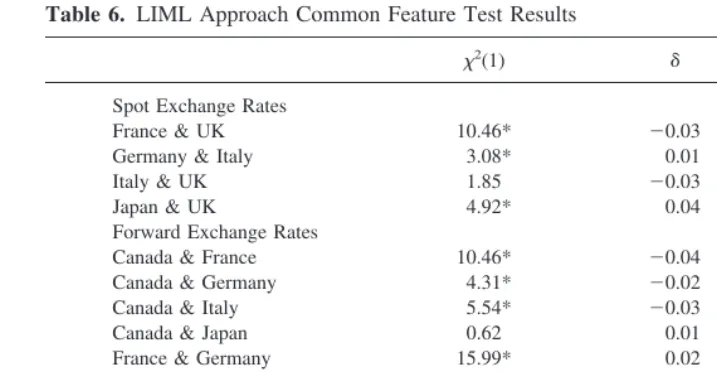
The second step in testing for common features was to test the exchange rate pairs which were identified in the first step as having the feature individually, and to ascertain for which of these pairs the feature was due to a single component. The LIML approach, which minimizes the feature test statistic, is summarized in Table 6. Table 6 contains three entries for each spot and forward exchange rate pairing. The LIML approach is indifferent as to which variable is normalized in the estimation. The first entry is the feature test statistic, which is distributedx2with one degree of freedom with critical values of 2.71, 3.84, and 6.64, respectively, at the 10%, 5%, and 1% levels. The null hypothesis of the feature test statistic is that no feature exists for the linear combination of the two variables which signifies that the feature is actually common between the two exchange rates. The
Table 5. LM Test Statistic for Serial Correlation within Individual Series
Country Canada France Germany Italy Japan UK
Spot Exchange Rates
Note:* (**) denotes statistical significance at the 5% (10%) level. Critical values are 5.99 (4.61) at the 5% (10%) level.
other entries include the coefficient estimate of the first country’s exchange rate, and the Ljung-Box Q(12) statistic for the minimum linear combination error term.
For the spot exchange rates, we found that thex2test statistic for the null hypothesis that the feature is common to the two countries’ exchange rates was rejected in three of the possible four pairings. Only the spot exchange rate for Italy and the United Kingdom showed evidence of a common serial correlation feature. This finding of a common feature would lend evidence that these two spot exchange rates are not efficiently determined in the exchange rate market. Recall, Engle and Kozicki (1993, p. 373) noted that common serial correlation implies at least one-way causality. However, all other spot exchange rate pairings were indicated to be efficiently determined, based on the results of the cointe-gration and common feature tests.
For the forward exchange rates, the null hypothesis of a common feature was rejected in eight of the ten possible pairings, in favor of the alternative hypothesis of no common feature. Only the pairings of Canada and Japan, and of Italy and the United Kingdom showed evidence of a common serial correlation feature by accepting the null hypothesis. All of the pairings, except these two, for the forward exchange rate were indicated to be efficiently determined in the market, based on the cointegration and common feature tests. Sephton and Larsen (1991) noted that the inconsistent cointegration results among the research was attributable to the time period and methodology utilized. However, the current findings also indicate that the conflicting finding may be due to co-movement among the variables, which are stationary; that is, common shocks that are less persistent than unit roots. Although co-movement may exist between exchange rates, cointegration tests may not be the most appropriate tests in this instance in order to detect all forms of co-movement.
Efficiency Tests Within Countries
The efficiency of exchange rates within a country was tested utilizing three models. The first model tested for the existence of a cointegrating vector between the forward exchange
Table 6. LIML Approach Common Feature Test Results
x2(1) d Q(12)
Spot Exchange Rates
France & UK 10.46* 20.03 20.72
Germany & Italy 3.08* 0.01 18.71
Italy & UK 1.85 20.03 10.82
Japan & UK 4.92* 0.04 26.76
Forward Exchange Rates
Canada & France 10.46* 20.04 8.09
Canada & Germany 4.31* 20.02 13.77
Canada & Italy 5.54* 20.03 11.49
Canada & Japan 0.62 0.01 32.48
France & Germany 15.99* 0.02 21.52
France & Italy 19.68* 0.01 23.82
Germany & Italy 21.53* 20.04 27.19
Germany & Japan 4.92* 0.01 32.86
Italy & Japan 3.69* 0.01 36.09
Italy & UK 0.61 20.01 11.12
Notes:The critical value for the feature test statistic given byx2(1) is 2.71 at the 10% level.
rate and the corresponding future spot rate of a single country. The second model tested for a unit root in the forecast error. In this second model, if the exchange rates are determined efficiently, then no unit root should exist in the forecast error. The third model investigated the existence of co-movement between the rate of depreciation and the forward premium. If the rates are determined efficiently, co-movement— either stationary or nonstationary—should exist.
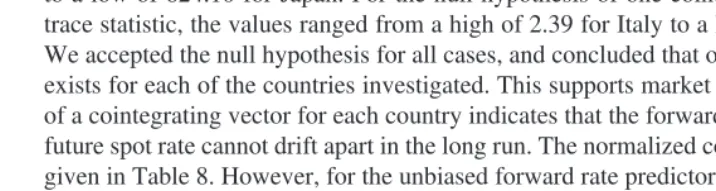
The results of the cointegration test between the forward exchange rate and future spot rate are presented in Table 7. Starting with the maximum eigenvalue results for spot exchange rates, the statistics for the null hypothesis of no cointegration (r5 0) ranged from a low of 438.23 for France to a high of 622.30 for Japan. We rejected the null hypothesis for all countries at the 95% level of significance. The statistics for the null hypothesis of one cointegrating vector (r51) ranged from a low of 0.04 for France to a high of 2.39 for Italy. We accepted the null hypothesis of one cointegrating vector in all cases. For the trace test results for the null hypothesis of no cointegration (r50) verses the alternative hypothesis ofr$0, we rejected the null hypothesis in all cases at the 95% level of significance. The test statistics ranged in value from a high of 438.27 for France to a low of 624.10 for Japan. For the null hypothesis of one cointegrating vector for the trace statistic, the values ranged from a high of 2.39 for Italy to a low of 0.04 for France. We accepted the null hypothesis for all cases, and concluded that one cointegrating vector exists for each of the countries investigated. This supports market efficiency. The finding of a cointegrating vector for each country indicates that the forward exchange rate and the future spot rate cannot drift apart in the long run. The normalized cointegrating vectors are given in Table 8. However, for the unbiased forward rate predictor hypothesis to hold, the
Table 7. Bivariate Cointegration Test Results for Unbiased Predictor Hypothesis
Country
Notes:* denotes significance at the 95% level. Critical values are taken from Ostenwald-Lenum (1992).
Table 8. Normalized Cointegrating Vectors for the Unbiased Predictor Hypothesis
Country
Notes: Y1is the variable for the spot exchange rate, andY2is the variable for the forward exchange rate. The cointegrating
vector is given byY15a01b1(Y2).
* denotes significance at the 95% level.
intercept must be equal to 0 and the slope be equal to 1. Therefore, included in Table 8 is the test of the hypothesis ofa050 andb151. We found that the hypothesis, in this long-run relation, was rejected for all countries except France. Therefore, the countries of Canada, Germany, Italy, Japan, and the United Kingdom did not exhibit market efficiency. That is, either the risk premium was nonzero or the expected returns to speculators was nonzero for these five countries. In the case of a risk premium, the forward rate differed from the expected future spot rate by this premium, which can fluctuate across time.
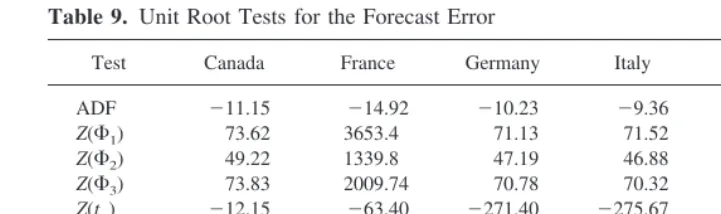
The second test for efficiency within a country was to determine whether a unit root existed in the forecast error, (Ft2 St122). The results of the unit root tests are given in Table 9. The unit root tests nearly all supported the lack of a unit root in the series; thereby, supporting exchange rate efficiency.3
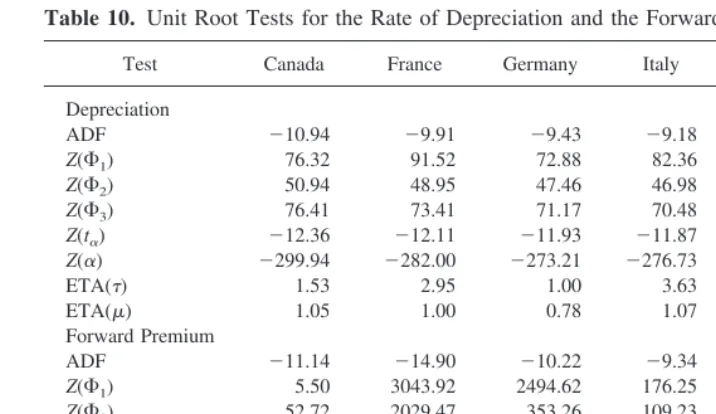
The third method to test for efficiency within a country required that the rate of depreciation and the forward premium be stationary. It is generally assumed, and we have shown in Table 2, that the first difference of the spot exchange rate (St 2 St21) is stationary. We would anticipate that (St1222St), the rate of depreciation during the time of a forward contract, is stationary. In Table 10, we provide the unit root tests which support the stationarity of the depreciation rate. Table 10 also provides the unit root tests for the forward premium. This variable was found to be stationary as well.
The third method to test for efficiency within a country utilized common feature testing. We tested for a common serial correlation feature between the rate of depreciation, (St1222St), and the forward premium, (Ft2St). As both of these variable are stationary, common feature testing is appropriate. If the markets are efficient, a common feature should exist between the variables.
The first step of the bivariate common serial correlation feature test was to establish the existence of the feature in each individual series. Equation (5) was estimated whereY1t5 (St1222St);Y2t5(Ft2St); andztis a vector of the lags of (St2222St) and (Ft2St). For each country, a set of equations were estimated with (St222 2 St) as the dependent variable, and then a set of equations were estimated with (Ft 2 St) as the dependent variable. The results are presented in Table 11. In the table, the corresponding LM test statistic is given and is distributedx2with two degrees of freedom. The null hypothesis is that no feature exists, and the alternative hypothesis is that a feature exists within the
3The KPSS unit root tests denoted by ETA(t) and ETA(m) in Tables 9 and 10 did not support stationarity
of the variables. However, the augmented Dickey Fuller test and the battery of Phillips and Perron tests did support stationarity.
Table 9. Unit Root Tests for the Forecast Error
Test Canada France Germany Italy Japan UK
individual series. The critical value at the 10% level is 4.61. For the depreciation rate, all six countries clearly rejected the null hypothesis of no feature. For the forward premium, all of the countries except France rejected the null hypothesis. Both series need to exhibit the feature in order to proceed with the common feature test. Therefore, we did not proceed with the common feature test for France.
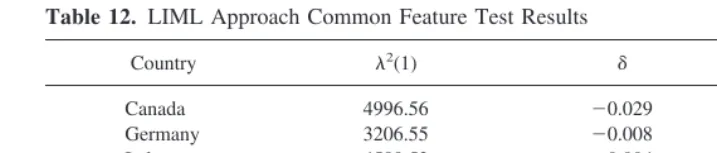
The second step in testing for a common feature was to test the variable pairs which were identified in the first step as having the feature individually, and to ascertain for which of these pairs the feature was due to a single component. The LIML approach, which minimizes the feature test statistic, is given in Table 12. Table 12 contains three entries for each variable pairing. The first entry is the feature test statistic, which is distributedx2with one degree of freedom. The null hypothesis is that no feature exists for the linear combination of the two variables, which signifies that the feature is actually common between the two variables. For all five countries, we rejected the null hypothesis of no feature for the linear combination, which implies that a common feature does not exist between the variables. These results imply market inefficiency.
Table 10. Unit Root Tests for the Rate of Depreciation and the Forward Premium
Test Canada France Germany Italy Japan UK
Depreciation
Z(F1) 5.50 3043.92 2494.62 176.25 152.99 282.32
Z(F2) 52.72 2029.47 353.26 109.23 52.81 88.14
Table 11. LM Test Statistic for Serial Correlation within Individual Series
Therefore, for the tests for efficiency within countries, our results were mixed. We were able to ascertain co-movement, both stationary and nonstationary, among the variables. Using cointegration, we tested for nonstationary co-movement betweenFtand St122, and found that a long-term relation existed. However, further tests found the risk premium to be nonzero and the slope variable to not be equal to 1 in all but one country. The forecast did not contain a unit root which supported efficiency; however, the rate of depreciation and the forward premium did not demonstrate the co-movement necessary for efficiency.
IV. Conclusion
Prior studies such as MacDonald and Taylor (1989), Coleman (1990), and Hakkio and Rush (1989) have been generally supportive of efficient markets of the spot exchange rates. Sephton and Larsen (1991) were the exception, with their results indicating depen-dence on the time period analyzed and methodology used. The present study utilized common feature testing in addition to cointegration testing to ascertain whether spot and forward exchange rates across countries are determined efficiently in the market. The cointegration results indicated no cointegrating vectors to exist among the bivariate pairings of the spot and forward exchange rates, providing evidence in support of the findings of market efficiency across countries by earlier researchers. Common serial correlation testing was then applied to these pairings to investigate stationary co-movement among the variables. The common feature testing indicated market inefficiency in only one of the possible fifteen spot exchange rate pairings, and in two of the possible fifteen forward exchange rate pairings. Overall, the findings support market efficiency across countries among the spot and forward exchange rates of the G-7 countries for the period 1973–1996.
This paper also investigated efficiency within countries by testing for a long-run relation between the forward rate and future spot rate of a single country. Such a long-run relation should exist, as a forward rate should be an unbiased predictor of the future spot rate. The results showed that a cointegrating vector consistently existed between the pairings for all of the countries investigated, and this also supports market efficiency. However, the unbiased forward predictor hypothesis, which is a necessary condition for efficiency, was not supported. The forecast error of all six countries was found to be stationary, which supports efficiency. However, the rate of depreciation and the forward premium in all cases did not exhibit the co-movement necessary for market efficiency. The efficiency tests within countries were highly mixed in their results.
The authors would like to express their appreciation to the two anonymous reviewers and the editors for their
Table 12. LIML Approach Common Feature Test Results
Country l2(1) d Q(12)
Canada 4996.56 20.029 932.77
Germany 3206.55 20.008 962.78
Italy 4589.53 0.004 780.29
Japan 5231.96 20.016 362.29
helpful comments and insights, which greatly improved the presentation of the study.
References
Akaike, H. (1973). “Information Theory and the Extension of the Maximum Likelihood Principle.” In 2nd International Symposium on Information Theory, B. N. Petrov and F. Csaki, eds., Budapest.
Baille, R. T., and Bollerslev, T. March 1989. Common stochastic trends in a system of exchange rates.The Journal of FinanceXLIV (1):167–181.
Baille, R. T., and Bollerslev, T. June 1994. Cointegration, fractional cointegration, and exchange rate dynamics.The Journal of FinanceXLIX (2):737–745.
Coleman, M. January 1990. Cointegration-based tests of daily foreign exchange market efficiency.
Economics Letters32:53–59.
Copeland, L. S. May 1991. Cointegration tests with daily exchange rate data.Oxford Bulletin of Economics and Statistics53 (2):185–198.
Crowder, W. J. May 1994. Foreign exchange market efficiency and common stochastic trends.
Journal of International Money and Finance13 (5):551–564.
Dickey, D. A., and Fuller, W. A. July 1981. Likelihood ratio statistics for autoregressive time series with a unit root.Econometrica49(4):1057–1072.
Diebold, F. X., Garbeazabal, J., and Yilmaz, K. June 1994. On cointegration and exchange rate dynamics.The Journal of FinanceXLIX (2):727–735.
Engle, R. F., and Granger, C. March 1987. Cointegration and error correction: Representation, estimation and testing.Econometrica55(2):251–276.
Engle, R. F., and Kozicki, S. October 1993. Testing for common features.Journal of Business and Economic Statistics11 (4):369–395.
Fama, E. F. January 1965. The behavior of stock market prices.Journal of Business38(1):34–105. Fuller, W. A. 1976.Introduction to Statistical Time Series. New York: Wiley.
Granger, C. August 1986. Developments in the study of cointegrated economic variables.Oxford Bulletin of Economics and Statistics48(3):213–225.
Hakkio, C. S., and Rush, M. March 1989. Market efficiency and cointegration: An application to the Sterling and Deutschemark exchange markets. Journal of International Money and Finance
8(1):75–88.
Hansen, H., and Juselius, K. 1995.CATS in RATS: Cointegration Analysis of Time SeriesEvanston, IL: Estima.
Hodrick, R. J. 1987.The Empirical Evidence on the Efficiency of Forward and Futures Foreign Exchange Markets. Zurich: Harwood Academic Publishers.
Johansen, S. September 1988. Statistical analysis of cointegrating vectors. Journal of Economic Dynamics and Control12(2–3):231–254.
Johansen, S., and Juselius, K. May 1990. Maximum likelihood estimation and inference on cointegration—With applications to the demand for money.Oxford Bulletin of Economics and Statistics52(2):169–210.
Kwiatkowski, D., Phillips, P., Schmidt, P., and Shin, Y. October–December 1992. Testing the null hypothesis of stationarity against the alternative of a unit root. Journal of Econometrics
54(1–3):159–178.
MacDonald, R., and Taylor, M. January 1989. Foreign exchange market efficiency and cointegra-tion: Some evidence from the recent float.Economics Letters29(1):63–68.
Osterwald-Lenum, M. August 1992. A note with fractiles of the asymptotic distribution of the maximum likelihood cointegration rank test statistics: Four cases.Oxford Bulletin of Economics and Statistics54(3):461–472.
Perron, P. June–September 1988. Trend and random walks in macroeconomic time series: Further evidence from a new approach.Journal of Economic Dynamics and Control12(2–3):297–332. Phillips, P. March 1987. Time series regression with a unit root.Econometrica55(2):277–301. Phillips, P., and Perron, P. June 1988. Testing for a unit root in time series regression.Biometrika
75(2):335–346.