www.elsevier.com / locate / bres
Research report
Differential increase in cerebral cortical glucose oxidative metabolism
during rat postnatal development is greater in vivo than in vitro
a,c c b c
Edward J. Novotny Jr. , Cristopher Ariyan , Graeme F. Mason , John O’Reilly ,
c a ,
*
Gabriel G. Haddad , Kevin L. Behar
a
Department of Neurology, Yale University School of Medicine, New Haven, CT 06520, USA b
Department of Psychiatry, Yale University School of Medicine, New Haven, CT 06520, USA c
Department of Pediatrics, Yale University School of Medicine, New Haven, CT 06520, USA
Accepted 26 September 2000
Abstract
The steady-state rate of glucose oxidation through the mitochondrial TCA cycle (VTCA) was measured in acid extracts of 10- and
13
30-day-old cerebral cortex of rats receiving [1- C]glucose intravenously and in neocortical slices superfused in vitro with the same isotope. TCA cycle flux was determined for each age group based on metabolic modeling analysis of the isotopic turnover of cortical glutamate and lactate. The sensitivity of the calculated rates to assumed parameters in the model were also assessed. Between 10 and 30
21 21
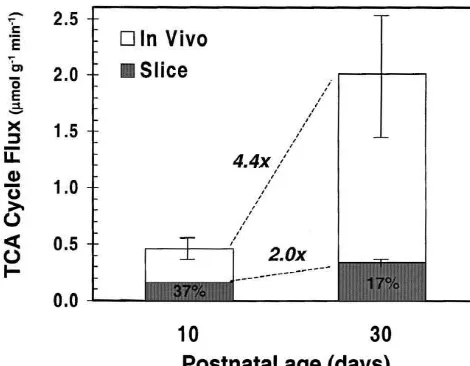
postnatal days, VTCAincreased by 4.3-fold (from 0.46 to 2.0mmol g min ) in the cortex in vivo, whereas only a 2-fold (from 0.17 to
21 21
0.34mmol g min ) increase was observed in neocortical slices. The much greater increase in glucose oxidative metabolism of the cortex measured in vivo over that measured in vitro as the cortex matures suggests that function-related energy demands increase during development, a process that is deficient in the slice as a result of deafferentiation and other mechanisms. 2001 Elsevier Science B.V. All rights reserved.
Theme: Other systems of the CNS
Topic: Brain metabolism and blood flow
13
Keywords: Cerebral development; Tricarboxylic acid cycle; Oxygen consumption; Nuclear magnetic resonance spectroscopy; C isotopes; Glutamate; Glycolysis
1. Introduction demands of synaptic activity of the neocortex during postnatal development is not known. In adult neurons Glucose and oxygen consumption in rat brain increases stimulation-dependent increases in glucose utilization are substantially during the first postnatal month localized in synaptic regions [45,46], suggesting a similar [4,9,14,17,32–35,48]. This period of rapid increase in location for the increase in functional glucose utilization glucose metabolism coincides temporally with maturation observed in the developing neocortex. Although, respirato-of synapses [1,29], receptors [28], neuronal-glial metabolic ry rates of brain slices metabolizing glucose appear lower interactions [6,40] and development of sensory functions than those reported in the cortex in vivo under basal and electrical activity [7,10,32]. The fraction of neocortical conditions [22], brain slices from neonatal rats show a glucose and oxygen consumption that supports the energy strong age dependence for the capacity to increase glucose utilization during stimulation [19,48] indicating that mech-anisms responsible for stimulation-dependent glucose utili-zation are retained in the slice preparation. However,
*Corresponding author. Department of Neurology and Magnetic Reso- interpretation of the differences in metabolic rates between nance Center, Yale University School of Medicine, PO Box 208024, New
brain slices and their in vivo counterpart reported in the
Haven, CT 06520-8024, USA. Tel.:11-203-737-4121; fax:1
1-203-785-literature is hampered by differences in measurement
6643.
E-mail address: [email protected] (K.L. Behar). techniques and assumptions made in calculating fluxes,
13
animal species, brain regions measured, and the use and perfusate was replaced by [1- C]glucose (99 atom%) after
type of anesthetic agent. a 30-min equilibration period. Approximately 12 slices
In the present study, we have examined the influence of were prepared and incubated simultaneously. At selected development on the difference in glucose oxidative metab- times (0, 15, 30, 60, 90, and 120 min) after the additions of olism in the cerebral cortex of 10–12- and 28–30-day-old the labeled glucose, two to three slices were quickly rats in vivo and in brain slices prepared in vitro. These removed from the incubation chamber directly into liquid postnatal ages border the major increases observed in N . Thus, a single animal yielded sufficient cortical tissue2
glucose metabolism and function in the rat cortex. We to permit generation of a single turnover curve for gluta-hypothesized that if the difference in the rates of glucose mate.
oxidation between the in vivo cortex and the brain slice is
dependent on intact, functional interactions present in vivo, 2.3. Preparation of tissue and plasma extracts but absent in the slice, then a comparison of the cortices at
these two postnatal ages in vivo and in vitro would shed Frozen brain tissue was extracted in 0.1 M methanol / light on the fraction of total glucose oxidation related to HCl and 3 M perchloric acid with minor modifications function as the brain matures. We have found that during from published methods [23]. Following centrifugation the postnatal development the maturational increase in the supernatant was neutralized with 10 N KOH, centrifuged basal rate of cortical glucose oxidative metabolism is again to remove perchlorate salts, and lyophilized. The .2-fold greater in vivo than in vitro. Our results suggest powder was dissolved in 0.5 ml D O and trimethylsilyl-2
2
that cortical metabolism associated with intact synaptic 2,2- H-propionic acid (TSP) was added as a chemical shift
1
inputs contributes a large fraction of the basal energy reference for H NMR spectroscopy. Total protein was expenditure during this period of development. measured in the acid extracted pellets after solubilization with 1 N NaOH using the ‘enhanced protocol’ of the Pierce BCA Protein Assay.
2. Materials and methods Frozen blood plasma was extracted in 0.3 M perchloric acid, centrifuged, and the supernatant was neutralized with
2.1. Animal preparation 3 N KOH. After lyophilization, the powder was dissolved
in 135 ml of 1 mM TSP in D O and 202 ml 40 mM Sprague–Dawley rats of both sexes; 10–12 days old (20 potassium fluoride and placed in a micro-NMR tube for g, n517) and 28–30 days old (150 g, n512) were analysis.
anesthetized with methoxyflurane. The left femoral artery
and right jugular vein were cannulated to permit arterial 2.4. NMR spectroscopy
13
blood sampling and intravenous infusion of [1-
C]glu-13 13
cose. The enrichment of [ C]glucose was raised rapidly C enrichments of metabolites in acid extracts of brain
13
and maintained at a constant level using a protocol adapted tissue were determined using indirect detection of C in
13 1
from Fitzpatrick et al. [13]. The [ C]glucose was infused the H NMR spectrum at 360.13 MHz (AM-360 WB for periods of 15, 30, 60, and 90 min for the 10-day-old Bruker NMR spectrometer) as described previously [13]. rats and 7.5, 15, 30, and 60 min for the 30-day-old rats All spectra were acquired fully relaxed (TR520 s) with 16 using three to five rats per time point. The different time K data points and a sweep width of 6 kHz. The residual periods were chosen to adequately sample the enrichment water (HDO) peak was suppressed with the application of curves based on the slower and faster rates expected in 10- a low power pre-saturation pulse (3 s).
and 30-day-old rat cortex, respectively. Arterial blood (100
ml) was withdrawn at these time points, immediately 2.5. Quantitation of spectra centrifuged, and the plasma was frozen in liquid nitrogen.
1
A portion of the plasma was used to measure glucose H spectra were processed by zero-filling to 32 K data
13
concentration (Beckman Glucose Analyzer II). At the end points. C enrichments were measured from spectra of the assigned infusion period, the cranium was frozen in processed with a mild Lorentzian-to-Gaussian filter (LB5 situ with liquid nitrogen and stored at 2908C for the 20.75, GB50.1) and zero and first order baseline correc-subsequent removal and extraction of the brain. Frozen tions. The fractional enrichments (FE) of glutamate-C4
brain tissue (|100 mg) was chipped from the fronto- (2.35 ppm), glutamate-C (2.13 ppm) and lactate-C (1.323 3
parietal cortex. ppm) were determined from the ratio of the peak heights of
13 12 13
the C-labeled resonances to the total ( C1 C) am-2.2. Preparation of cortical slices in vitro plitude of the respective metabolites. The concentration of cortical glutamate was determined for the in vivo group by Brain slices of 300-mm thickness were prepared from integration relative to a known concentration of TSP and
21
13
from the ratio of the C coupled satellites of glucose-C1 value of 1 / 2 FE of plasma glucose. Such dilution has no to the total intensity of the triplet centered at 5.2 ppm [5]. effect on the calculated value of VTCA, but would have a small effect on the calculated rate of oxygen consumption 2.6. Calculation of fluxes in the neocortex in vivo to the extent that such substrates replace glucose.
Metabol-21 21
ic fluxes were expressed asmmol g (wet weight) min . Cortical TCA cycle and glucose oxidation rates were
determined from the isotopic labeling of glutamate and 2.7. Kinetic parameters assumed in the calculation of lactate using a steady state metabolic modeling analysis metabolic rates
[26,27]. TCA cycle (VTCA) and a-ketoglutarate / glutamate
exchange (V ) were determined from a fit of the metabolicx The transport rate constants for glucose and lactate model shown in Fig. 1A to the group-averaged time between blood and brain were taken from the available courses of the glutamate-C and C enrichments, respec-4 3 literature for immature and mature rats. These rate con-tively. A Runge-Kutta method was used to solve the stants have not been reported for rats less than |14 days
differential equations, and best fits were determined by old. Therefore, the effects of uncertainties in the parameter iteration of parameters (VTCA, V ) using a simplex algo-x estimates on the calculated fluxes were assessed by a rithm. A physiologic and metabolic steady-state was sensitivity analysis (Appendix A). Brain glucose concen-assumed with respect to the pathways of glucose metabo- tration and fractional enrichment were calculated from the lism. Lactate enrichments in the plasma were fitted to a concentration and FE of plasma glucose using values for monoexponential equation and the resultant best-fit values glucose transport parameters most appropriate for the were used as input to the model. The additional flux term, particular ages studied. The Michaelis-Menten kinetic
V , represents the flow of any unlabeled carbon substratesdil parameters for cortical glucose and lactate transport re-into the TCA cycle through acetyl-CoA (e.g. ketone ported by Cremer [8] for |14–19-day-old brain were
bodies). The presence of such flows results in the steady- assumed in the analysis of the 10-day-old cortex (glucose:
21 21
state dilution of glutamate-C labeling and a reduction in4 Vmax50.52 mmol g min ; Km57.59 mM; KD50.021
21 21 21
the fractional enrichment (FE) from the maximum possible min ; lactate: Vmax51.95 mmol g min ; Km59.70
Fig. 1. Schematic representation of the metabolic models used to calculate TCA cycle flux from glutamate turnover in vivo (A) and in vitro (B). Plasma glucose (G ) and the intracellular glucose pool (G ) exchange according to the Michaelis-Menten kinetic constants, Kp i mand Vmax. Glucose carbon flows
21 21
through the intermediates of the glycolytic pathway at the rate 2 CMRGLU(mmol g min ) to pyruvate. Brain pyruvate and lactate are assumed to be in isotopic equilibrium and are treated in the analysis as a single pool. Lactate exchange between blood and brain was determined from the Michaelis-Menten
13
kinetic constants Km and Vmax and the plasma enrichment time course (data not shown). C label enters the TCA cycle as acetyl-CoA and labels
a-ketoglutarate at carbon 4 (a-KG ), which undergoes isotopic exchange with glutamate at carbon 4 (Glu ) in both the cytosolic and mitochondrial pools.4 4 The exchange among cytosolic and mitochondrial pools ofa-KG and glutamate are reduced to a single exchange rate (V ) between one grouped pool ofx
a-KG and one group pool of glutamate [27]. Glutamine is synthesized from glutamate at the rate V . The flux represented by Vgln glnreflects the cyclic flow through glutamine synthetase (glu→gln) and glutaminase (gln→glu). Unlabeled carbon enters the acetyl-CoA pool at the rate V . Continued flow of thedil
13 13
21
mM; KD50.079 min ). For 30-day-old rats, glucose random noise with the same Gaussian distribution as was transport parameters were assumed to be equal to adult observed in the original data. Each of the simulated sets values of the same species measured in a previous study was analyzed using the same fitting procedure as was [24] where Vmax/CMRGLU55.8 and Km513.9 mM. Lactate performed with the original data, and the 2000 sets of fitted transport kinetic parameters assumed for the 30-day-old parameters were recorded. The Monte-Carlo procedure cortex were based on those reported for adult rats by provided an estimate of the uncertainties in the fitted
21 21
Pardridge [39] (Vmax50.12mmol g min ; Km51.9 mM; parameters if the experiment were repeated 2000 times. To
21
evaluate the significance of differences in the fitted
param-KD50.028 min ).
eters between the 10- and 30-day-old groups, the 2000-row arrays of Monte-Carlo generated parameters were sub-2.8. Calculation of fluxes in brain slices
tracted one from the other, generating a 2000-row differ-ence array. The P-value was calculated as the fraction of Glycolytic and TCA cycle fluxes were determined using
the elements that lay above or below zero for each fitted the same steady state metabolic model but modified to
parameter. The sensitivity of the calculated value of VTCA
permit free communication between perfusate and the
to assumed parameters is given in Appendix A. extracellular space due to the absence of a blood–brain
The statistical significance of comparisons between barrier. Therefore glucose and lactate transport terms were
cortical metabolic rates in vivo and in slices were evalu-not included in the analysis. Injured cells at the surface of
ated by a pair-wise Z-test. the slice may have impaired their ability to aerobically
14
metabolize glucose. However, studies using C radio-isotope labeled substrates [15], have estimated that these
3. Results
cells make up less than 2% of the glutamate pool which
turns over slowly; therefore, this pool would be expected 13
3.1. Effects of [ C]glucose infusion on blood glucose to have a negligible contribution to glucose metabolism.
and lactic acid levels and their enrichments in10- and The TCA cycle flux (VTCA) was determined from an 30-day-old rats in vivo
analysis of the time courses of the enrichment of
glutamate-C as shown in Fig. 1B. In the construction of4 13
The intravenous infusion of [1- C]glucose increased the model we made the following assumptions:
intracellu-total plasma glucose concentrations and fractional isotopic lar glucose-C labeling reaches a steady state enrichment1 enrichments to similar and nearly constant levels in
of 99% at t50 (i.e. step function) and lactic acid leaving
animals of both age groups. Average plasma glucose levels the tissue (Vefflux) to the medium does not return, i.e. measured over the 60–90 min of the glucose infusion were
Vinflux50. Because no labeling was detected in glutamine, 9.261.4 mM in 10-day-old and 10.461.2 mM in
30-day-Vgln was set equal to zero. The values of V and thex old rats. The fractional enrichment of plasma glucose-C 1
concentration of total glutamate were assumed to be equal
was 0.4560.03 and 0.4160.02 in 10- and 30-day-old rats, to the values determined in vivo for the respective
postnat-respectively. al ages. The total glucose utilization was determined as the
Average plasma lactic acid was lower in the 10-day-old sum of the rates of glucose oxidation calculated from the
(1.9560.46 mM) compared to 30-day-old rats (2.7260.18 TCA cycle flux and 1 / 2 times the rate of lactate
appear-mM) but remained relatively constant throughout the ance in the perfusion medium. Lactate in the perfusion
labeled glucose infusion in each group. Blood lactate-C
21 3
medium was converted tommol g (wet weight) based on 13
was labeled rapidly from [1- C]glucose with average measured protein and wet tissue weights determined for
fractional enrichment values over the course of the
infu-21
both age groups (8069 mg g (n56, mean6S.D.) and
sion of 0.09660.033 and 0.06860.007 in the 10- and
21
106614 mg g (n56) wet weight for 10- and 30-day-old
30-day-old rats, respectively. cortex, respectively). Total protein weights in brain slices
were 3.561.2 mg (n517, mean6S.D.) and 4.460.7 mg
3.2. Rates of the TCA cycle and glucose oxidation in (n519) of protein for the 10- and 30-day-old tissue,
the 10- and 30-day-old cortex in vivo respectively.
13 13
[1- C]Glucose is metabolized to pyruvate- C which3
2.9. Error analysis enters the mitochondrial TCA cycle at the level of citrate
13
and quickly flows to a-ketoglutarate- C4 (Fig. 1). Be-A Monte-Carlo scatter analysis was used to determine causea-ketoglutarate is in exchange with the much larger the standard deviations of metabolic rates or other fitted cytosolic pool of glutamate, the label is trapped initially as
13
parameters derived from each group of data [24–26], and glutamate- C and with time other positions (C , C , and4 2 3
those standard deviations were used to evaluate statistical C ) will be labeled in subsequent turns of the TCA cycle.1
strongly age-dependent. Brain glutamate-C4 labeling reached a constant level within 15 min (FE511.062.3%) in the 30-day-old cortex, whereas a comparable enrichment (11.561.2%) was not observed until 90 min in the 10-day-old brain, despite similar plasma enrichments of glucose-C for rats in both age groups.1
13
The rate of C labeling of glutamate-C3 was slower than glutamate-C for rats in both age groups, as expected4
from previous studies in adult rats [13,27], but this too was age-dependent and considerably slower in 10-day-old as compared to the 30-day-old cortex.
The metabolic rates were determined by the best fit of the model (depicted in Fig. 1A) to the isotopic turnover of
13
glutamate-C4 and C3 during the [1- C]glucose infusion (Fig. 2). The TCA cycle flux (VTCA), which was calculated from the rate of glutamate-C turnover, increased 4.4-fold4 21
(P50.001) from 0.4660.12 to 2.0160.54 mmol g
21
min , in the 10- and 30-day-old cortex, respectively (Table 1). The calculated rate of cortical glucose oxidation,
CMRGLU( Ox), increased in nearly equal proportion (|
4.1-fold, P50.001) to the TCA cycle flux over the same
21 21
period, from|0.16 to|0.66 mmol g min ,
respective-ly. At isotopic steady state, the flow of unlabeled carbon through acetyl-CoA and into the TCA cycle is reflected as a dilution of the glutamate-C4 enrichment. The dilution flux (V ), when expressed as a percentage of Vdil TCA, was not significantly different between 10-day-old (28611%) and 30-day-old (3466%) rat cortex under the conditions of the glucose infusion. The most likely potential source(s) of the dilution of cortical glutamate labeling in vivo was oxidation of plasma lactic acid and ketone bodies. In
13
contrast to the rapid C labeling of plasma lactic acid, ketone bodies were not labeled by the glucose infusion.
13
The C labeling of glutamate involves the movement of
13
Fig. 2. C isotopic labeling of neocortical glutamate during an
intraven-the label from mitochondrial a-ketoglutarate to cytosolic
13
ous infusion of [1- C]glucose in 10- and 30-day-old rats. The ordinate
13 glutamate through isotopic exchanges mediated by
en-represents the concentration of neocortical glutamate- C (upper panel)4
13 zymes and transporters associated with the
malate-aspar-and glutamate- C (lower panel) at discrete times during the intravenous3 13
[1- C]glucose infusion for each age group. The continuous lines repre- tate shuttle. The rate of isotopic label exchange between
sent the best fit of the metabolic model (Fig. 1A) to the time course data. a-ketoglutarate and glutamate (V ), which is derived from x
Table 1
Metabolic rates in 10- and 30-day-old cortices
b
Vdilwas not significantly different for either age group. b
CMRGLU( Tot )5CMRGLU( Ox)11 / 2DLac /Dt. c
The concentration of glutamate in the brain slices was assumed to equal the concentration measured in vivo for the respective age group. *
Significantly different from 10-day-old slice, P,0.0005. **
Significantly different from 10-day-old cortex in vivo, P50.001. [
Significantly different from 10-day-old slice (P50.029, pair-wise Z-test). [[
a simultaneous fit of the model to the glutamate-C and C4 3 Metabolic fluxes were determined by fitting the metabol-data, differed greatly between the two age groups. Whereas ic model depicted in Fig. 1B to the glutamate-C enrich-4
the value of V in the 30-day-old cortex was fast,x .200 ment time course (Fig. 3). TCA cycle flux as derived from
13 21 21
the C isotopic turnover of glutamate (Table 1), was mmol g min , and similar to previous findings in adult
2-fold greater (P,0.0005) in 30-day-old slices (0.3460.02 rats [27], V was much less in the 10-day-old cortex, onlyx
21 21 21 21
mmol g min ) compared to 10-day-old slices
3.161.6 mmol g min . The slower a-ketoglutarate /
21 21
(0.1760.03mmol g min ). The percentage increase in glutamate exchange flux in the more immature brain may
glucose oxidation (200%) was similar to the increase in reflect reduced activity of the dicarboxylate carriers
associ-V between the two age groups. Labeling of glutamate-ated with the malate-aspartate shuttle, which transfers TCA
C was minimal over the 60–90-min perfusion period and redox equivalents from NADH in the cytosol to the 3
the sensitivity was not high enough for accurate quantita-mitochondria during respiration.
tion. The low enrichment in glutamate-C3 is consistent with the lower TCA cycle flux in the slice compared to the 3.3. Rates of the TCA cycle and glucose utilization in cortex in vivo.
10- and 30-day-old brain slices
3.4. Comparison of metabolic fluxes in the cortex in
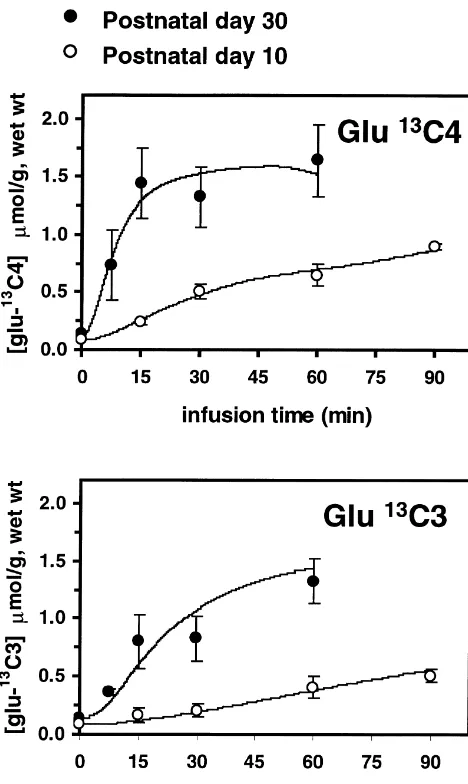
13 13
C label from [1- C]glucose was incorporated into
vivo and in brain slices in vitro
lactate-C3 and glutamate-C4 in both 10- and 30-day-old cortical slices. Rates of lactate production measured in the
TCA cycle rate was significantly different (6-fold great-perfusates were linear for 10- and 30-day-old slices over
er) in 30-day-old cortex of rats in vivo compared to the the measured 60–90-min interval with average values of
slice preparation in vitro (P50.002, pair-wise Z-test).
21 21
0.065 and 0.075mmol g min , respectively. In contrast
Although the TCA cycle rate was significantly different to lactate labeling, the time courses of glutamate-C4 between the 10-day-old cortex in vivo and the slice in vitro
labeling were hyperbolic for both age groups (Fig. 3). The
(P50.029), the difference between them was less (2.7-fold fractional enrichment of glutamate-C reached 0.3260.044
greater in vivo than in vitro) than at 30 days. and 0.3360.04 in the 10- and 30-day-old slices by 120
min, respectively, which was not significantly different from the enrichments at 90 min in either age group
(P50.09 and P50.90, respectively; two-tailed t-test). Thus 4. Discussion
the steady state glutamate enrichments for slices of both
postnatal ages show a substantial dilution of the labeled Our objective in this study was to compare TCA cycle glutamate from the maximum possible enrichment of 0.50. fluxes in vivo and in vitro using animals of the same postnatal ages, prepared as nearly the same as possible, and using an identical isotopic labeling method to measure flux in both preparations. Under these conditions, differ-ences in both absolute rates (in vivo verses in vitro at each age) and relative rates (age-dependent increase in vivo compared to in vitro) are more directly comparable.
TCA cycle flux and the rate of glucose utilization increased over 4-fold in the rat neocortex in vivo between 10 and 30 days after birth. The magnitude of the de-velopmental increase in TCA cycle flux in vivo is in good agreement with other indirect estimates of oxygen
1
consumption . In contrast only a 2-fold increase was observed in the cortical slice over the same postnatal
1
Values of CMRO 2have not been reported for neonatal rats but can be estimated from reported rates for high energy phosphate (|P) utilization 21 21 during complete ischemia.|P utilization is 2.6–3.6mmol|P g min
21 21
for 7-day-old and 27.6–28 mmol |P g min for adult rats
[12,36,47,51]. Assuming a P:O of 1.5 for the 7-day-old rat brain [16,30] 13
Fig. 3. C isotopic labeling of glutamate in cortical slices of 10- and and 3 for the adult [31,38], the estimated rate of O consumption would2 21 21
30-day-old rats during superfusion of artificial CSF containing [1- be 0.86–1.2mmol g min in 7-day-old rat cortex and 4.6–4.7mmol
13 13 21 21
C]glucose. The ordinate represents the concentration of glutamate- C4 g min in the adult cortex. Considering the relationship CMRO 2(3 13
brain during postnatal development in contrast to the marked heterogeneity of glucose metabolism [35] in functionally activated regions, suggests that glucose has an obligatory role in the functional development of sensory-metabolic coupling in the neocortex.
The increasing difference in oxidative glucose metabo-lism between the cortical slice in vitro and the cortex in vivo that occurs during development may be related to the increase in glucose utilization observed during functional maturation of the nervous system. Glucose and oxygen consumption of the resting brain slice can be viewed as the energy production needed to maintain ion gradients due to spontaneous, resting activity as the slice is lacking signifi-cant sensory input. Whereas the 30-day-old cortex general-ly has a mature density and pattern of synapses, ion channels, EAA receptors and transporters, the 10-day-old cortex does not [1,28]. For example, in rat brain slices
Fig. 4. Comparison of the rates of glucose oxidation (TCA cycle flux)
between 10- and 30-day-old neocortex in vivo and cortical slices in vitro. glutamate and potassium-evoked increases in oxygen
A much greater increase in TCA cycle flux occurs in the neocortex in utilization do not appear before postnatal day 10 [37,48], vivo than in brain slices between 10 and 30 postnatal days.
which is in accord with in vivo studies showing the appearance of increased 2-DG uptake (and glucose utiliza-period (Fig. 4). TCA cycle fluxes were significantly lower tion) in sensory systems as they ‘mature’ between postnatal (P,0.01) in the slice than in vivo, 37% (0.17 / 0.463100) day 13 and 18 [34]. On the basis of labeling studies using
13 15
at 10 days and 17% (0.34 / 2.03100) at 30 days of the C and N isotopes, we recently presented evidence in respective in vivo values. The 2-fold increase in glucose the mature rat cortex in vivo that a linear relationship oxidative metabolism of cortical slices between 10 and 30 exists between glucose oxidative metabolism and the days is similar in magnitude to the increase in mito- glutamate / glutamine neurotransmitter cycle between neu-chondrial and glycolytic enzyme activities that occurs in rons and astrocytes [44]. It remains to be seen whether a the same postnatal period [2,20,21]. It is unlikely that similar mechanism explains the differences observed be-ketone bodies, assumed to be present in vivo but not in tween slices and the in vivo measurements. If the rate of vitro, were responsible for the higher TCA cycle fluxes glucose oxidation in the cortical slice is taken as a observed in vivo. The steady-state TCA cycle flux as maximum estimate for neocortex devoid of normal sensory determined from glutamate isotopic turnover reflects total afferents, then 37% [(0.17 / 0.46)3100] of glucose oxida-flux and therefore, does not ignore unlabelled flows, e.g. tion in 10-day-old cortex in vivo is devoted to processes ketone bodies, although utilization of ketone bodies may other than synaptic activity. This percentage is decreased account for all or part of the dilution observed in to at most 17% [(0.34 / 2.01)3100] in the 30-day-old glutamate-C4 labeling [27]. In addition, ketone bodies cortex. The actual value is probably lower due to a greater would be expected to contribute more to respiration of the frequency of spontaneous activity in mature compared to 10- than the 30-day-old brain [32,34]. However, the largest immature brain slices. Our previous work has supported difference between in vitro and in vivo metabolic rates was this interpretation. The TCA cycle flux is reduced to|10%
21 21
observed in the 30-day-old cortex where ketone utilization (0.16mmol g min ) of the adult cortex under nitrous would be expected to be much less. Although we did not oxide anesthesia [27] during high dose pentobarbital measure ketone body utilization in the current study, it was sufficient to produce an isoelectric EEG [44], a rate similar possible to estimate the maximum contribution of ketones to that measured in the cortical slices. Therefore our to oxygen consumption by assuming that the dilution of findings suggest that by postnatal day 30, at least 83% of glutamate-C4 arose entirely from ketones. Based on this resting cortical oxidative metabolism is associated with assumption, under the current experimental conditions, at synaptic activity.
Acknowledgements mate labeling but does not influence VTCA [27]. On the
13
other hand, inflow of C-labeled lactate from blood This work was supported by NIH grants HD32573, cannot be distinguished from intracellular metabolism of
NS28790, and DK27121. the labeled glucose and will influence VTCA depending on
the exchange rate. Gluconeogenesis is robust in the immature rat leading to rapid labeling of blood lactate-C3
13
Appendix A. Sensitivity of calculated fluxes to from glucose-C1 [14]. Uncertainty in the inflow of
C-parameter estimates labeled lactate in the immature brain can be expected to lead to uncertainty in VTCA. When the value for lactate The sensitivity of the calculated TCA cycle fluxes to transport (VLin) was allowed to vary from zero (i.e. a certain parameters assumed to be constant in the analysis non-physiological limit) to twice the assumed value, the but imprecisely known for the immature brain was as- percentage change in VTCAchanged from181% to17.9%, sessed numerically. The effects of intracerebral glucose respectively, the latter value being reflective of the faster turnover time, blood / brain lactate exchange, and gluta- transport rates expected for lactate in the immature com-mate / glutamine cycling on the calculated TCA cycle flux pared to the mature cortex. As expected, the effects on were evaluated by varying each parameter singly while VTCAof the 30-day-old cortex were small, only 12.6% to
holding the others constant. 21.5% over the same percentage range of VLin.
A.1. Rate of intracerebral glucose turnover A.3. Glutamate /glutamine cycling flux
1
The intracerebral glucose pool requires a finite time to Glutamine could not be accurately measured in H reach isotopic steady state with plasma glucose during the spectra in the present study. We have shown previously labeled glucose infusion and is reflected as a delay in the that neglect of glutamine labeling from glutamate leads to appearance of the isotopic label in glutamate [27]. If not underestimation of the value of VTCA, depending on the considered, this delay will lead to an underestimation of rate of glutamine synthesis [27]. In the present study, Vgln
21 21
VTCA. Cortical glucose transporter density and rates of was assumed to be 0.25 mmol g min [43] for both glucose utilization are lower in the neonate than the adult postnatal age groups; this value overestimates Vgln in the cortex [34], which can be expected to lengthen the 10-day-old cortex and therefore, can be considered an turnover time of the intracerebral glucose pool (t1 / 2). The upper estimate. Values of VTCA were calculated by varying value of t1 / 2 in unanesthetized adult rat cortex is |1 min the rate of glutamate / glutamine cycling over a range from
21 21
[42]. When the value of t1 / 2 was allowed to vary between zero to the adult rate of 0.25 mmol g min . The zero (i.e. instantaneous turnover) and 2 min (twice the percentage error in VTCA due to overestimating Vgln in the turnover time of mature cortex), the percentage error in 10-day-old brain was at most 9.1% in the worst case where
VTCA for the 10-day-old cortex varied from 16% to Vgln50. 20.9%. The effect of a longer intracerebral glucose
turnover time on the calculated value of VTCAin 10-day-old A.4. Ketone body utilization cortex is therefore negligible. Thus, the much slower rate
of glutamate labeling and TCA cycle flux in the 10-day-old Provided plasma ketone bodies are not labeled during
13
cortex is unlikely to be related to reduced glucose transport the [ C]glucose infusion and a metabolic steady state (and lower transporter density). Even if glucose transporter prevails, their utilization will not influence the calculated density were limiting glucose phosphorylation, lactic acid value for the TCA cycle flux but will influence the rate of appears to be a readily available fuel at this period of oxygen consumption calculated from the TCA cycle flux development [11,49,50] as long as lactate permeability [27]. For example, under conditions in which glucose (or remains high (see below). Although an increase in glucose lactic acid) and ketone bodies comprise the only fuel transporter density may be required to sustain the large sources and undergo complete oxidation, the TCA cycle increase in glucose oxidation observed between 10 and 30 flux is related stoichiometrically to oxygen consumption postnatal days, it does not appear that glucose transport, according to the following equation: CMRO 53 VPDH1
2
per se, is limiting TCA cycle flux at either age. 2.25 VHB12 V , where VAA PDH is the influx of pyruvate into the TCA cycle, VHB is the influx from 3-hydroxybutyrate,
A.2. Rate of lactate transport and VAA is the influx from acetoacetate [27]. Under these
conditions, oxidation of unlabeled ketone bodies (or any The exchange of lactate (and pyruvate) between blood unlabeled substrate) would lead to a dilution in the steady-and brain is high at birth steady-and steadily declines over the first state enrichment of glutamate-C compared to what would4
maturation of creatine kinase in rat brain, Dev. Neurosci. 15 (1993)
glucose FE) represents the maximum possible contribution
261–270.
from ketone bodies. Assuming the total dilutions observed
[18] C. Jiang, S. Agulian, G.G. Haddad, O tension in adult and neonatal2
in glutamate-C4 in 10-day-old cortex arose from ketone brain slices under several experimental conditions, Brain Res. 568
utilization, calculated CMRO2 would decrease at most by (1991) 159–164.
21 21 1 [19] S. Kawai, M. Yonetani, H. Nakamura, Y. Okada, Effects of
depriva-17% in 10-day-old (from 1.2 to 1.0mmol g min ) . A
tion of oxygen and glucose on the neural activity and the level of
comparable calculation for the 30-day-old cortex would
high energy phosphates in the hippocampal slices of immature and
reduce calculated CMRO2 by 4% (from 5.4 to 5.2 mmol adult rat, Brain Res. Dev. Brain Res. 48 (1989) 11–18.
21 21
g min ); however, ketone utilization would not be [20] S.F. Leong, J.B. Clark, Regional enzyme development in rat brain. Enzymes associated with glucose utilization, Biochem. J. 218
expected to be the major source of the dilution at this age.
(1984) 131–138.
[21] S.F. Leong, J.B. Clark, Regional enzyme development in rat brain. Enzymes of energy metabolism, Biochem. J. 218 (1984) 139–145. [22] P. Lipton, T.S. Whittingham, Energy metabolism and brain slice
References
function, in: R. Dingledine (Ed.), Brain Slices, Plenum, New York, 1984, pp. 113–153.
[1] G.K. Aghajanian, F.E. Bloom, The formation of synaptic junctions [23] O.H. Lowry, J.V. Passonneau, A Flexible System of Enzymatic in developing rat brain: a quantitative electron microscopic study, Analysis, Academic Press, New York, 1972.
Brain Res. 6 (1967) 716–727. [24] G.F. Mason, K.L. Behar, D.L. Rothman, R.G. Shulman, NMR [2] A. Almeida, K.J. Brooks, I. Sammut, J. Keelan, G.P. Davey, J.B. determination of intracerebral glucose concentration and transport Clark, T.E. Bates, Postnatal development of the complexes of the kinetics in rat brain, J. Cereb. Blood Flow Metab. 12 (1992) electron transport chain in synaptic mitochondria from rat brain, 448–455.
Dev. Neurosci. 17 (1995) 212–218. [25] G.F. Mason, W.J. Chu, G.M. Pohost, H.P. Hetherington, A general [3] N. Auestad, R. Fisher, F. Chiappelli, R.A. Korsak, J. Edmond, approach to numerically optimized design of experiments: applica-Growth and development of brain of artificially reared hypo- tion to multi-slice tissue segmentation via T1 imaging in human ketonemic rat pups, Proc. Soc. Exp. Biol. Med. 195 (1990) 335– brain, J. Magn. Reson. 126 (1997) 18–29, Correction for publisher’s
344. error in Vol. 126, no. 2.
[4] T.E. Bates, A. Almeida, S.J. Heales, J.B. Clark, Postnatal develop- [26] G.F. Mason, R. Gruetter, D.L. Rothman, K.L. Behar, R.G. Shulman, ment of the complexes of the electron transport chain in isolated rat E.J. Novotny, Simultaneous determination of the rates of the TCA brain mitochondria, Dev. Neurosci. 16 (1994) 321–327. cycle, glucose utilization, alpha-ketoglutarate / glutamate exchange, [5] K.L. Behar, O.A. Petroff, J.W. Prichard, J.R. Alger, R.G. Shulman, and glutamine synthesis in human brain by NMR, J. Cereb. Blood
13
Detection of metabolites in rabbit brain by C NMR spectroscopy Flow Metab. 15 (1995) 12–25. 13
following administration of [1- C]glucose, Magn. Reson. Med. 3 [27] G.F. Mason, D.L. Rothman, K.L. Behar, R.G. Shulman, NMR (1986) 911–920. determination of the TCA cycle rate and alpha-ketoglutarate / gluta-[6] S. Berl, Metabolic compartmentation in developing brain, in: W. mate exchange rate in rat brain, J. Cereb. Blood Flow Metab. 12
Himwich (Ed.), Biochemistry of the Developing Brain, Marcel (1992) 434–447.
Dekker, New York, 1973, pp. 219–252, Chapter 6. [28] J.W. McDonald, M.V. Johnston, Physiological and pathophysiologi-[7] H.T. Chugani, M.E. Phelps, J.C. Mazziotta, Positron emission cal roles of excitatory amino acids during central nervous system
tomography study of human brain functional development, Ann. development, Brain Res. 15 (1990) 41–70.
Neurol. 22 (1987) 487–497. [29] M.W. Miller, Maturation of rat visual cortex III. Postnatal mor-[8] J.E. Cremer, V.J. Cunningham, W.M. Pardridge, L.D. Braun, W.H. phogenesis and synaptogenesis of local circuit neurons, Dev. Brain
Oldendorf, Kinetics of blood–brain barrier transport of pyruvate, Res. 25 (1986) 271–285.
lactate and glucose in suckling, weanling and adult rats, J. Neuro- [30] J.M. Milstein, J.G. White, K.F. Savaiman, Oxidative phosphoryla-chem. 33 (1979) 439–445. tion in mitochondria of developing rat brain, J. Neurochem. 15 [9] P.M. Daniel, E.R. Love, O.E. Pratt, The effect of age upon the influx (1968) 411–415.
of glucose into the brain, J. Physiol. 274 (1978) 141–148. [31] C.L. Moore, P.M. Strasberg, in: A. Lajtha (Ed.), Handbook of [10] L. Deza, E. Eidelberg, Development of cortical electrical activity in Neurochemistry, Vol. 3, Plenum, New York, 1970, pp. 53–79.
the rat, Exp. Neurol. 16 (1967) 425–438. [32] A. Nehlig, Respective roles of glucose and ketone bodies as [11] G.J. Dombrowski, K.R. Swiatek, K.-L. Chao, Lactate, 3-hydroxy- substrates for cerebral energy metabolism in the suckling rat, Dev.
butyrate, and glucose as substrates for the early postnatal rat brain, Neurosci. 18 (1996) 426–433.
Neurochem. Res. 14 (1989) 667–675. [33] A. Nehlig, S. Boyet, A.P. de Vasconcelos, Autoradiographic mea-[12] T.E. Duffy, S.J. Kohle, R.C. Vannucci, Carbohydrate and energy surement of local cerebral b-hydroxybutyrate uptake in the rat metabolism in perinatal rat brain: relation to survival in anoxia, J. during postnatal development, Neuroscience 40 (1991) 871–878. Neurochem. 24 (1975) 271–276. [34] A. Nehlig, A.P. de Vasconcelos, Glucose and ketone body utilization [13] S.M. Fitzpatrick, H.P. Hetherington, K.L. Behar, R.G. Shulman, The by the brain of neonatal rats, Prog. Neurobiol. 40 (1993) 163–221. flux from glucose to glutamate in the rat brain in vivo as determined [35] A. Nehlig, A.P. de Vasconcelos, S. Boyet, Quantitative
autoradiog-1 13
by H-observed, C-edited NMR spectroscopy, J. Cereb. Blood raphic measurement of local cerebral glucose utilization in freely Flow Metab. 10 (1990) 170–179. moving rats during postnatal development, J. Neurosci. 8 (1988) [14] M.K. Gaitonde, D. Richter, Changes with age in the utilization of 2321–2333.
glucose carbon in liver and brain, J. Neurochem. 13 (1966) 1309– [36] B. Nilsson, K. Norberg, C.-H. Nordstrom, B.K. Seisjo, Rate of 1316. energy utilization in the cerebral cortex of rats, Acta Physiol. Scand. [15] D. Garfinkel, J.W. London, L. Dzubow, W.J. Nicklas, Computer 93 (1976) 569–571.
simulation of the metabolism of guinea pig brain slices, and how [37] K. Okamoto, J.H. Quastel, Water uptake and energy metabolism in they differ from the intact brain, Brain Res. 92 (1975) 207–218. brain slices from the rat, Biochem. J. 120 (1970) 25–36. [16] D. Holtzman, C.L. Moore, Oxidative phosphorylation in immature [38] K. Ozawa, K. Seta, H. Takeda, K. Ando, H. Handa, C. Araki, On
[39] W.M. Pardridge, W.H. Oldendorf, Transport of metabolic substrates energy metabolism in the nervous system, Dev. Neurosci. 15 (1993) through the blood–brain barrier, J. Neurochem. 28 (1977) 5–12. 194–206.
[40] A.J. Patel, R. Balazs, Manifestation of metabolic compartmentation [46] L. Sokoloff, Energetics of functional activation in neural tissues, during the maturation of the rat brain, J. Neurochem. 17 (1970) Neurochem. Res. 24 (1999) 321–329.
955–971. [47] D.F. Swaab, K. Boer, The presence of biologically labile compounds [41] L. Pellerin, P. Magistretti, Glutamate uptake into astrocytes stimu- during ischemia and their relationship to the EEG in rat cerebral
lates aerobic glycolysis: a mechanism coupling neuronal activity to cortex and hypothalamus, J. Neurochem. 19 (1972) 2843–2853. glucose utilization, Proc. Natl. Acad. Sci. USA 91 (1994) 10625– [48] G. Takagaki, Developmental changes in glycolysis in rat cerebral
10629. cortex, J. Neurochem. 23 (1974) 479–487.
[42] H.E. Savaki, L. Davidsen, C. Smith, L. Sokoloff, Measurement of [49] J.H. Thurston, R.E. Hauhart, J.A. Schiro, Lactate reverses insulin-free glucose turnover in brain, J. Neurochem. 35 (1980) 495–502. induced hypoglycemic stupor in suckling-weanling mice: biochemi-[43] N.R. Sibson, A. Dhankhar, G.F. Mason, K.L. Behar, D.L. Rothman, cal correlates in blood, liver, and brain, J. Cereb. Blood Flow Metab.
13
R.G. Shulman, In vivo C NMR measurements of cerebral 3 (1983) 498–506.
glutamine synthesis as evidence for glutamate-glutamine cycling, [50] R.C. Vannucci, T.E. Duffy, Carbohydrate metabolism in fetal and Proc. Natl. Acad. Sci. USA 94 (1997) 2699–2704. neonatal rat brain during anoxia and recovery, Am. J. Physiol. 230 [44] N.R. Sibson, A. Dhankhar, G.F. Mason, D.L. Rothman, K.L. Behar, (1976) 1269–1275.

![Fig. 3.13C isotopic labeling of glutamate in cortical slices of 10- and30-day-old rats during superfusion of artificial CSF containing [1-13C]glucose](https://thumb-ap.123doks.com/thumbv2/123dok/3136713.1382215/6.612.49.286.469.662/isotopic-labeling-glutamate-cortical-superfusion-articial-containing-glucose.webp)