www.elsevier.com/locate/eja
Intercropping corn with soybean, lupin and forages:
yield component responses
K. Carruthers, B. Prithiviraj, Q. Fe, D. Cloutier, R.C. Martin, D.L. Smith *
Department of Plant Science, Macdonald Campus, McGill University, 21, 111 Lakeshore, Ste. Anne-de-Bellevue, Que., Canada
Accepted 20 September 1999
Abstract
Intercropping systems influence yield variables of the component crops, such as harvest index, hundred seed weight, number of reproductive organs and number of seeds, within each reproductive unit. Two experiments were carried out at each of two sites during 1993 and 1994. The first experiment investigated the effects of seeding soybean or lupin alone or in combination with one of three forages (annual ryegrass,Lolium multiflorumLam.; perennial ryegrass,
Lolium perenneL.; red clover,Trifolium pratenseL.) with corn on the yield components of corn, soybean and lupin. The second experiment examined the effects of seeding date (simultaneous with corn or 3 weeks later) and number of rows of large seeded legumes (one or two) seeded between the corn rows. Corn grain yield was generally not affected by any intercrop treatment, although in 1993 some simultaneously seeded treatments resulted in decreased yields. Soybean grain yield was decreased by most treatments, although some simultaneous seedings produced yields similar to soybean monocrops. Lupin grew poorly as an intercrop component, producing little or no grain. Corn harvest index was not affected by any intercrop treatments. Seeding corn and large-seeded legumes simultaneously resulted in decreases in corn hundred seed weights by as much as 6.6 g compared with the monocropped corn. In 1993 (a year with normal precipitation levels), the hundred seed weight and number of seeds per soybean pod were decreased by intercropping, although the harvest index was not affected. In a high precipitation year (1994), the soybean harvest index was decreased by intercropping, but not the seed components. The underseeded forages, annual ryegrass, perennial ryegrass and red clover, had no effect on yields or yield components of the other intercropped species. © 2000 Elsevier Science B.V. All rights reserved.
Keywords:Corn; Forages; Intercropping; Silage; Soybean; Yield components
1. Introduction nations of certain crops result in increased
compe-tition among the components. This results in
Intercropping is used in many parts of the world reduced yields, which may make some crop species
for the production of food and feed crops. In unsuitable for intercropping. Increased
competi-general, intercropping has been shown to be more tion may be for water, nutrients, light or any
productive than monocropping. However, combi- combination of the three, ultimately leading to
changes in crop productivity levels. Changes in crop development can be examined by
investigat-* Corresponding author. Tel.:+1-514-398-7851;
ing the manner in which yield components are
fax:+1-514-398-7897.
E-mail address:[email protected] (D.L. Smith) affected by alterations in cropping pattern. For
example, the harvest index (HI ) indicates the 2. Materials and methods amount of plant biomass allocated to grain, thus
2.1. Experiment 1
providing an indication of the ability with which the plant partitions resources between vegetative
This experiment investigated the effects of
inter-and reproductive structures ( Fukai inter-and Trenbath,
cropping silage corn with large-seeded legumes 1993). The hundred seed weight (HSW ) gives an
and forage crops on silage yield and quality. This indication of the ability of the plant to meet sink
field study was carried out in 1993 and 1994 at the demands during grain filling and can be increased
E. Lods Agronomy Research Centre, on the by the removal of various stresses, e.g. irrigation
Macdonald Campus of McGill University
where water is limiting (Claassen and Shaw, 1970;
(Macdonald ), and the L’Assomption field station Putnam et al. 1992).
of Agriculture and Agri-Foods Canada
Intercrop systems may improve yield stability,
(L’Assomption). The two sites are 80 km apart. allowing more consistent yields ( Willey, 1979;
The Macdonald experiment was performed on Horwith, 1985; Fukai and Trenbath, 1993), and
soils consisting of a mixture of Chateauguay clay
efficient use of the resources, allowing reductions
(fine loamy, mixed, nonacid, frigid, Gapludalf in costly inputs ( Keatings and Carberry, 1993;
1993) and St. Bernard clay (fine loamy, mixed, Morris and Garrity, 1993ab).
nonacid, frigid, Eutrochrept 1994), whereas the Cereal–legume intercrops are among the most
L’Assomption study was performed on a Soulange frequently used and most productive (Ofori and
loam (fine silty, mixed, nonacid, frigid,
Stern, 1987a). Corn–soybean intercrops have been
Humaquept). Prior to experimentation, soil tests shown to be more productive than corn monocrops
showed a pH of 6.6 for the L’Assomption site and (Ahmed and Rao, 1982; Putnam et al., 1985;
5.1 for the Macdonald site. Agricultural limestone Marchiol et al., 1992). The soybean component
at 6 t ha−1 was applied to raise the pH at the
adds valuable nitrogen to the soil (Singh et al.,
Macdonald site. The soil was harrowed 7 days 1986), and improves overall protein content of the
before planting, after which lime and
resulting silage (Herbert et al., 1984; Martin et al.,
90 kg ha−1, 100 kg ha−1, and 140 kg ha−1of N, P
1990). Further, this intercrop system reduces weed
and K respectively were broadcast and disked in growth ( Tripathi and Singh, 1983; Weil and
to produce a smooth seed bed. Corn monocrop McFadden, 1991; Carruthers et al., 1998), allowing
plots received an extra 90 kg ha−1 of nitrogen,
reductions in herbicide use. Several reports on hand broadcast 2 weeks after corn seeding, to give
corn–soybean intercrops exist in the literature. a total of 180 kg ha
−1 in each of these plots
However, other potential cereal–legume intercrop- (Martin et al., 1990). In 1992 the Macdonald site
ping systems, such as corn–lupin, have not been was fallow and the L’Assomption site was pasture.
studied in detail. Further, there are very few The experiment was established in a randomized
reports on corn intercropping along with complete block design with four blocks. Individual
underseeded forages. treatment plots measured 3×7 m2(Table 1). Corn,
Two experiments were carried out to investigate large-seeded legumes, and forage monocrops were
how intercropping corn with soybean or lupin simultaneously seeded in mid May ( Table 2). The
affected their yield components. The first experi- corn hybrid was changed in 1994 to one that was
ment examined the effect of interseeding one of slightly shorter in stature to allow better growth
the large-seeded legumes alone or in combination of the other intercrop components. The annual
with each of three forages (annual ryegrass,Lolium ryegrass was replaced by a mixture of perennial
multiflorumLam.; perennial ryegrass, Lolium per- ryegrass and red clover in 1994. Corn was planted
enne L.; red clover, Trifolium pratense L.). The in four rows, 75 cm apart, in each plot with a John
second experiment explored the effect of seeding Deere seeder (model Max Emerge2 2700) at
the large-seeded legumes simultaneously with corn, L’Assomption and a Gaspardo seeder (SP 510,
or 3 weeks after the corn and in one or two rows Pordenone, Italy) at Macdonald. The large-seeded
Table 1
Treatments applied in experiment number 1 (both 1993 and 1994)
Treatment Cropping system Description
Corn Monocrop Corn — herbicide control
Soybean Monocrop Soybean-monocrop
Lupin Monocrop Lupin-monocrop
CS Intercrop Corn+soybean
CL Intercrop Corn+lupin
CAnn (mix) Intercrop Corn+annual ryegrass (1993) or mixture (1994)
CPer Intercrop Corn+perennial ryegrass
CRed Intercrop Corn+red clover
CSAnn Intercrop Corn+soybean+annual ryegrass (1993) or mixture (1994)
CSPer Intercrop Corn+soybean+perennial ryegrass
CSRed Intercrop Corn+soybean+red clover
CLAnn (mix) Intercrop Corn+lupin+annual ryegrass (1993) or mixture (1994)
CLPer Intercrop Corn+lupin+perennial ryegrass
CLRed Intercrop Corn+lupin+red clover
CWeed Monocrop Corn — unweeded control
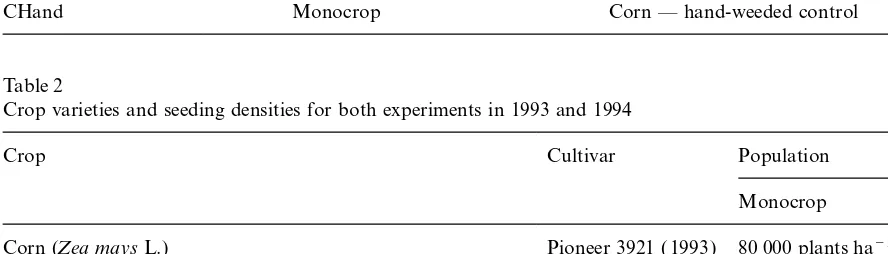
CHand Monocrop Corn — hand-weeded control
Table 2
Crop varieties and seeding densities for both experiments in 1993 and 1994
Crop Cultivar Population
Monocrop Intercrop
Corn (Zea maysL.) Pioneer 3921 (1993) 80 000 plants ha−1 80 000 plants ha−1
Pioneer 3917 (1994) 80 000 plants ha−1 80 000 plants ha−1
Soybean (Glycine maxL.) Maple Glen 250 000 plants ha−1
Lupin (Lupinus albusL.) Amiga 250 000 plants ha−1
Annual ryegrass (Lolium multiflorumLam.) Marshall (1993) 10 kg ha−1
Perennial ryegrass (Lolium perenneL.) Linn 13 kg ha−1
Red clover (Trifolium pratenseL.) Khunn 25 kg ha−1
Mixture of perennial ryegrass and red clover Linn and Khunn 6 kg ha−1+15 kg ha−1
apart in monoculture plots. In intercrop plots one Prior to seeding the large-seeded legume
monocrops in 1994 each plot received Dual row of large-seeded legumes was seeded between
each corn row, using a Planet Jr hand seeder (Metolachlor) and Lorox (Linuron) [3-(3,
4-dichlorophenyl )-1-methoxy,1-methylurea] at
(model 300A, Allen and Company, Philadelphia,
USA). All legumes (soybean, lupin and red clover) 2 l ha−1 and 2.1 l ha−1 respectively applied with
a bicycle-wheel plot sprayer. After two
cultiva-were inoculated with their appropriate (Brady)
Rhizobium strains using commercial inoculants tions using a Rabewerk cultivator (Rabewerk Machinerie Agricole, St.-Cesaire, Canada) (1993) or (Lipha Tech, Wisconsin, USA) prior to seeding.
Prior to seeding in 1993 and 1994, the corn mono- a rotary hoe cultivator (Colpron, Montreal, Canada)
(1994) and 3 weeks after corn seeding, intercropped crop received a combination of Dual (Metolachlor)
[2-chloro-N-(2-ethyl-6-methylphenyl )-N-(2-methoxy- forages were hand broadcast throughout the plots.
Forages were included to provide improved weed 1-methylethyl ) acetamide] and atrazine
[6-chloro-N-ethyl-N∞-(1-methylethyl)-1,3,5-triazine-2,4-dia- control and contribute organic matter to the soil.
Average monthly rainfalls and temperatures for each
mine] at a rate of 1.9 l ha−1and 1.0 l ha−1
Table 3
Monthly precipitation and average temperatures recorded at the Macdonald and L’Assomption sites during the 1993 and 1994 growing seasons
Year Precipitation (mm) Temperature (°C )
May June July August September Total May June July August September
Macdonald
1993 79.1 74.8 94.6 57.2 119.2 424.9 13.3 17.6 21.4 20.5 13.9
1994 148 194 61.3 99.9 105.5 607.8 12.1 18.9 21.3 18 14.3
Averagea 70.6 88.3 89.7 92.6 97.9 439.1 13.1 18.1 21.1 19.8 14.7
L’Assomption
1993 95.6 74.2 75.4 95.6 89.1 429.9 12.7 17.4 20.7 20.3 13.6
1994 93.8 285.9b 122.8 67.8 121.6 691.9 11.8 19.3 21 19.2 14.7
Averagea 72.5 87 84.5 94.4 84.6 423 12.3 17.5 20.2 18.8 13.8
a30 year averages.
bFlooding occurred.
During the season, plant heights were measured determine pod number per plant and seed number
per pod. These values were averaged to provide at approximately 2 week intervals for the corn and
legume species. In October, hand harvesting of yield values on a per plot basis. All grain was
weighed in 100 seed groups to determine the HSW. corn and legumes was done in the middle rows of
the plots in order to avoid border effects. Corn The number of kernels per cob was determined by
dividing grain yield by the average weight per seed was harvested from the middle 2 m (1993) or 3.5 m
(1994) of the two centre rows, the legumes from and then dividing by the number of cobs harvested.
Land equivalence ratio (LER) was calculated the middle 3 m (1993) or 3.5 m (1994) of the
centre two rows in intercrops or centre four rows according to method described by Mead (1986).
in monocrop. Grain was separated using a combine
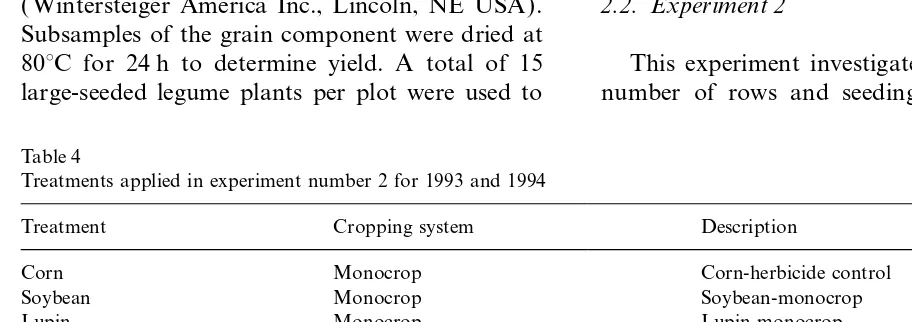
( Wintersteiger America Inc., Lincoln, NE USA). 2.2. Experiment 2
Subsamples of the grain component were dried at
80°C for 24 h to determine yield. A total of 15 This experiment investigated the effects of the
number of rows and seeding date of the inter-large-seeded legume plants per plot were used to
Table 4
Treatments applied in experiment number 2 for 1993 and 1994
Treatment Cropping system Description
Corn Monocrop Corn-herbicide control
Soybean Monocrop Soybean-monocrop
Lupin Monocrop Lupin-monocrop
CS1S Intercrop Corn+1 row of soybean simultaneously seeded
CS2S Intercrop Corn+2 rows of soybean simultaneously seeded
CS1D Intercrop Corn+1 row of soybean delay seeded by 3 weeks
CS2D Intercrop Corn+2 rows of soybean delay seeded by 3 weeks
CL1S Intercrop Corn+1 row of lupin simultaneously seeded
CL2S Intercrop Corn+2 rows of lupin simultaneously seeded
CL1D Intercrop Corn+1 row of lupin delay seeded by 3 weeks
CL2D Intercrop Corn+2 rows of lupin delay seeded by 3 weeks
Cweed Monocrop Corn — unweeded control
cropped large-seeded legumes on silage yield com- using the log(x+1) transformation prior to analy-sis. LER was calculated according to method ponents. Seedbed preparation and seeding were
the same as for the previous experiment. The described by Mead (1986).
treatments applied in the experiment are detailed in Table 4. When legumes were seeded in two rows
in intercrop plots an intercrop density of 250 000 3. Results and discussion
plants ha−1was used in 1993, whereas a monocrop
density of 500 000 plants ha−1 was used in Any further discussion on yield will refer only
to the intercrop treatments relative to the herbi-intercrop plots in 1994. Also, before the delayed
seeding of large-seeded legumes 3 weeks after corn cide-treated corn, except where specifically stated.
Large-seeded legumes will be referred to as
in 1994, an additional cultivation using a
Kongskilde ( VRC, Montreal, Canada) cultivator ‘legumes’ throughout the rest of this paper.
was added to improve monocotyledonous weed
control. 3.1. Experiment 1
All data were analysed using analysis of
vari-ance with the GLM procedure of the Statistical 3.1.1. Corn
Corn grain yield was not affected by any of the
Analysis System (SAS Institute, 1985).
Probabilities equal to or less than 0.05 were consid- treatments applied in this experiment ( Tables 5–
8). Other corn variables examined, such as HI, ered significant. If analysis of variance indicated
differences between treatment means a least sig- HSW, and number of kernels per cob were also
not affected by the various treatments. Corn plant
nificant difference (LSD) test was used to separate
the treatment means. Data for grain and biomass height was measured over the season and did not
differ between monocrop and intercrop systems at
yield of large-seeded legumes were transformed
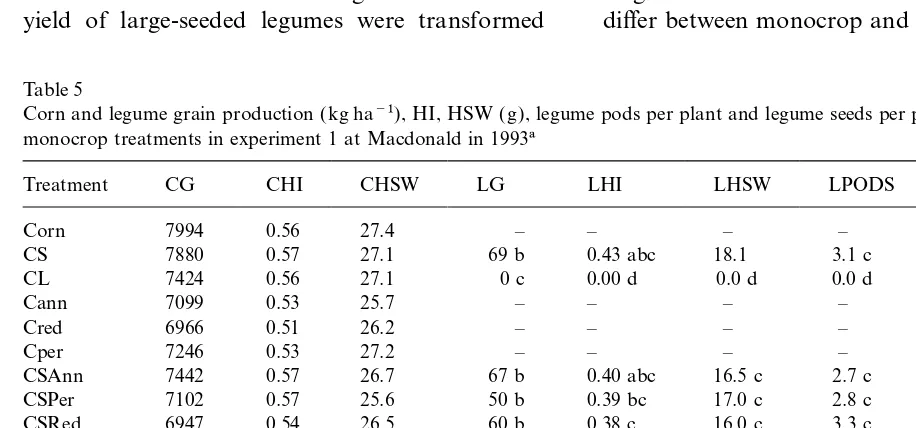
Table 5
Corn and legume grain production (kg ha−1), HI, HSW (g), legume pods per plant and legume seeds per pod for the intercrop and monocrop treatments in experiment 1 at Macdonald in 1993a
Treatment CG CHI CHSW LG LHI LHSW LPODS LSEEDS LER
Corn 7994 0.56 27.4 – – – – – –
CS 7880 0.57 27.1 69 b 0.43 abc 18.1 3.1 c 1.7 c 1.09
CL 7424 0.56 27.1 0 c 0.00 d 0.0 d 0.0 d 0.0 d 1.00
Cann 7099 0.53 25.7 – – – – – 0.95
Cred 6966 0.51 26.2 – – – – – 0.98
Cper 7246 0.53 27.2 – – – – – 0.97
CSAnn 7442 0.57 26.7 67 b 0.40 abc 16.5 c 2.7 c 1.6 c 0.98
CSPer 7102 0.57 25.6 50 b 0.39 bc 17.0 c 2.8 c 1.8 c 1.04
CSRed 6947 0.54 26.5 60 b 0.38 c 16.0 c 3.3 c 1.6 c 0.90
CWeed 6356 0.58 24.3 – – – – – –
Chand 8235 0.55 27.6 – – – – – –
CLAnn 6227 0.53 25.8 0 c 0.00 d 0.0 d 0.0 d 0.0 d 0.91
CLPer 6078 0.54 25.7 0 c 0.00 d 0.0 d 0.0 d 0.0 d 0.95
CLRed 6674 0.51 27.2 0 c 0.00 d 0.0 d 0.0 d 0.0 d 0.96
Soybean – – – 1662 a 0.47 a 21.1 b 11.7 a 2.6 b –
Lupin – – – 1591 a 0.46 ab 33.2 a 8.8 b 3.3 a –
C.V. n.s. n.s. n.s. ** ** ** ** ** –
Trt 23.1 9.6 6.8 11.9 21.9 12.6 30.3 10.8 –
aC=corn, L=legume, G=grain, HI=harvest index, HSW=hundred seed weight, PODS=number of pods per plant, SEEDS=
either site in 1994 (data not shown). A large from monocrop soybean except in the case of CSMix at L’Assomption in 1994 and two treat-variation in the yield in 1994, especially at the
Macdonald site, was observed and might have ments (CSPer and CSRed ) at Macdonald in 1993,
whereas HI in other intercrops was significantly been due to heavy precipitation resulting in
flood-ing in some areas. In this experiment, corn com- reduced ( Tables 5–8). The HSW and the number
of seeds per pod for intercropped soybean were peted well in the presence of other intercrop species
and, in general, its yield variables were not affected lower, only in 1993, than monocropped soybean;
once again, there were no differences among
by intercropping. Several workers (Mohta and
Ded, 1980; Chui and Shibles, 1984; Hikam et al., intercrop treatments. A decreased production of
pods per plant in intercrop soybean relative to 1992), have reported variable responses of corn as
a intercrop component, whereas in the present monocrop soybean was observed at both the sites
in 1993 but not in 1994. The height of intercropped
study the yields of corn were not affected by
intercropping with legumes. soybean was 15 to 20 cm greater than
monocropped soybean at the end of both growing seasons (data not shown).
3.1.2. Large-seeded legumes
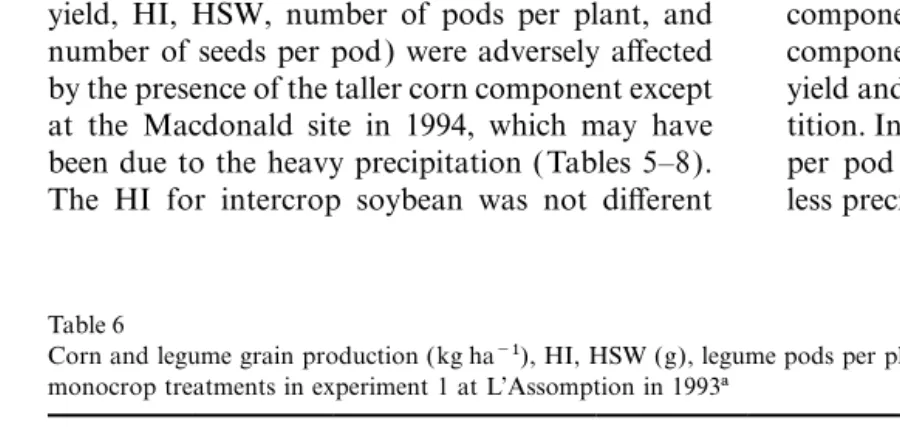
In general, soybean yield components (i.e. grain Hume et al. (1985) reported that, among yield
components, the number of pods per plant is the yield, HI, HSW, number of pods per plant, and
number of seeds per pod) were adversely affected component most closely correlated with soybean
yield and hence the factor most affected by
compe-by the presence of the taller corn component except
at the Macdonald site in 1994, which may have tition. Interestingly, the HSW and number of seeds
per pod were affected only in 1993, a year with
been due to the heavy precipitation ( Tables 5–8).
The HI for intercrop soybean was not different less precipitation than 1994 ( Table 3). HI was not
Table 6
Corn and legume grain production (kg ha−1), HI, HSW (g), legume pods per plant and legume seeds per pod for the intercrop and monocrop treatments in experiment 1 at L’Assomption in 1993a
Treatment CG CHI CHSW LG LHI LHSW LPODS LSEEDS LER
Corn 7892 0.45 25.5 – – – – – –
CS 8184 0.43 24.2 70 b 0.31 b 8.2 cd 2.8 c 1.6 c 1.11
CL 8486 0.44 24.4 0 c 0.00 c 0.0 e 0.0 d 0.0 d 1.18
Cann 8217 0.45 25.4 – – – – – 1.05
Cred 7691 0.43 23.6 – – – – – 1.02
Cper 7826 0.44 24.4 – – – – – 1.02
CSAnn 8029 0.46 24.6 115 b 0.47 a 13.5 c 2.7 c 1.6 c 1.01
CSPer 7555 0.40 23.4 123 b 0.38 ab 12.9 c 3.3 c 1.6 c 1.13
CSRed 8260 0.44 23.9 61 b 0.35 ab 3.9 de 2.8 c 1.4 c 1.02
CWeed 7661 0.46 25.0 0 c 0.00 c 0.0 e 0.0 d 0.0 d –
Chand 7913 0.44 24.7 0 c 0.00 c 0.0 e 0.0 d 0.0 d –
CLAnn 7585 0.42 24.8 0 c 0.00 c 0.0 e 0.0 d 0.0 d 0.99
CLPer 7171 0.43 24.2 – – – – – 1.10
CLRed 7260 0.40 25.1 – – – – – 1.08
Soybean – – – 1769 a 0.34 ab 24.8 b 17.9 a 2.3 b –
Lupin – – – 3257 a 0.38 ab 33.4 a 9.8 b 3.7 a –
C.V. 9.8 7.5 3.8 12.6 43.8 55.6 21.8 11.8 –
Trt n.s. n.s. n.s. ** ** ** ** ** –
Table 7
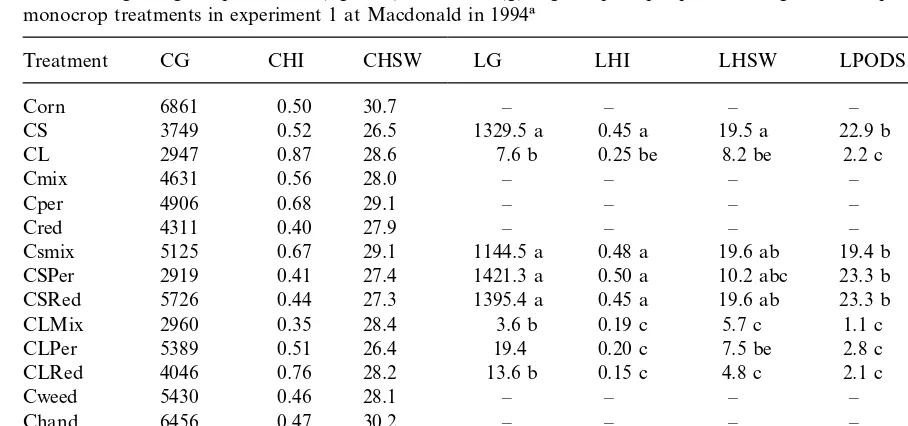
Corn and legume grain production (kg ha−1), HI, HSW (g), legume pods per plant and legume seeds per pod for the intercrop and monocrop treatments in experiment 1 at Macdonald in 1994a
Treatment CG CHI CHSW LG LHI LHSW LPODS LSEEDS LER
Corn 6861 0.50 30.7 – – – – – –
CS 3749 0.52 26.5 1329.5 a 0.45 a 19.5 a 22.9 b 2.0 1.25
CL 2947 0.87 28.6 7.6 b 0.25 be 8.2 be 2.2 c 2.5 0.46
Cmix 4631 0.56 28.0 – – – – – 0.63
Cper 4906 0.68 29.1 – – – – – 0.63
Cred 4311 0.40 27.9 – – – – – 0.73
Csmix 5125 0.67 29.1 1144.5 a 0.48 a 19.6 ab 19.4 b 2.2 1.16
CSPer 2919 0.41 27.4 1421.3 a 0.50 a 10.2 abc 23.3 b 1.1 1.01
CSRed 5726 0.44 27.3 1395.4 a 0.45 a 19.6 ab 23.3 b 2.1 1.63
CLMix 2960 0.35 28.4 3.6 b 0.19 c 5.7 c 1.1 c 2.2 0.60
CLPer 5389 0.51 26.4 19.4 0.20 c 7.5 be 2.8 c 1.7 0.98
CLRed 4046 0.76 28.2 13.6 b 0.15 c 4.8 c 2.1 c 1.4 0.53
Cweed 5430 0.46 28.1 – – – – – –
Chand 6456 0.47 30.2 – – – – – –
Soybean – – – 2059.6 a 0.43 ab 22.1 a 14.8 b 2.1 –
Lupin – – – 664.3 a 0.33 abc 18.8 ab 33.4 a 1.1 –
C.V 40.5 48.0 5.9 30.8 22.6 51.0 32.7 62.1 –
Trt n.s. n.s. n.s. ** ** ** ** n.s. –
aC=corn, L=legume, G=grain, HI=harvest index, HSW=hundred seed weight, LER=land equivalence ratio, PODS=number of pods per plant, SEEDS=number of seeds per pod; n.s.=not significant atP>0.05, **=significant atP<0.01. Values in the same column followed by the same letter are not different (P>0.05) according to a GLM protected LSD test.
affected by intercropping in 1993, indicating that were similar in intercrop and monocrop systems
at the Macdonald site, whereas intercropped lupin the overall partitioning of resources within the
soybean plant was not affected in this year. plants were 10 to 15 cm taller than monocropped
lupin at L’Assomption (data not shown). However, the development of all other yield
com-ponents was affected. These differences between Overall, lupin appears to compete poorly with
corn, with intercropping resulting in no grain pro-the two years may be related to variation in
rainfall, the change in corn hybrid, or differences duction in 1993 and low grain production in 1994.
Lupin has been suggested as an effective replacement
in weed pressure (Carruthers et al., 1998).
In 1993 lupin produced no grain when inter- for soybean in silage (Hill, 1977; Perez-Escamilla
et al., 1988) and may be more adaptable to northern cropped. This resulted in decreases in all yield
components of lupin (grain yield, HI, HSW, climates (Pate et al., 1985). However, this experiment
demonstrated that lupin is not a significant contrib-number of pods per plant, and contrib-number of seeds
per pod ) with no differences among the intercrop utor to silage when intercropped with corn and it
competes poorly with corn. Lupin responds to envi-treatments ( Table 6). In 1994, although there were
decreases in grain yield for intercropped lupin in ronmental stresses primarily by decreasing the
number of reproductive organs (Herbert, 1977; comparison with monocrop yields, some yield
components were not affected. The HI and number Withers, 1979) and HSW (Pate et al., 1985). The
results of the present experiment are in conformity
of seeds per pod were not affected by any
treat-ment, whereas the HSW and the number of pods with the observations of the above workers. In the
present experiment the lupin HSW was much more per plant decreased. All components, except the
number of seeds per pod, were decreased at strongly reduced by intercropping than reported
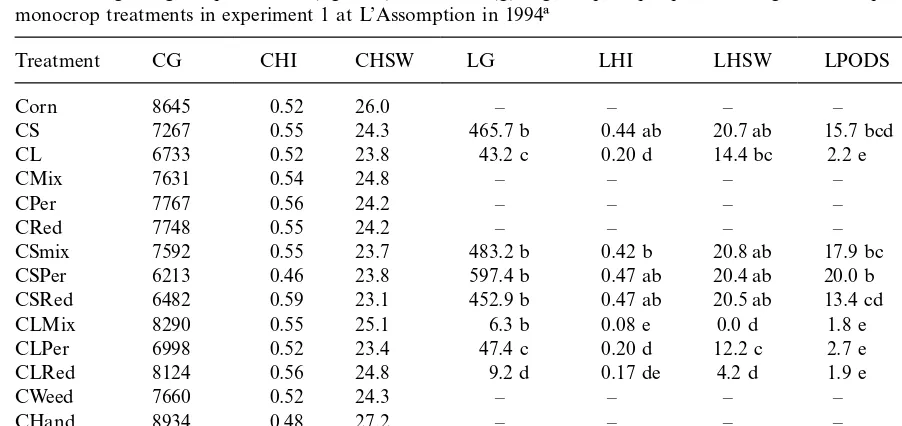
Table 8
Corn and legume grain production (kg ha−1), HI, HSW (g), legume pods per plant and legume seeds per pod for the intercrop and monocrop treatments in experiment 1 at L’Assomption in 1994a
Treatment CG CHI CHSW LG LHI LHSW LPODS LSEEDS LER
Corn 8645 0.52 26.0 – – – – – –
CS 7267 0.55 24.3 465.7 b 0.44 ab 20.7 ab 15.7 bcd 2.0 1.00
CL 6733 0.52 23.8 43.2 c 0.20 d 14.4 bc 2.2 e 2.8 0.84
CMix 7631 0.54 24.8 – – – – – 0.86
CPer 7767 0.56 24.2 – – – – – 0.83
CRed 7748 0.55 24.2 – – – – – 0.85
CSmix 7592 0.55 23.7 483.2 b 0.42 b 20.8 ab 17.9 bc 1.9 1.03
CSPer 6213 0.46 23.8 597.4 b 0.47 ab 20.4 ab 20.0 b 2.0 1.06
CSRed 6482 0.59 23.1 452.9 b 0.47 ab 20.5 ab 13.4 cd 2.0 0.89
CLMix 8290 0.55 25.1 6.3 b 0.08 e 0.0 d 1.8 e 1.9 0.97
CLPer 6998 0.52 23.4 47.4 c 0.20 d 12.2 c 2.7 e 3.0 0.87
CLRed 8124 0.56 24.8 9.2 d 0.17 de 4.2 d 1.9 e 2.5 0.97
CWeed 7660 0.52 24.3 – – – – – –
CHand 8934 0.48 27.2 – – – – – –
Soybean – – – 3161.3 a 0.53 a 20.1 ab 33.5 ab 2.2 –
Lupin – – – 1223.6 ab 0.31 c 27.0 a 12.3 d 3.0 –
C.V 16.9 20.1 6.9 14.7 23.0 32.0 28.5 25 16.3
Trt n.s. n.s. – ** ** ** ** n.s. –
aC=corn, L=legume, G=grain, HI=harvest index, HSW=hundred seed weight, LER=land equivalence ratio, PODS=number of pods per plant, SEEDS=number of seeds per pod; n.s.=not significant atP>0.05, **=significant atP<0.01. Values in the same column followed by the same letter are not different (P>0.05) according to a GLM protected LSD test.
3.1.3. LER 3.2. Experiment 2
All treatments utilizing soybean as an intercrop
component had LERs equal to or greater than 3.2.1. Corn
Corn grain yield was quite variable between one, except for CSRed at Macdonald in 1993 and
L’Assomption in 1994 ( Table 5–8). The LERs sites during the two years. In 1993, most of the
simultaneously seeded intercrop treatments had ranged from 1 to 1.63, with CSRed at Macdonald
in 1994 giving the best ratio. Corn–soybean lower grain yields than monocropped corn;
how-ever, there was no such reaction for the delay-intercrops have frequently outyielded monocrop
corn in many areas of the world (Mohta and Ded, seeded intercrops ( Tables 9 and 10). A three-way
interaction, between legume type, seeding date and 1980; Chui and Shibles, 1984; Martin et al., 1990).
Intercropping systems that consistently give LERs number of legume rows, occurred for corn grain
yield in 1993 due to an atypical decrease in one
greater than one are thought to be more efficient
systems from a land use perspective than treatment (CS1D) at L’Assomption and an atypical
increase in one treatment (CS1S ) at Macdonald. monocrops ( Willey 1979). Thus, corn–soybean
intercrops are superior to corn–lupin intercrops in Corn grain yield was not affected by any treatment
applied at Macdonald or L’Assomption in 1994 this environment. At L’Assomption in 1993, all
intercrop treatments except for CLAnn gave LERs (Tables 11 and 12). The HI of the corn crop was
generally not affected by the treatments, with the
greater than one ( Table 6). Although not
statistic-ally different, all intercrop corn had numerically two exceptions being CS2S and CL1S, which
decreased HI at Macdonald in 1993. These higher biomass yields than the herbicide-weeded
monocrop corn, leading to overyielding by the decreases caused a three-way interaction similar to
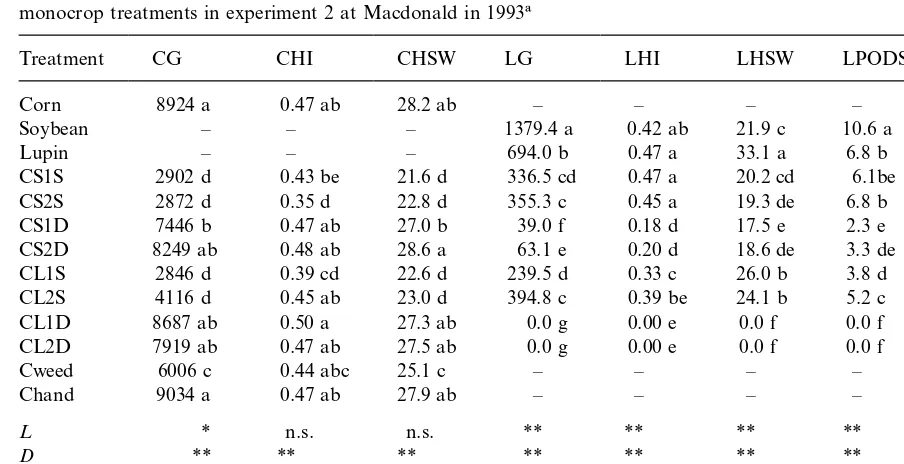
Table 9
Corn and legume grain production (kg ha−1), HI, HSW (g), legume pods per plant and legume seeds per pod for the intercrop and monocrop treatments in experiment 2 at Macdonald in 1993a
Treatment CG CHI CHSW LG LHI LHSW LPODS LSEEDS LER
Corn 8924 a 0.47 ab 28.2 ab – – – – – –
Soybean – – – 1379.4 a 0.42 ab 21.9 c 10.6 a 2.3 c –
Lupin – – – 694.0 b 0.47 a 33.1 a 6.8 b 3.4 b –
CS1S 2902 d 0.43 be 21.6 d 336.5 cd 0.47 a 20.2 cd 6.1be 2.1 d 0.58 CS2S 2872 d 0.35 d 22.8 d 355.3 c 0.45 a 19.3 de 6.8 b 2.0 d 0.68
CS1D 7446 b 0.47 ab 27.0 b 39.0 f 0.18 d 17.5 e 2.3 e 1.3 e 0.94
CS2D 8249 ab 0.48 ab 28.6 a 63.1 e 0.20 d 18.6 de 3.3 de 1.4 e 1.01 CL1S 2846 d 0.39 cd 22.6 d 239.5 d 0.33 c 26.0 b 3.8 d 3.7 a 0.89 CL2S 4116 d 0.45 ab 23.0 d 394.8 c 0.39 be 24.1 b 5.2 c 3.8 a 1.17
CL1D 8687 ab 0.50 a 27.3 ab 0.0 g 0.00 e 0.0 f 0.0 f 0.0 f 0.93
CL2D 7919 ab 0.47 ab 27.5 ab 0.0 g 0.00 e 0.0 f 0.0 f 0.0 f 0.89
Cweed 6006 c 0.44 abc 25.1 c – – – – – –
Chand 9034 a 0.47 ab 27.9 ab – – – – – –
L * n.s. n.s. ** ** ** ** ** –
D ** ** ** ** ** ** ** ** –
R n.s. n.s. n.s. * n.s. n.s. * n.s. –
L×D n.s. n.s. n.s. ** * ** n.s. ** –
L×R n.s. n.s. n.s. n.s. n.s. n.s. n.s. n.s. –
D×R n.s. n.s. n.s. n.s. n.s. n.s. n.s. n.s. –
L×D×R * * n.s. * n.s. n.s. n.s. n.s. –
aC=corn, L=legume, G=grain, HI=harvest index, HSW=hundred seed weight, PODS=number of pods per plant, SEEDS=
number of seeds per pod, LER=land equivalence ratio.L=legume type (soybean or lupin), D=seeding date (simultaneous or delayed ),R=number of rows of legume seeded (1 or 2); n.s.=not significant atP>0.05, *=significant atP<0.05, **=significant atP<0.01. Values in the same column followed by the same letter are not different (P>0.05) according to a GLM protected LSD test. Indications as to the significance of main effects and interactions refer to a factorial analysis that included only legume intercrop treatments.
decreases ranged from 6.6 to 3.2 g relative to the component most often affected was HSW. The HI
of corn was not affected, suggesting that corn
monocrop corn and reflected the decreases seen in
corn biomass, except at both sites in 1994 where reacted to competition by reducing the weight of
the grain to balance the loss of vegetative biomass,
no effect was observed. At Macdonald in 1993,
simultaneous seeding of the intercrop components rather than altering its partitioning of resources.
decreased the HSW. At L’Assomption in 1993, a
legume type by seeding date interaction occurred 3.2.2. Large-seeded legumes
In general, soybean grain and biomass yields because the HSW of corn in corn–soybean
intercrops was not affected by delayed seeding were decreased by all intercrop treatments,
although treatment CS2S at L’Assomption (1993) whereas that of simultaneously seeded plants was,
but the lupin intercrop components caused yields were not different from monocrops ( Tables
9–12). The simultaneous seeding of soybean did decreases in corn HSW in simultaneously seeded
intercrops. As seen in the previous experiment, the not affect the HI of soybean, but delayed seeding
resulted in HI values lower than for monocropped height of the corn plants (data not shown) and the
number of kernels per cob (1994) were not affected soybean. Delayed seeding has been shown to result
in increased shading for soybean plants, reducing by any of the intercrop treatments. Delayed
seed-ing of the intercrops rarely affected corn variables, overall photosynthate production to a level where
soybean plants compensated by decreasing the whereas simultaneous seeding produced extremely
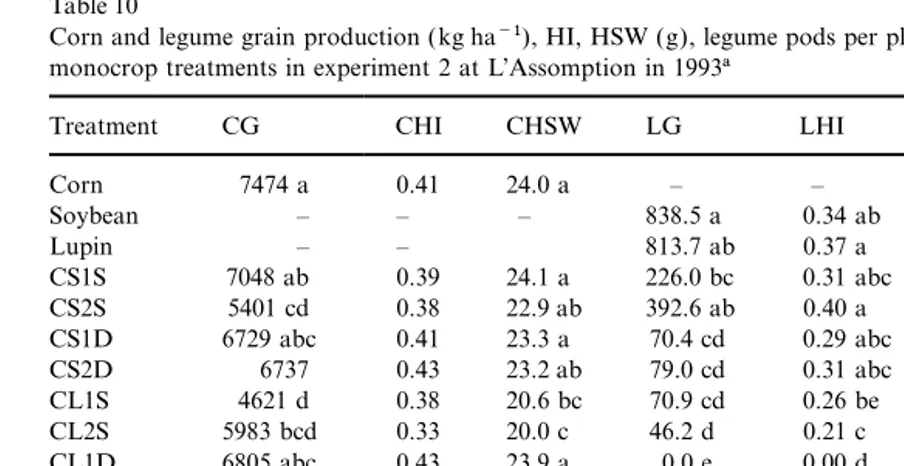
pro-Table 10
Corn and legume grain production (kg ha−1), HI, HSW (g), legume pods per plant and legume seeds per pod for the intercrop and monocrop treatments in experiment 2 at L’Assomption in 1993a
Treatment CG CHI CHSW LG LHI LHSW LPODS LSEEDS LER
Corn 7474 a 0.41 24.0 a – – – – – –
Soybean – – – 838.5 a 0.34 ab 31.0 a 9.7 a 2.1 b –
Lupin – – 813.7 ab 0.37 a 29.1 a 8.0 ab 3.3 a –
CS1S 7048 ab 0.39 24.1 a 226.0 bc 0.31 abc 19.9 b 5.2 bcd 1.6 bcd 1.07 CS2S 5401 cd 0.38 22.9 ab 392.6 ab 0.40 a 20.1 b 8.1 ab 1.7 bcd 1.40 CS1D 6729 abc 0.41 23.3 a 70.4 cd 0.29 abc 16.4 b 2.6 de 1.2 d 0.97 CS2D 6737 0.43 23.2 ab 79.0 cd 0.31 abc 17.3 b 3.6 cd 1.3 cd 0.95 CL1S 4621 d 0.38 20.6 bc 70.9 cd 0.26 be 16.0 b 2.9 cde 2.7 a 0.82 CL2S 5983 bcd 0.33 20.0 c 46.2 d 0.21 c 11.2 c 6.0 bc 1.9 bc 0.83
CL1D 6805 abc 0.43 23.9 a 0.0 e 0.00 d 0.0 d 0.0 e 0.0 e 0.91
CL2D 6823 abc 0.39 23.1 ab 0.0 e 0.00 d 0.0 d 0.0 e 0.0 e 0.97
Cweed 6315 abc 0.41 22.9 ab – – – – – –
Chand 7765 a 0.42 25.0 a – – – – – –
L n.s. n.s. n.s. ** ** ** ** n.s. –
D * n.s. n.s. ** ** ** ** ** –
R n.s. n.s. n.s. n.s. n.s. n.s. n.s. n.s. –
L×D n.s. n.s. * * * ** n.s. ** –
L×R n.s. n.s. n.s. n.s. n.s. n.s. n.s. n.s. –
D×R n.s. n.s. n.s. n.s. n.s. n.s. n.s. n.s. –
L×D×R * n.s. n.s. n.s. n.s. n.s. n.s. n.s. –
aC=corn, L=legume, G=grain, HI=harvest index, HSW=hundred seed weight, PODS=number of pods per plant, SEEDS=
number of seeds per pod, LER=land equivalence ratio.L=legume type (soybean or lupin), D=seeding date (simultaneous or delayed ),R=number of rows of legume seeded (1 or 2); n.s.=not significant atP>0.05, *=significant atP<0.05, **=significant atP<0.01. Values in the same column followed by the same letter are not different (P>0.05) according to a GLM protected LSD test. Indications as to the significance of main effects and interactions refer to a factorial analysis that included only legume intercrop treatments.
duction (Legere and Schreiber, 1989). It may also expect any gains in silage production from seeding
this late, as has been reported for similar experi-have been the case that the level of shading during
grain filling was higher than before grain filling, ments with corn and beans ( Francis et al., 1976),
and corn and cowpea (Ofori and Stern, 1987b). resulting in drastic reductions in HI. As in the
previous experiment, the HSW and number of Other researchers have reported that simultaneous
seeding produced better, but variable, results with soybean seeds per pod decreased for all intercrop
treatments in 1993, but neither were affected in intercropped corn and bean ( Francis et al., 1982)
or corn and peanut (Misbahulmunir et al., 1989).
1994. The lack of intercropping effects on these
variables may have been due to higher levels of There was no difference between seeding one or
two rows of legume in intercrops for yield compo-precipitation in 1994 than 1993 ( Table 3). In most
cases the number of pods per plant decreased, with nent variables.
Lupin biomass and grain production were the only exceptions observed being for a few of
the simultaneously seeded treatments. Delay- decreased by all intercrop treatments. In the
delay-seeded treatments, lupin competed so poorly that seeded intercropped soybean was generally 20 to
30 cm shorter than simultaneously seeded soybean, it produced no grain in either year ( Tables 9–12).
Since no grain was produced by the delay-seeded and simultaneously seeded soybean was also taller
than monocrop soybean (data not shown). In treatments and little was produced by the
simulta-neously seeded treatments, all of the yield compo-general, delayed seeding resulted in poorer soybean
Table 11
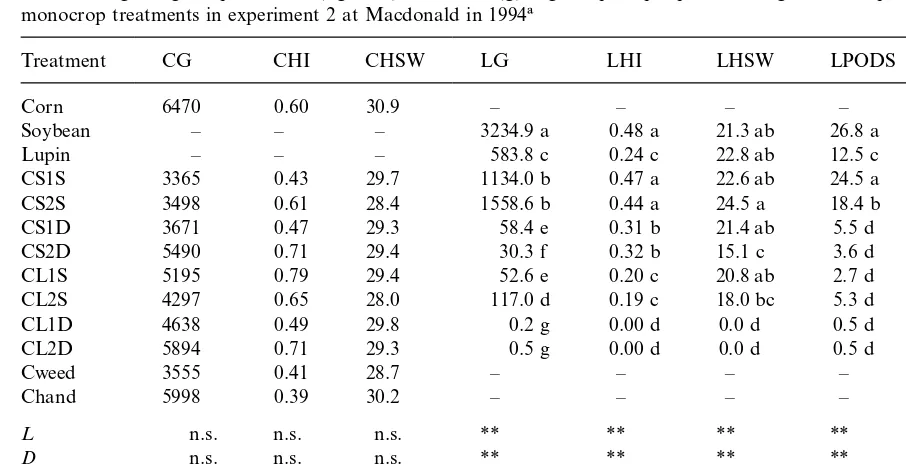
Corn and legume grain production (kg ha−1), HI, HSW (g), legume pods per plant and legume seeds per pod for the intercrop and monocrop treatments in experiment 2 at Macdonald in 1994a
Treatment CG CHI CHSW LG LHI LHSW LPODS LSEEDS LER
Corn 6470 0.60 30.9 – – – – – –
Soybean – – – 3234.9 a 0.48 a 21.3 ab 26.8 a 2.3 –
Lupin – – – 583.8 c 0.24 c 22.8 ab 12.5 c 2.9 –
CS1S 3365 0.43 29.7 1134.0 b 0.47 a 22.6 ab 24.5 a 2.0 1.19
CS2S 3498 0.61 28.4 1558.6 b 0.44 a 24.5 a 18.4 b 2.1 1.08
CS1D 3671 0.47 29.3 58.4 e 0.31 b 21.4 ab 5.5 d 1.6 0.71
CS2D 5490 0.71 29.4 30.3 f 0.32 b 15.1 c 3.6 d 1.6 0.75
CL1S 5195 0.79 29.4 52.6 e 0.20 c 20.8 ab 2.7 d 2.8 0.85
CL2S 4297 0.65 28.0 117.0 d 0.19 c 18.0 bc 5.3 d 2.7 1.03
CL1D 4638 0.49 29.8 0.2 g 0.00 d 0.0 d 0.5 d 1.5 0.89
CL2D 5894 0.71 29.3 0.5 g 0.00 d 0.0 d 0.5 d 0.8 0.88
Cweed 3555 0.41 28.7 – – – – – –
Chand 5998 0.39 30.2 – – – – – –
L n.s. n.s. n.s. ** ** ** ** n.s. –
D n.s. n.s. n.s. ** ** ** ** n.s. –
R n.s. n.s. n.s. n.s. n.s. n.s. n.s. n.s. –
L×D n.s. n.s. n.s. * n.s. ** ** n.s. –
L×R n.s. n.s. n.s. * n.s. n.s. n.s. n.s. –
D×R n.s. n.s. n.s. * n.s. n.s. n.s. n.s. –
L×D×R n.s. n.s. n.s. n.s. n.s. n.s. n.s. n.s. –
aC=corn, L=legume, G=grain, HI=harvest index, HSW=hundred seed weight, LER=land equivalence ratio, PODS=number of pods per plant, SEEDS=number of seeds per pod.L=legume type (soybean or lupin),D=seeding date (simultaneous or delayed ),
R=number of rows of legume seeded (1 or 2); n.s.=not significant atP>0.05, *=significant atP<0.05, **=significant atP<0.01. Values in the same column followed by the same letter are not different (P>0.05) according to a GLM protected LSD test. Indications as to the significance of main effects and interactions refer to a factorial analysis that included only legume intercrop treatments.
monocrop production. Also, delay-seeded lupin a value this close to one constitutes no real
improvement. LERs of 1.19 (CS1S) and 1.08 plants were much shorter than monocrop or
simul-taneously seeded plants (data not shown). Most (CS2S) were the highest values recorded for
simul-taneously seeded soybean at the Macdonald site simultaneously seeded treatments resulted in
decreased HIs, HSWs, number of pods per plant in 1994, whereas at the 1994 L’Assomption site,
an LER of 1.02 (CS2D) for the delay-seeded and seeds per pod for lupin. However, some
simul-taneously seeded treatments did have values similar soybean was the highest value recorded ( Tables 7
and 8). Flooding at the L’Assomption site in 1994 to monocrop lupin for all of these variables ( Tables
10–12). Simultaneously seeded lupin was always affected corn growth so that over yielding of the
monocrop corn control was not seen for any corn– 10 to 15 cm taller than monocrop lupin (data not
shown). The results of the present experiments soybean treatment. Higher soybean yields for
simultaneously seeded corn–soybean intercrops as suggests that lupin may not be a good intercrop
component with corn. opposed to delayed seeding of the soybean
compo-nent in this experiment are consistent with results from previous studies (Allen and Obura 1983;
3.2.3. LER
In 1993 at L’Assomption, the two simulta- Herbert et al., 1984). Beneficial LERs were also
recorded for lupin (CL2S ) at the 1994 and 1993 neously seeded soybean intercrop treatments gave
LERs greater than one (CS2S=1.40, CS1S=1.07) Macdonald sites due to some lupin growth in this
system, accompanied by no reduction in corn ( Table 6). An LER of 1.01 for CS2D was obtained
Table 12
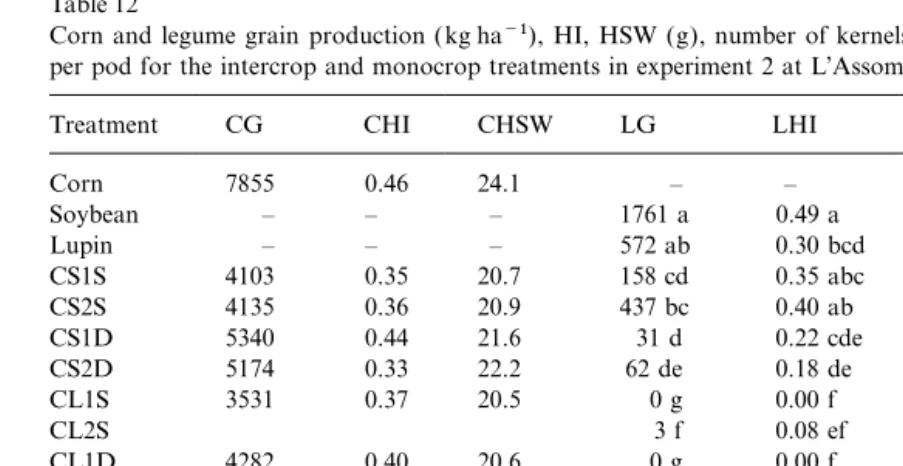
Corn and legume grain production (kg ha−1), HI, HSW (g), number of kernels per cob, legume pods per plant and legume seeds per pod for the intercrop and monocrop treatments in experiment 2 at L’Assomption in 1994a
Treatment CG CHI CHSW LG LHI LHSW LPODS LSEEDS LER
Corn 7855 0.46 24.1 – – – –
Soybean – – – 1761 a 0.49 a 15.7 bc 27.3 a 2.2 ab –
Lupin – – – 572 ab 0.30 bcd 24.6 a 9.0 b 2.9 a –
CS1S 4103 0.35 20.7 158 cd 0.35 abc 18.4 abc 7.9 b 1.9 b 0.84
CS2S 4135 0.36 20.9 437 bc 0.40 ab 19.2 ab 9.3 b 1.9 b 0.99
CS1D 5340 0.44 21.6 31 d 0.22 cde 10.9 cd 3.0 b 1.6 b 0.75
CS2D 5174 0.33 22.2 62 de 0.18 de 16.5 bc 2.8 c 1.5 b 1.02
CL1S 3531 0.37 20.5 0 g 0.00 f 0.0 e 0.0 c 0.0 c 0.57
CL2S 3 f 0.08 ef 4.4 de 1.4 c 1.6 b 0.64
CL1D 4282 0.40 20.6 0 g 0.00 f 0.0 e 0.0 c 0.0 c 0.87
CL2D 4635 0.37 21.2 0 g 0.00 f 0.0 e 0.0 c 0.0 c –
Cweed 6836 0.47 23.5 – – – – – –
Chand 6716 0.45 24.0 – – – – – –
L n.s. n.s. n.s. ** ** ** ** ** –
D n.s. n.s. n.s. * * * ** * –
R n.s. n.s. n.s. n.s. n.s. n.s. n.s. n.s. –
L×D n.s. n.s. n.s. n.s. n.s. n.s. n.s. –
L×R n.s. n.s. n.s. n.s. n.s. n.s. * n.s. –
D×R n.s. n.s. n.s. n.s. n.s. n.s. n.s. * –
L×D×R n.s. n.s. n.s. n.s. n.s. n.s. n.s. n.s. –
aC=corn, L=legume, G=grain, HI=harvest index, HSW=hundred seed weight, LER=land equivalence ratio, PODS=number of pods per plant, SEEDS=number of seeds per pod.L=legume type (soybean or lupin),D=seeding date (simultaneous or delayed ),
R=number of rows of legume seeded (1 or 2); n.s.=not significant atP>0.05, *=significant atP<0.05, **=significant atP<0.01. Values in the same column followed by the same letter are not different (P>0.05) according to a GLM protected LSD test. Indications as to the significance of main effects and interactions refer to a factorial analysis that included only legume intercrop treatments.
4. Conclusions seeds per pod in 1993, and altering HI in 1994,
presumably, in response to changes in precipitation levels, corn variety and weed pressure. Lupin had The results of these two experiments
demon-strated the degree of variability the intercrop less flexible responses, either losing all production
of grain or severely reducing the number of pods pattern can bring about in terms of legume and
corn grain yields and yield components. The HIs in response to intercropping. Yield components of
legumes were greatly affected by changes in legume
of all crops were seldom affected, the exceptions
being for soybean delay-seeded into intercrop sys- type and seeding date. Simultaneously seeded
soy-bean with corn consistently recorded LER values tems, or lupin under any intercrop system,
suggest-ing that resource partitionsuggest-ing is only affected by of one or greater than one, suggesting that soybean
simultaneously seeded may be the best system in these intercrops when competition is severe. Corn
was variable in its response, having no yield terms of overall production for eastern Canada.
decreases in one experiment but being affected by
simultaneous seeding of legumes in the other. Underseeding forages, regardless of type used, had
no impact on the yield and yield components of Acknowledgements
the other potential intercrop components (corn,
soybean, lupin). Soybean responded quite variably This research was supported by a grant from
the Ministere de l’Environnement du Quebec to to intercropping — compensating for poor corn
Marchiol, L., Miceli, F., Pinosa, M., Zerbi, G., 1992.
Intercrop-Ayoub and both staffs at the two research stations
ping of soybean and maize for silage in northern Italy. Effect
used for these experiments.
of nitrogen level and plant density on growth, yield, and protein content. Eur. J. Agron. 1, 207–211.
Martin, R.C., Voldeng, H.C., Smith, D.L., 1990. Intercropping corn and soybean in a cool temperate region: yield, protein and economic benefits. Field Crops Res. 23, 295–310. References Mead, R., 1986. Statistical methods for multiple cropping. In:
Francis, C.A. ( Ed.), Multiple Cropping System. Macmillan, New York.
Ahmed, S., Rao, M.R., 1982. Performance of maize–soybean
intercrop combination in the tropics: results of a multi-loca- Misbahulmunir, M.Y., Sammons, D.J., Weil, R.R., 1989. Corn– peanut intercrop performance in relation to component crop tion study. Field Crops Res. 5, 147–161.
Allen, J.R., Obura, R.K., 1983. Yield of corn, cowpea, and relative planting dates. Agron. J. 81, 184–189.
Mohta, N.K., Ded, R., 1980. Intercropping maize and sorghum soybean under different intercropping systems. Agron. J. 75,
1005–1009. with soya beans. J. Agric. Sci. 95, 117–122.
Morris, R.A., Garrity, D.P., 1993a. Resource capture and utili-Carruthers, K., Fe, Q., Cloutier, D., Smith, D.L., 1998.
Inter-cropping corn with soybean, lupin and forages: weed control zation in intercropping: water. Field Crops Res. 34, 303–317.
by intercrops combined with interrow cultivation. Eur.
J. Agron. 8, 225–238. Morris, R.A., Garrity, D.P., 1993b. Resource capture and utili-zation in intercropping: non-nitrogen nutrients. Field Crops Chui, J.A.N., Shibles, R., 1984. Influence of spatial
arrange-ments of maize on performance of an associated soybean Res. 34, 319–334.
Ofori, F., Stern, W.R., 1987a. Cereal–legume intercropping sys-intercrop. Field Crops Res. 8, 187–198.
Claassen, M.M., Shaw, R.H., 1970. Water deficit effects on corn tems. Adv. Agron. 41, 41–86.
Ofori, F., Stern, W.R., 1987b. Relative sowing time and density 11: grain components. Agron. J. 62, 652–655.
Francis, C.A., Flor, C.A., Temple, S.R., 1976. In: Papendick, of component crops in a maize/cowpea intercrop system. Exp. Agric. 23, 41–52.
R.I., Sanchez, P.A., Triplett, G.B. ( Eds.), Multiple
Crop-ping. Am. Soc. of Agron., Madison, WI, pp. 235–253. Pate, A., Williams, W., Farrington, D., 1985. Lupin (Lupinus spp.). In: Summerfield, R.J., Roberts, E.H. ( Eds.), Grain Francis, C.A., Prager, M., Tejada, G., 1982. Effect of relative
planting dates in bean (Phaseolus vulgarisL.) and maize (Zea Legume Crops. William Collins, London, pp. 699–746. Perez-Escamilla, R., Vohra, P., Klasing, K., 1988. Lupins ( Lupi-maysL.) intercropping patterns. Field Crops Res. 5, 45–54.
Fukai, S., Trenbath, B.R., 1993. Processes determining nus albusvar. Ultra) as a replacement for soybean meal in diets for growing chickens and turkey poults. Nut. Rep. Int. intercrop productivity and yields of component crops. Field
Crops Res. 34, 247–271. 38, 583–593.
Putnam, D.H., Herbert, S.J., Vargas, A., 1985. Intercropped Herbert, S.J., 1977. Growth and grain yield ofLupinus albusat
different plant populations. N. Z. J. Agric. Res. 20, 459–465. corn–soyabean density studies. 1. Yield complementarity. Exp. Agric. 21, 41–51.
Herbert, S.J., Putnam, D.H., Poos-Floyd, M.I., Vargas, A.,
Creighton, J.F., 1984. Forage yield of intercropped corn and Putnam, D.H., Wright, J., Field, L.A., Ayisi, K.K., 1992. Seed yield and water-use efficiency of white lupin as influenced soybean in various planting patterns. Agron. J. 76, 507–510.
Hikam, S., Poneleit, C.G., MacKown, C.T., Hildebrand, D.F., by irrigation, row spacing and weeds. Agron. J. 62, 652–655. SAS Institute, 1985. SAS User’s Guide: Statistics. Version 5, 1992. Intercropping of maize and winged bean. Crop Sci.
32, 195–198. SAS Institute, Cary, North Carolina, USA.
Singh, N.B., Singh, P.P., Nair, K.P.P., 1986. Effect of legume Hill, G.I.D., 1977. The composition and nutritive value of
Lupin seed. Nutr. Abstr. Rev. Ser. B: 47, 511–529. intercropping on enrichment of soil nitrogen, bacterial activ-ity and productivactiv-ity of associated maize crops. Exp. Agric. Horwith, B., 1985. A role for intercropping in modern
agricul-ture. BioScience 35, 286–291. 22, 339–344.
Tripathi, B., Singh, C.M., 1983. Weed and fertility management Hume, D.F., Shanmugasundaram, S., Beversdorf, W.I.D.,
1985. Soyabean (Glycine max(L.) Merrill ). In: Summerfield, using maize/soybean intercropping in the north-western Himalayas. Trop. Pest Man. 29, 267–270.
R.J., Roberts, E.H. (Eds.), Grain Legume Crops. William
Collins, London, pp. 391–432. Weil, R.R., McFadden, M.E., 1991. Fertility and weed stress effects on performance of maize/soybean intercrop. Agron. Keating, B.A., Carberry, P.S., 1993. Resource capture and use
in intercropping: solar radiation. Field Crops Res. 34, J. 83, 717–721.
Willey, R.W., 1979. Intercropping — its importance and 273–301.
Legere, A., Schreiber, M.M., 1989. Competition and canopy research needs. Part 1. Competition and yield advantages. Field Crop Abstr. 32, 1–10.
architecture as affected by soybean (Glycine max.). Row
width and density of redroot pigweed (Amaranthus retro- Withers, N.J., 1979. Effects of water stress onLupinus albus. N. Z. J. Agric. Res. 22, 445–474.