*Corresponding author. Address: Rua do Catete 344/803, Catete, Rio de Janeiro-RJ 22220-001, Brazil. Tel.: 55-21-295-1447-227; fax: 55-21-541-8148.
E-mail address:[email protected] (M. Resende).
Quality certi
"
cation and performance of Brazilian
"
rms:
An empirical study
Marcos A.M. Lima
!
, Marcelo Resende
"
,
*, Lia Hasenclever
"
!Department of Economics, Universidade Federal do Rio Grande do Sul, Av. JoaJo Pessoa 52, 90040-000, Porto Alegre-RS, Brazil
"Instituto de Economia, Universidade Federal do Rio de Janeiro, Av. Pasteur 250, Urca, 22290-240, Rio de Janeiro-RJ, Brazil
Received 29 July 1999; accepted 5 August 1999
Abstract
The paper studies the relationship between quality certi"cation, as indicated by the ISO 9001 and 9002 certi"cates, and the performance of Brazilian"rms since 1992. The comparison between the group of certi"ed"rms and an especially constructed control group indicated that, as a rule, one cannot discern di!erential levels of performance across the two groups for di!erent indicators. ( 2000 Elsevier Science B.V. All rights reserved.
Keywords: TQM; ISO 9000; Firm performance
1. Introduction
The increasing degree of competition in several markets following, for example, trade liberalization processes, has underscored the importance of non-price competition in a global market. In this sense, the growing signi"cance of global best practices is emblematic, including the total quality manage-ment (TQM) schemes in the modern corporation, and accordingly one can observe a large literature on the topic within the management"eld. Repre-sentative contributions include Garvin [1] and Deurtouzos et al. [2].
The importance of the quality dimension of productive processes, however, has received less
attention in the context of economic analysis. Leibenstein [3] advanced the possibility of non-allocative forms of ine$ciency in a typical "rm. This form of technical ine$ciency, the so-called
`x-ine$ciencya, consists of intrinsic characteristics derived from organizational complexities. An example might be given by sub-optimal e!ort levels within a principal}agent relationship.
In addition to this generic contribution, one should emphasize the work of Barron and Gjerde [4] which constructed a model on the adoption of TQM programs. The theoretical framework ad-dressed the trade-o!s involved in the referred issue by means of a modi"ed cost function which incorp-orated the e!ects of TQM programs. The relevant trade-o!s of the adoption of TQM can then be examined by confronting bene"ts of adoption with the related cost (e.g. training costs). Testable implications of the model included explanatory factors which favoured TQM adoption such as the
number of employees, rate of turnover and access to internal funding. The empirical results largely support the theoretical formulation for a sample of US"rms.
Having considered the issue of the adoption of TQM programs, it is relevant to assess whether the related"rms have experimented superior levels of performance in comparison with their counterparts which have not adopted those programs. Easton and Jarrel [5] follow this line of investigation. In fact, the aforementioned paper conceives the con-struction of control groups that allows comparison with "rms which have not adopted TQM. The evidence indicates that performance in terms of accounting measures and stock returns is improved for the"rms adopting TQM.
Withers et al. [6] investigate the impact of TQM and/or just-in-time (JIT) systems as precursors to ISO 9000 certi"cation. The work, based on attitude questionnaires, indicated that within the group of
"rms adopting either of those management sys-tems, there was a better understanding by man-agers of the importance of factors pertaining to
quality training and top management commitment, for example. There is, nonetheless, a gap in the empirical literature on quality certi"cation. The present paper aims at investigating the possibility of di!erential performance levels among "rms which have received ISO 9001 and 9002 quality certi"cates and those which have not. The paper is organized as follows: Section 2 brie#y outlines the empirical framework to be considered in the sequence and describes the data. Section 3 presents the empirical results. Section 4 summarises the con-clusions and considers possible directions for future research.
2. Quality certi5cation and performance:An empirical framework
The contribution of Easton and Jarrel [5] in-dicated that "rms adopting TQM tend to have superior performance levels. In principle, one could consider the quality certi"cation process, as repre-sented by the ISO 9000 series, as the outcome of previous e!orts involving programs such as TQM, for example. This interpretation further motivates
the development of a performance-comparison study in the context of quality certi"cation. In par-ticular, one will be interested in verifying whether the "rms which received the ISO 9001 or 9002 ceri"cates display superior performance levels. A crucial issue in this type of study is to de"ne a control group carefully. For that purpose, we can follow the lead of the previously mentioned authors and consider a criterion suggested by Barber and Lyon [7], namely by constructing a control group with "rms of the same two-digit sector and with similar (10% above or below) performance on the basis of operating income to total assets, in the year previous to certi"cation. Speci"cally, we make use of two basic data sources. First, the Brazilian technical norms entity (Associac7a8o Brasileira de
Normas TeHcnicas-ABNT), by means of its CB-25 division, provided a nominal list of the"rms receiv-ing ISO certi"cates within the 1992}1998 period. Second, we considered the most extensive"rm-level data source on accounting data for Brazil. We relied on the Getulio Vargas Foundation data-bank on the 1000 largest"rms in Brazil, which was available for the 1986}1996 period.
Having access to the aforementioned sources, the construction of the control group was considered. Following the criterion mentioned before, we were able to generate a control group with two"rms for each certi"ed"rm. The similarity criterion was con-sidered in terms of"ve di!erent return indicators: operating income to total assets (OITA), net in-come to total assets (NITA), sales to total assets (SATA), operating income to sales (OISA) and net income to sales (NISA). The criterion used here for construction of the control group requires the availability of the relevant accounting"gures (oper-ating income and total assets) for the year before certi"cation. In addition, we disregarded ISO 9003 certi"cations because of their reduced number and thus concentrated on 9001 and 9002 certi"cation. Taking these caveats as reference, we were able to work with a sample of 129"rms, 48 referring to the ISO 9001 certi"cate and the remainder to the ISO 9002 certi"cate. The sectoral distribution of the certi"cates appears in Table 1.
Table 1
ISO 9000 certi"cation!
Sector Number of
certi"ed"rms Auxiliary services for Econ. activity 2
Cellulose and paper 7
Chemicals 24
Communication and electrical material 15
Construction 1 Pharmaceutical and veterinary products 1
Plastic material products 4
!Source:ABNT and authors'construct
1Since the samples were not randomly chosen, the related-sample procedure will be more appropriate. In fact, Easton and Jarrel (1998) raise this point in the similar context of their paper.
2Authorative expositions of these widely used tests appear in [9] and [8].
large number of certi"cations. Moreover, one ob-serves a larger number of certi"cates in technically advanced sectors in contrast with the remaining sectors in which the number of ISO certi"cates is very small.
Therestof the paper considers the comparison of the group in which"rms received ISO 9000 certi" c-ates with a control group. As mentioned earlier, given the available data, one can generate two control"rms for each certi"ed"rm. It is possible to compute the average on these control "rms and then generate a control group with the same size as the group of certi"ed"rms. These groups can then be compared in terms of a two-related-samples nonparametric test.1 The results obtained from these statistical tests are presented in the next sec-tion.
3. Empirical results
In this section we undertake the sign test and the Wilcoxon signed-rank test to assess statistically whether there is any discernible di!erence between the performances of the two relevant groups. The former test takes medians as reference, whereas the latter considers di!erences in the means of the group of certi"ed"rms and the control group in terms of the "ve selected performance indicators. The Wilcoxon signed-rank test is reputed to have more power than the popular sign test because the former only uses the sign of pairwise di!erences.2 The set of tables presented below shows the value of the test statistics together with the 2-tailed exact p-values.
We"rst consider ISO 9000 certi"cates in general. The results are displayed in Table 2 below.
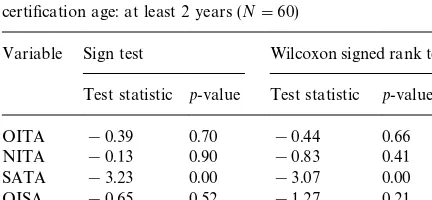
The results indicate that, except for the SATA indicator, there is no signi"cant di!erence between the two groups for the two tests. When we consider sub-groups by certi"cation age, as shown in Tables 3 and 4, similar evidence is obtained. In fact, only for the SATA indicatorcanone detect a strong result in terms of a superior performance by certi" -ed"rms, as indicated in Table 4, whereas one can observe some evidence of di!erential performance in terms of the NISA indicator for the Wilcoxon test in the same table.
Next, we consider the tests by ISO 9000 sub-type. The general results for the ISO 9001 are presented in Table 5.
Table 2
Performance comparison-ISO 9000 two related samples tests full sample (N"129)
Variable Sign test Wilcoxon signed rank test Test statistic p-value Test statistic p-value
OITA 0.00 1.00 !0.73 0.46
NITA !0.18 0.86 !0.94 0.35
SATA !2.87 0.01 !2.96 0.00
OISA !0.35 0.73 !0.69 0.49
NISA !1.41 0.16 !1.49 0.14
Table 3
Performance comparison-ISO 9000 two related samples tests certi"cation age: less than 2 years (N"69)
Variable Sign test Wilcoxon signed rank test Test statistic p-value Test statistic p-value
OITA !0.48 0.63 !0.59 0.56
NITA 0.00 1.00 !0.49 0.63
SATA !0.72 0.47 !1.14 0.26
OISA 0.00 1.00 !0.24 0.82
NISA !0.72 0.47 !0.27 0.79
Table 4
Performance comparison-ISO 9000 two related samples tests certi"cation age: at least 2 years (N"60)
Variable Sign test Wilcoxon signed rank test Test statistic p-value Test statistic p-value
OITA !0.39 0.70 !0.44 0.66
NITA !0.13 0.90 !0.83 0.41
SATA !3.23 0.00 !3.07 0.00
OISA !0.65 0.52 !1.27 0.21
NISA !1.16 0.25 !1.88 0.06
Table 5
Performance comparison-ISO 9001 two related samples tests full sample (N"48)
Variable Sign test Wilcoxon signed rank test Test statistic p-value Test statistic p-value
OITA !0.14 0.89 !0.12 0.91
NITA !0.72 0.47 !0.04 0.97
SATA !2.17 0.03 !2.06 0.04
OISA !0.14 0.89 !0.13 0.90
NISA 0.00 1.00 !0.41 0.69
Table 6
Performance comparison-ISO 9001 two related samples tests certi"cation age: less than 2 years (N"21)
Variable Sign test Wilcoxon signed rank test Test statistic p-value Test statistic p-value
OITA !0.44 0.66 !1.06 0.30
NITA !1.31 0.19 !1.37 0.18
SATA !0.44 0.66 !0.75 0.47
OISA !1.31 0.19 !1.79 0.08
NISA !1.31 0.19 !1.58 0.12
Table 7
Performance comparison-ISO 9001 two related samples tests certi"cation age: at least 2 years (N"27)
Variable Sign test Wilcoxon signed rank test Test statistic p-value Test statistic p-value
OITA 0.00 1.00 !0.86 0.40
NITA 0.00 1.00 !0.96 0.35
SATA !2.31 0.02 !2.31 0.02
OISA !0.77 0.44 !1.49 0.14
NISA !1.16 0.25 !1.68 0.10
hypothesis except for the SATA and NISA indicators.
When we consider sub-groups by certi"cation age the results are basically sustained. In the case of
"rms with less than 2 years of certi"cation the evidence is even stronger, as indicated in Table 9, where we cannot reject the null hypothesis for any of the selected indicators (only marginally for NISA in the case of the sign test).
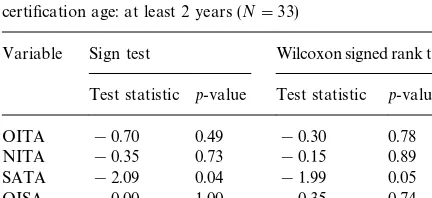
When one considers the sub-group of"rms
certi-"ed for at least 2 years the results are very similar, as displayed in Table 10. In this case, only for the SATA indicator is there some evidence against the null.
Table 8
Performance comparison-ISO 9002 two related samples tests full sample (N"81)
Variable Sign test Wilcoxon signed rank test Test statistic p-value Test statistic p-value
OITA !0.22 0.82 !0.98 0.33
NITA !0.22 0.82 !1.22 0.22
SATA !1.78 0.08 !2.06 0.04
OISA !0.67 0.51 !0.82 0.41
NISA !1.78 0.08 !1.66 0.10
Table 9
Performance comparison-ISO 9002 two related samples tests certi"cation age: less than 2 years (N"48)
Variable Sign test Wilcoxon signed rank test Test statistic p-value Test statistic p-value
OITA !1,01 0.31 !1.48 0.14
NITA !0.72 0.47 !1.45 0.15
SATA !0.43 0.67 !0.90 0.37
OISA !0.72 0.47 !0.87 0.39
NISA !1.88 0.06 !1.37 0.17
Table 10
Performance comparison-ISO 9002 two related samples tests certi"cation age: at least 2 years (N"33)
Variable Sign test Wilcoxon signed rank test Test statistic p-value Test statistic p-value
OITA !0.70 0.49 !0.30 0.78
NITA !0.35 0.73 !0.15 0.89
SATA !2.09 0.04 !1.99 0.05
OISA 0.00 1.00 !0.35 0.74
NISA !0.35 0.73 !0.99 0.33
4. Final comments
The paper conducted an empirical study com-paring the performance of "rms which have re-ceived ISO 9000 certi"cates with a control group of
"rms which have not been certi"ed. For that pur-pose,"ve di!erent indicators were considered and non-parametric tests were computed. As a rule, the evidence indicates that no di!erential levels of
per-formance can be detected across the two groups. This result is sustained even if we study sub-groups by certi"cate type (9001 or 9002) or by certi"cation age. Despite the strong evidence, it is possible to question the use of accounting indicators. In fact, ideally one would be interested in comparing the productive e$ciency of "rms in the di!erent groups. This line of research is problematic as data availability may pose a serious restriction, espe-cially concerning data on input quantities.
Finally, it is worth mentioning another research topic that deserves further investigation. The con-nection between quality programs such as TQM or just-in-time schemes (JIT) and ISO certi"cation requires additional studies, should the necessary data on those quality programs become available.
Acknowledgements
The authors would like to thank Heitor Esteva8o from ABNT for kindly providing part of the data used in the present study.
References
[1] D.A. Garvin, Managing Quality: The Strategic and Com-petitive edge, The Free Press, New York, 1988.
[2] M.L. Dertouzos, R.K. Lester, R.M. Solow, Made in Amer-ica, Regaining the Productive Edge, MIT Press, Cambridge, MA, 1989.
[3] H. Leibenstein, Allocative e$ciency vs. &X-e$ciency', American Economic Review 56 (1966) 392}415.
[4] J.M. Barron, K.P. Gjerde, Who adopts total quality man-agement (TQM): Theory and an empirical test, Journal of Economics and Management Strategy 5 (1996) 69}106. [5] G.S. Easton, S.L. Jarrel, The e!ects of TQM on corporate
performance: An empirical investigation, Journal of Busi-ness 71 (1998) 253}307.
[6] B.E. Withers, M. Ebrahimpour, N. Hikmet, An exploration of the impact of TQM and JIT on ISO 9000 registered companies, International Journal of Production Economics 53 (1997) 209}216.
[7] B.M. Barber, J.D. Lyon, Detecting abnormal operating performance: The empirical power and speci"cation of test statistics, Journal of Financial Economics 41 (1996) 359}399.
[8] T.P. Hettmansperger, Statistical inference based in ranks, Wiley, New York, 1984.