AUTOMATED CLASSIFICATION OF LAND COVER USING LANDSAT 8 OLI
SURFACE REFLECTANCE PRODUCT AND SPECTRAL PATTERN ANALYSIS
CONCEPT - CASE STUDY IN HANOI, VIETNAM
Duong Nguyen Dinh
Institute of Geography, Vietnam Academy of Science and Technology, 18 Hoang Quoc Viet Rd., Cau Giay, Hanoi, Vietnam – [email protected]
Commission VIII, WG VIII/8
KEY WORDS: Land cover, Landsat 8 surface reflectance, pattern analysis, automated classification
ABSTRACT:
Recently USGS released provisional Landsat 8 Surface Reflectance product, which allows conducting land cover mapping over large composed of number of image scenes without necessity of atmospheric correction. In this study, the authors present a new concept for automated classification of land cover. This concept is based on spectral patterns analysis of reflected bands and can be automated using predefined classification rule set constituted of spectral pattern shape, total reflected radiance index (TRRI) and ratios of spectral bands.
Given a pixel vector = { , , , , , } where b1 , b2,...,b6 denote bands 2, 3, ...,7 of OLI sensor respectively. By using the
pixel vector B6 we can construct spectral reflectance curve. Each spectral curve is featured by a shape, which can be described in
simplified form of an analogue pattern, which is consisted of 15 digits of 0, 1 and 2 showing mutual relative position of spectral vertices. Value of comparison between band i and j is 2 if bj>bi, 1 if bj=bi and 0 if bj<bi. Simplified spectral pattern is defined by 15
digits as , , , , , , , , , , , , , , , where mi,j is result of comparison of reflectance
between bi and bj and has values of 0, 1 and 2. After construction of SSP for each pixel in the input image, the original image will be
decomposed to component images, which contain pixels with the same SRCS pattern. The decomposition can be written analytically by equation = ∑ where A stands for original image with 6 spectral bands, n is number of component images decomposed from A and Ckis component image. For this study, we use Landsat 8 OLI reflectance image LC81270452013352LGN00 and
LC81270452015182LGN00. For the decomposition, we use only six reflective bands. Each land cover class is defined by SSP code, threshold values for TRRI and band ratios. Automated classification of land cover was realized with 8 classes: forest, shrub, grass, water, wetland, develop land, barren and others. This paper provides a preliminary research result on application of multispectral image decomposition using simplified spectral pattern for classification of land cover for Hanoi area.
1. INTRODUCTION
Land use and land cover mapping is very important in global and regional environment study. Land use and land cover are pivotal data in various study such as earth-atmosphere interactions and biodiversity loss, sustainable development and human responses to global change and are important for integrated modelling and assessment of environmental issues in general (Turneret al., 1995). Land cover mapping by remotely sensed data is commonly carried out by either supervised or unsupervised classification. Both approaches require large amount of knowledge and skills of analysts about land cover conditions and the utilization of the specific software.
Recently requirement of automation of classification of land cover is getting gradually important, especially when NASA and ESA started to open all archived image data freely to public without any cost.
A novel and innovative automated processing environment for classification of land use and land cover by framework TWOPAC ( TWinned Object and Pixel based Automated classification Chain) was successfully implemented and used with several remotely sensed data as MODIS, SPOT, Landsat and Aster (Huth et al., 2012). There is a report on automated land cover mapping and independent change detection with Landsat TM and ETM+ data (Verhegghen etal., 2010). The study proposed method on combination of unsupervised
classification and segmentation to support forest mapping in
Africa. Another study on use of LIDAR together with high
spatial resolution multispectral image data for automatic classification of land cover has been reported (Syed et al., 2005).
In this paper, the author presents novel approach on fully automated classification of land cover using the surface reflectance product of Landsat 8 OLI image data. The proposed concept is based on application of simplified spectral patterns SSP and implemented with Landsat 8 OLI data observed in 2013 and 2015 for Hanoi, Vietnam area.
2. MATERIAL AND METHODS 2.1 Material
In this study, surface reflectance product of Landsat 8 OLI
scenes LC81270452013352LGN00 and
LC81270452015182LGN00 was used. The surface reflectance product is at this time a provisional and is provided by USGS through website EarthExplorer by ordering. The Landsat 8 surface product was processed by the NASA GFC internal algorithm and at this moment, it is only provisional product. The SR data is packed in GeoTIFF format, which common format for every image analysis system.
2.2 Method
Only six reflective bands of OLI were used for classification. They are band 2, 3, 4, 5, 6, and 7. Reflectance values of every pixel formulates spectral pattern as showed in Figure 2. Different land cover objects have different spectral pattern due to spectral characteristics of the materials.
To use spectral pattern in classification, we transform the spectral pattern to simplified spectral pattern SSP, which is defined by a string of 15 digits showing relation among reflectance values in each spectral bands.
Figure 1. False colour composite bands 543: RGB of the scenes LC81270452013352LGN00 (left) and
LC81270452015182LGN00 (right). Hanoi city is located in right-bottom corner. The LC81270452013352LGN00 is almost cloud free while the LC81270452015182LGN00 is affected by
thin cloud
Figure 2. Spectral pattern of barren land in OLI image data. Vertical axis shows reflectance values and horizontal axis
shows OLI reflective band number
Given a pixel vector = { , , , , , } where b1,
b2,...,b6 denote bands 2, 3, ...,7 of OLI sensor respectively.
Value of comparison between band i and j is 2 if bj>bi, 1 if bj=bi
and 0 if bj<bi. Simplified spectral pattern SSP is defined by 15
digits as
, , , , , , , , , , , , , , ,
where mi,j is result of comparison of reflectance between bi and
bj and has values of 0, 1 and 2.
Similar land cover objects have the same simplified spectral pattern. To classify a OLI surface reflectance product we need to develop at first a database of SSP and corresponding land cover type. To further separate objects which have the same SSP we use parameters in form of arithmetic combination of bands. By this way, each land cover object is digitally defined by a structure:
Class Full name of class SSP Simplified spectral pattern
Thresholds of TRRI or ratios of spectral bands Code Land cover code of class
Color R,G,B to display the class Name Short name
End Full name of class
This structure defines evergreen forest. T1 TRRI index (Duong 1998) computed for bands 2, 3 and 4. After classification, the pixel is labelled by code 42 and displayed by colour red=0, green=176 and blue=80.
In OLI scene, there are many SSP. Some SSP have high pixel frequency and the other low frequency. There are many SSP have frequency of one pixel only. The database is created for dominating SSP only. Therefore, after classification many pixels remain unknown. To classify the unknown pixel we use spectral matching technique. We compute spectral similarity values between the unknown pixel and known class which was defined in database. The unknown pixel will be assigned to class with smallest spectral similarity value SSV. SSV is computed by the following procedure (Homayouni 2004).
= 1 (1)
Where Ed is normalized Euclidian distance between the unknown pixel and a land cover class. ρ is the Pearson statistical correlation. They are computed by formulas:
=
(2)
= (3)
= 11 ∑ (4)
The spectral matching is carried out for all unknown pixels.
Figure 2. Classified image without filling of unknown pixels (left) and with filling of unknown pixels by spectral matching
(right)
3. RESULTS
To implement automated classification of land cover, we developed software running in MSDOS command mode. The program requires two input files: metadata file of the OLI surface reflectance product and a table of land cover The International Archives of the Photogrammetry, Remote Sensing and Spatial Information Sciences, Volume XLI-B8, 2016
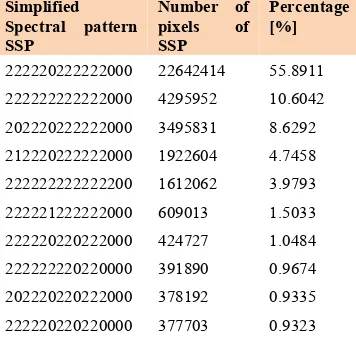
classification definition. The table of land cover definition contains 71 subclasses ranging from water to barren land. The final land cover result, however, has less number of classes such as water, wetland, forest, shrub land, grassland, barren land, cloud, and cloud shadow. Though there are 999 SSP in the selected scene, but the first 30 SSP occupies 96.3% of total number of pixels in the scene. The table of land cover definition was developed using only few SSP, which dominates pixel population of the given scene. Table 1 shows the most dominating SSP in the scene LC81270452013352LGN00.
Simplified
222220222222000 22642414 55.8911 222222222222000 4295952 10.6042 202220222222000 3495831 8.6292 212220222222000 1922604 4.7458 222222222222200 1612062 3.9793 222221222222000 609013 1.5033 222220220222000 424727 1.0484 222222220220000 391890 0.9674 202220220222000 378192 0.9335 222220220220000 377703 0.9323
Table 1. Dominating SSP in the scene LC81270452013352LGN00
Pixels, that are not defined in the table of class definition, are filled after classification by spectral matching using the spectral similarity value.
Part of the table of class definition is showed below.
Class Open Water – Clear water
Sr_code 000000000000000
Code 13 Color 0,0,255 Name Water
End Open Water – Clear water Class Open Water – Turbid water
Sr_code 000000000200000
Code 14 Color 0,0,255 Name Water
End Open Water – Turbid water Class Cloud
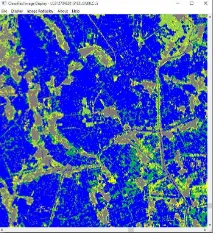
When the table of class definition is established, it can be used for classification of any Landsat 8 OLI surface reflectance scenes. Figure 3 shows result of automated classification of land cover for the scene LC81270452013352LGN00 and LC81270452015182LGN00.
4. DISCUSSION
The concept of automated classification proposed in this paper is based on simplified spectral patterns. The spectral pattern in general and simplified spectral pattern in particular can be considered as image invariant, which does not vary with location and time. This method of classification differs from conventional supervised classification technique, in that training is required for every scene and training data is very subjective and depends very much on skill of an operator. The automated classification by SSP requires development of class definition table. However, after the class definition table has been established, it can be applied for any other Landsat OLI scenes. Because classification of land cover is carried out using spectral pattern, so fine objects can be well classified.
Figure 3. Classified image of the scene LC81270452013352LGN00 (left) and LC81270452015182LGN00 (right).
Forest Barren land Developed land
Shrub land Grass land Water
Figure 4 shows example of classification of small islands of Sword Lake of Hanoi.
Figure 4. Good classification of small object by SSP concept. Example with Ngoc Son temple and Thap Rua of the Sword
lake in Hanoi. Classified image (left) and image from the GoogleEarth (right)
Figure 5 shows very fine classification of small pathways in crop field.
Figure 5. Very detail linear feature can be classified. Example for pathways in rice field
Theoretically, surface reflectance of a stable object does not change for a given remote sensor. However, in practice we observe slight changes of surface reflectance of built up in Hanoi when we compare data collected in 2013 and 2015. The changes of surface reflectance causes slight changes in classification results as shown in Figure 6.
Figure 6. Comparison of automated classification results of scenes LC81270452013352LGN00 (left) and
LC81270452015182LGN00 (right).
The scene LC81270452013352LGN00 was observed in Dec. 18, 2013. This is dry season for Hanoi area so rice field is after harvest and appears as barren land. The scene LC81270452015182LGN00 was observed in Jul. 1, 2015. This time is rainy season so we can see a lot of water surface in
classification result. These parcels should be classified as cropland. Seasonal change of land cover causes difficulties in automated classification in that only static component of land cover is taken into consideration while dynamic component can be retrieved only if we use temporal data series. Inconsistency of surface reflectance product causes incorrectness in classification of objects, which have the same simplified spectral pattern. For example, in Figure 6, developed land of Hanoi is classified more to barren land for the scene of 2015, while for image in 2013, the developed land is correctly classified.
5. CONCLUSION
The paper presents the first attempt of automation of classification of land cover using the provisional surface reflectance product of Landsat 8 OLI. The study has been conducted in Hanoi city and surrounding area. The automation relies on the table of class definition in which every land cover object is define by parameters such as simplified spectral patterns, TRRI and ratios among spectral bands. The table of class definition, when has been developed, can be used for any Landsat 8 OLI surface reflectance product. The automation of classification can help mapping land cover, which reflects physical status of ground in the time of observation. To develop final land cover map there is a need to combine more single date land cover map created within one or two year period depending on availability of cloud free scenes.
ACKNOWLEDGEMENTS
This research is funded by the Vietnam National Foundation for Science and Technology Development (NAFOSTED) under grant number 105.08-2014.14
.
REFERENCES
Duong N. D., 1998. Total reflected radiance index – An index to support land cover classification. Proceedings of the 18th Asian conference on remote sensing, Manila, Philippines.
Duong, N. D. (2000). Land cover category definition by image
invariants for automated classification. International archives of
photogrammetry and remote sensing, 33(B7), 985-992.
Homayouni, S., & Roux, M. (2004, July). Hyperspectral image
analysis for material mapping using spectral matching. In ISPRS
Congress Proceedings.
Huth, J., Kuenzer, C., Wehrmann, T., Gebhardt, S., Tuan, V. Q., & Dech, S. (2012). Land cover and land use classification with TWOPAC: Towards automated processing for pixel-and
object-based image classification. Remote Sensing, 4(9), 2530-2553.
Syed, S., Dare, P., & Jones, S. (2005, September). Automatic classification of land cover features with high resolution imagery and lidar data: an object-oriented approach. In Proceedings of SSC2005 spatial intelligence, innovation and praxis: the national biennial conference of the spatial sciences institute(pp. 512-522). Melbourne: Melbourne: Spatial Science Institute.
Turner, B. L., Skole, D. L., Sanderson, S., Fischer, G., Fresco, L., & Leemans, R. (1995). Land-use and land-cover change.
Science/Research Plan. Global Change Report (Sweden).
USGS 2015. Landsat Surface Reflectance High Level Data Products. http://landsat.usgs.gov/cdr_lsr.php
Verhegghen, A., Defourny, P., Ernst, C., & Beuchle, R. (2010). Automated land cover mapping and independent change detection in tropical forest using multi-temporal high resolution
data set. International Archives of the Photogrammetry, Remote
Sensing and Spatial Information Sciences, 38.