EXTRACTION OF FLOODED AREAS DUE THE 2015 KANTO-TOHOKU HEAVY
RAINFALL IN JAPAN USING PALSAR-2 IMAGES
F. Yamazaki a, *, W. Liu a
a
Chiba University, Graduate School of Engineering, Chiba 263-8522, Japan - (yamazaki, wenliu) @tu.chiba-u.ac.jp
Commission VIII, WG VIII/1
KEY WORDS: PALSAR-2, Flood Extraction, Heavy Rainfall, SAR, Backscattering Coefficient
ABSTRACT:
Triggered by two typhoons, heavy rainfall hit Kanto and Tohoku regions of Japan from September 9 to 11, 2015. Increased river water by the continuous rainfall overflowed and destroyed several river banks and caused damaging floods in wide areas. PALSAR-2 onboard ALOS-2 satellite carried out emergency observation for the impacted areas during and after the heavy rainfall. In this study, two pre-event and four co- and post-event PALSAR-2 images were used to extract the inundation area in Joso city, Ibaraki prefecture. First, using the pre-event SAR intensity image and a detailed topographic map, the backscattering coefficient of river water was investigated. Then the flooded areas were extracted by a common threshold value of backscatter for water bodies in the six temporal images. The colour composite of the sigma naught values was also made to visualize pixels that had been converted from ground to water. Finally, the extracted results were compared with those from the visual interpretation of aerial photographs and field survey reports. This comparison revealed that the accuracy of the flood extraction was fairly good for agricultural lands and non-urban land uses. But for built-up urban areas, it was not easy to extract water body since radar illumination did to reach the ground (water) surface.
* Corresponding author
1. INTRODUCTION
Satellite remote sensing is a useful tool for observing wide areas on the Earth's surface repeatedly. Remote sensing is classified by two categories based on the type of sensors: the passive remote sensing (mainly optical and thermal sensors) and the active remote sensing (mainly radar sensors). Optical satellite systems only work in the daytime and cannot observe objects under cloud-cover. On the contrary, radar systems such as a Synthetic Aperture Radar (SAR) overcome this problem. Hence it is widely used in various emergency situations due to natural hazards, such as earthquakes, tsunamis, volcanic eruptions, tropical cyclones and floods (International Charter, 2016).
Three frequency bands of microwave have been often used in satellite SAR sensors: X-band (TerraSAR-X, COSMO-SkyMed), C-band (Envisat ASAR, Radarsat series, Sentinel-1), and L-band (ALOS PALSAR, ALOS-2 PALSAR-2). The X-band has a short wavelength of 2.5 - 3.7 cm and suitable for observing urban environments while the L-band has a longer wavelength of 15 - 30 cm and suitable for observing natural land surfaces. Succeeding ALOS PALSAR, which terminated in April 2011, PALSAR-2 onboard ALOS-2 started its mission in May 2014. The L-band SAR data acquired from PALSAR-2 have been used for various emergency situations, such as 2015 Gorkha, Nepal earthquake (GSI, 2015a; Liu and Yamazaki, 2015), 2016 Kuchinoerabu-Island volcanic eruption (JAXA, 2015a), and floods in various countries (JAXA, 2016).
A heavy rainfall hit Kanto and Tohoku regions of Japan from September 9 to 11, 2015 and it caused destructive floods in wide areas. PALSAR-2 carried out emergency observation for the impacted areas during and after the heavy rainfall. In this study, pre-, co- and post-event PALSAR-2 images were used to
extract inundation areas in Joso city, Ibaraki prefecture, Japan. The extracted results were compared with those from visual interpretation of aerial images and field survey reports.
2. THE STUDY AREA AND DATA USED
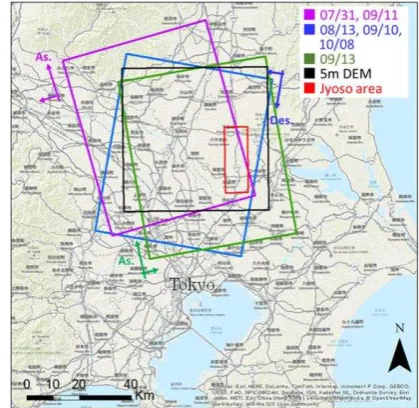
Joso city is located in about 50 km to the north-western direction from the central Tokyo, as shown in Figure 1. The study area is shown by the red square in the figure. In this area, two major rivers, the Kinugawa river (west) and the Okai river (east), flow from the north to the south.
Figure 1. Coverage of PALSAR-2 data in the Kanto region of Japan and the study area (Joso city) in red square
Affected by two typhoons, a linear heavy-rain cloud stayed for several hours in the upstream of the Kinugawa river, as shown in Figure 2. The maximum cumulative rainfall from September 9 to 11, 2015 exceeded 600 mm in the upstream area, which is the record breaking volume in this region.
The water level of the Kinugawa river in Joso city increased rapidly in the early morning of September 10. An overflow from the river bank was reported by the city government at Wakamiyado district (Square I in Figure 3) at 7:40 am. The flood-water went down in the city from the north to the south. A failure of the river bank finally occurred at 12:50 in the afternoon at Kamimisaka district (square II in Figure 3) and then almost all the area in between the two rivers became under water quickly.
The observation conditions of the six PALSAR-2 data were listed in Table 1. The incident angles were almost the same, 35.3° at the centre of the images. But the paths were grouped into three, ascending paths A and C with 344° heading angle clockwise from the north, and descending path B with 195° heading angle, as shown Figure 1. The paths B and C were right-look while the path A was left-look. The ascending paths observed the affected area at night-time while the descending path at daytime, just before the noon in JST.
All the data were captured with HH polarization in the high-resolution mode. The six imagery data were provided as the range and single-look azimuth compressed data with the processing level 1.1, which were represented by the complex I and Q channels to preserve the amplitude and phase information (JAXA, 2014). Several pre-processing steps were carried out using ENVI/SARscape software.
A multi-looking process with two looks was applied to both the range and azimuth directions, and then the resolution became 4.2 m in the azimuth and 2.9 m in the slant range directions. A 5-m digital elevation model (GSI, 2016) was introduced to project the data to a WGS84 reference ellipsoid with a
was also carried out to transform the amplitude data into the backscattering coefficient (sigma naught) values. The enhance Lee filter with 5x5 pixels was applied to reduce speckle-noise.
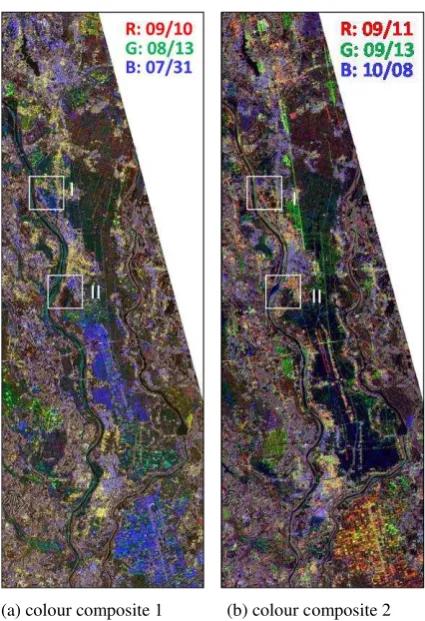
In order to observe the flood situation visually, two colour composite images were made as shown in Figure 3. The left image shows the composite of the two pre-event dates and one when the flood just started. The right image shows the composite of three dates in and after the flood, which depicts the reduction of water in time.
Table 1. Acquisition conditions of the six ALOS-2 images used in this study
3. FLOOD SITUATION IN JOSO CITY
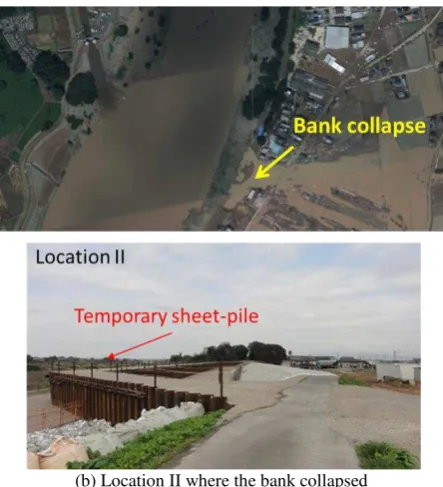
The flood situation of Joso city, bounded by the Kinugawa and Okai rivers, was investigated from the multi-temporal PALSAR-2 images. Figure 4 shows aerial images taken on September 11, 2015 (GSI, 2015b) and ground photos taken by
(a) colour composite 1 (b) colour composite 2
Figure 3.Multi-temporal colour composites of PALSAR-2 images for different combinations
Figure 2. One-hour rainfall distribution map on 21:00, Sept. 9, 2015. A strip of heavy rainfall can be observed along the Kinugawa river catchment (CEReS, 2015)
(a) Location I where overflow occurred
(b) Location II where the bank collapsed
Figure 4.Aerial images taken by GSI on September 11, 2015 (up) and ground photos taken by the authors’ field survey on October 29, 2015 (down) for the two major damage sites.
At the site I, the overflowed water washed away solar panels placed inside the river embankments. When we visited the site, a temporary bank was already built and the removal of the damaged panels was on-going. At the site II, the river bank was collapsed for a length of 200 m (MILT, 2015). When we visited the site, emergency restoration using sheet-piles and a temporary embankment has already completed.
Figure 5 shows the colour composite of three PALSAR-2 images at the sites. The damaged banks and new sheet-piles can be observed in the figure.
4. FLOOD MONITORING FROM PALSAR-2 DATA
To extract flooded areas, the land-cover classification in the pre-flood time should be considered because there were a lot of water bodies in the study area including rivers, channels, and paddy fields. Figure 6 shows the 5-m DEM (GIS, 2016) and the extracted water areas based on it. These original water areas were determined by the condition that an elevation lower than 41.0 m with an object size larger than 0.01 km2.
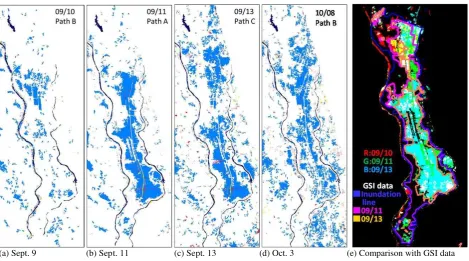
The extraction of inundated areas was carried out for the PALSAR-2 images during and after the flood. Figure 7 shows the extracted flooded areas on September 10, 11, 13 and October 8, 2015. The total area of flood-water was the maximum on September 11 in actual observations. But due to the effects of SAR observation conditions, the extracted water distributions from the SAR data were slightly different. Built-up urban areas could not be extracted because radar did not reach to the ground (water) surfaces there. The path C estimated somewhat different water areas because of its right-look condition. Note the paths A and B were left look.
Figure 6. GSI’s 5-m DEM (a) used to extract original water bodies and the extracted result (b)
I
II
R: 10/08 G: 09/10
B: 08/13
Figure 5.Multi-temporal colour composites of PALSAR-2 images for the two major damage sites
The our extraction results are compared with those by visual inspection of aerial images (GSI, 2015b) in Figure 7 (e), where the GSI’s truth data are shown by boundary lines. It is observed that our results agree fairly well with the truth data. There exist differences in observation times, especially for the images on Sept. 11 and 13. On these days, PALSAR-2 images were acquired at night-time while the aerial images at daytime.
5. CONCLUSIONS
In this study, the inundation area in Joso city due to the September 9-11, 2015 Kanto-Tohoku heavy rainfall was extracted using two pre-event and four co- and post-event ALOS-2 PALSAR-2 images. First, using the pre-event SAR intensity image and a detailed topographic map, the backscattering coefficient of river water was investigated. Then the flooded areas were extracted by a common threshold value of backscatter for water bodies in the six temporal images. The colour composite images were also made to visualize pixels that had been converted from ground to water. Finally, the extracted results were compared with those from the visual interpretation of aerial photographs and field survey reports. This comparison revealed that the accuracy of the flood extraction was fairly good for agricultural lands and non-urban land uses. But for built-up urban areas, it was not easy to extract water body since radar illumination did to reach the ground (water) surface. In the future research, this kind of omission errors will be eliminated by introducing a DEM and filling building footprints surrounded by water as flooded pixels.
ACKNOWLEDGEMENTS
The ALOS PALSAR-2 data used in this study are owned by Japan Aerospace Exploration Agency (JAXA), and were provided through the ALOS-2 research program (RA4, PI No. 1503) and the image analysis working group for large-scale disasters of JAXA.
This study was financially supported by Grant-in-Aid for Scientific Research (Project numbers: 15K16305, 24241059) and Core Research for Evolutional Science and Technology (CREST) program by the Japan Science and Technology Agency (JST) “Establishing the most advanced disaster reduction management system by fusion of real-time disaster simulation and big data assimilation (Research Director: Prof. Shunichi Koshimura of Tohoku University)”.
REFERENCES
Center for Environmental Remote Sensing (CEReS), Chiba University 2015. Natural disaster information - Rainfall in Kitakanto and Tohoku, HIMAWARI-8's movie on Youtube Official Channel. http://www.cr.chiba-u.jp/~database-jp/wiki/wiki.cgi?page=20150908_heavyrain_Kitakanto-Tohoku (20 March, 2016)
Geospatial Information Authority of Japan (GSI), 2015a. The 2015 Nepal Earthquake: Crustal deformation detected by ALOS-2 data. http://www.gsi.go.jp/cais/topic150429-index-e.html (20 March, 2016)
Geospatial Information Authority of Japan (GSI), 2015b. The September 2015 Kanto-Tohoku heavy Rainfall information. http://www.gsi.go.jp/BOUSAI/H27.taihuu18gou.html (3 March, 2016)
Geospatial Information Authority of Japan (GSI), 2016. Base map download service. http://fgd.gsi.go.jp/download/ (30 March, 2016)
International Charter -Space & Major Disasters, 2016. Charter Activations. https://www.disasterscharter.org/web/guest/ activations/charter-activations (20 March, 2016)
Japan Aerospace Exploration Agency (JAXA), 2014. ALOS-2 / Calibration Result of JAXA standard products. http://www.eorc.jaxa.jp/ALOS-2/en/calval/calval_index.htm (20 (a) Sept. 9 (b) Sept. 11 (c) Sept. 13 (d) Oct. 3 (e) Comparison with GSI data
Figure 7. Extracted water areas from the PALSAR-2 images and comparison of the results with the GSI’s visual inspection data
Japan Aerospace Exploration Agency (JAXA), 2015a. Observation of Kuchinoerabu-Island volcanic eruption. http://www.eorc.jaxa.jp/ALOS-2/img_up/jdis_pal2_kuchino erabu_20150529.htm (20 March, 2016)
Japan Aerospace Exploration Agency (JAXA), 2015b. Disaster Monitoring 2011-. http://www.eorc.jaxa.jp/ALOS/en/gallery/ lib_data/3disaster.htm (20 March, 2016)
Japan Aerospace Exploration Agency (JAXA), 2016. Disaster Monitoring 2011-. http://www.eorc.jaxa.jp/ALOS/en/gallery/ lib_data/3disaster.htm (20 March, 2016)
Liu, W., and Yamazaki, F., 2015. Damage detection in the 2015 Nepal earthquake using ALOS-2 satellite SAR imagery. Proc. of the Ninth Pacific Conference on Earthquake Engineering, Sydney, Australia, Paper No. 205, 8p.
Ministry of Land, Infrastructure, Transport and Tourism (MLIT), 2015. Restoration from heavy rainfall in September, http://www.ktr.mlit.go.jp/ktr_content/content/000632707.pdf (29 March, 2016)