MAPPING SECONDARY FOREST SUCCESSION ON ABANDONED AGRICULTURAL
LAND IN THE POLISH CARPATHIANS
N. Kolecka a, *, J. Kozak a, D. Kaim a, M. Dobosz a, Ch. Ginzler b, A. Psomas b
a
Institute of Geography and Spatial Management, Jagiellonian University, Krakow, Poland - (nkolecka, jkozak, dkaim, mdobosz)@gis.geo.uj.edu.pl
b
WSL, Swiss Federal Research Institute WSL, Zuercherstrasse 111, 8903 Birmensdorf, Switzerland – (christian.ginzler, achilleas.psomas)@wsl.ch
Commission VIII, WG VIII/8
KEY WORDS: LiDAR, vegetation height, vegetation cover, segmentation, Agricultural Land Abandonment, Forest Succession
ABSTRACT:
Land abandonment and secondary forest succession have played a significant role in land cover changes and forest cover increase in mountain areas in Europe over the past several decades. Land abandonment can be easily observed in the field over small areas, but it is difficult to map over the large areas, e.g., with remote sensing, due to its subtle and spatially dispersed character. Our previous paper presented how the LiDAR (Light Detection and Ranging) and topographic data were used to detect secondary forest succession on abandoned land in one commune located in the Polish Carpathians by means of object-based image analysis (OBIA) and GIS (Kolecka et al., 2015). This paper proposes how the method can be applied to efficiently map secondary forest succession over the entire Polish Carpathians, incorporating spatial sampling strategy supported by various ancillary data. Here we discuss the methods of spatial sampling, its limitations and results in the context of future secondary forest succession modelling.
1. INTRODUCTION
Since the 19th century Europe has been experiencing an increase in forest cover due to afforestation and forest expansion on abandoned agricultural land. Secondary forest succession has played a significant role in land cover changes in European mountains over the past several decades (MacDonald et al., 2000; Munteanu et al., 2014), including the Polish Carpathians (Kozak, 2010). Due to various environmental and economic consequences, such as biodiversity, climate change, forest and agriculture management (Hansen et al., 2010), quantification of secondary forest succession on abandoned land (SFSAL) is of high importance.
Secondary forest succession starts quickly after land abandonment, and in mountainous areas dense grass communities (the first signs of succession) can be observed within 2 years, and in less than 5 years nearly 30% of trees germinate (Kostuch, 2003; Tasser et al., 2007). In the Polish Carpathians, secondary forest succession typically occurs on steep slopes, in more remote and inaccessible areas, and near forest edges, and is a spatially dispersed process, due to small land parcel sizes (Kolecka et al., 2015; Kozak, 2010). Thus, the large-scale patterns of SFSAL are difficult to map over large areas.
Several large-scale studies used remote sensing optical data to document forest succession in mountainous regions (Griffiths et al., 2014; Hostert et al., 2011; Kuemmerle et al., 2008; Wężyk and Kok, 2005). Kuemmerle et al. (2008) and Hostert et al. (2011), who mapped farmland abandonment from Landsat imagery, achieved relatively high accuracy of 91% and 80%, respectively. However, difficulties in discrimination of the subtle land cover changes from other land uses, e.g.
gardens, orchards, tree nurseries or even parks, may negatively affect the results (Blatt et al., 2005; Kozak, 2010).
In the last decade, airborne LiDAR (Light Detection and Ranging) data have experienced increasing popularity in accurate quantification of vegetation using LiDAR-derived metrics that described three-dimensional vegetation structures (Eysn et al., 2012; Maier et al., 2008; van Ewijk et al., 2011). Several authors conducted local-scale case-specific studies on forest succession (Falkowski et al., 2009; Martinuzzi et al., 2009). Kolecka et al. (2015) incorporated object-based image analysis (OBIA, (Blaschke et al., 2014)) to map SFSAL, and indicated that the method can be applied without modifications to large-scale analysis.
The aim of our study was therefore to extend findings of Kolecka et al. (2015), elaborating methods allowing efficient mapping of SFSAL for a large mountainous area based primarily on the airborne laser scanning (ALS) data. Here we attempt to elaborate a rational sampling scheme for ALS data that on one hand would reduce computational load and, on the other, ensure representativeness in the diverse mountain ecosystem. As a case study we used the entire Polish Carpathians.
2. MATERIALS AND METHODS
2.1 Study area
The study area covered the entire Polish Carpathians (20,000 km2, 300 m – 2,500 m a.s.l., (Balon et al., 1995)), that is the northernmost part of the Carpathian arc (Figure 1). The landscape consists of a mosaic of forests (40% in 2000, (Kozak, 2010)) and mostly small and dispersed agricultural parcels (Musiał and Wojewodzic, 2015). Settlements are located mainly in valleys. Long land use history of the region
has been influenced by political, economic and demographic changes (Kozak, 2010). The Carpathian Convention (CC, 2015) lists 200 municipalities within the entire Polish Carpathians. Some of them are divided into rural and urban parts, making a total of 236 administrative units (referred to as communes) in the study area.
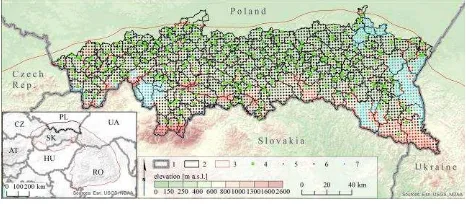
Figure 1. Study area, availability and spatial distribution of the final sample; 1 – national borders, 2 – boundaries of administrative units, 3 – physiographical boundary of the Carpathians, 4 – sampled tiles, 5 – excluded tiles, 6 – tiles available for sampling, 7 – tiles not covered with ALS
data
2.2 Data
We used (1) communal boundaries from the National Boundaries Register (PRG) available from CODGiK (the Main Centre of Geodetic and Cartographic Documentation in Poland) (CODGiK, 2016) website as a vector layer, (2) CORINE Land Cover 2006 database (CLC, 2006), (3) national park boundaries and (4) physiographical boundary of the Carpathians downloaded from GDO (The General Directorate for Environmental Protection) (GDO , 2015) databases as vector layer, (5) tiling system of the available LiDAR data provided by CODGiK via WMS (Web Map Service), (Geoportal, 2016), and (6) SRTM DEM (digital elevation model) (SRTM, 2016).
CLC provided pan-European land cover data including 44 classes, collected using a minimum mapping unit of 25 ha. 27 land cover classes occurred in the Polish Carpathians. The LiDAR point clouds at the moment of data order (March 2014) covered 86% of the study area. They were organized into tiles of 1 x 1 km, corresponding to map sheets in scale of 1:2 500, approximately 16,000 tiles. SRTM DEM of 100 m spatial resolution provided generalized description of topography over the entire Polish Carpathians.
2.3 Sampling strategy development
Due to the data volume we were not able to process the entire ALS dataset, as each tile of 1 x 1 km had approximately 0.7 GB. Therefore we focused on a selection of a representative sample. As the Carpathian communes vary in geographical and socio-economic conditions and represent a basic unit for which socio-economic data are gathered and made available, we
outside the study area, as well as tiles with unavailable LiDAR point clouds (Figure 1). In the next step we used a set of spatial constraints to exclude areas where secondary forest succession either does not occur due to land cover, like water bodies and forests, or was not meaningful from the viewpoint of our study (e.g., urban areas). Tiles that were covered by more than 80% of forest core, or more than 40% of urban areas or more than 40% of water bodies were excluded from sampling. Urban areas and water bodies extents were obtained directly from the CLC dataset. Forest core was determined from CLC forest classes using Morphological Spatial Pattern Analysis (MSPA) (Soille and Vogt, 2009) implemented in the GuidosToolbox software (Vogt, 2016). MSPA is a sequence of mathematical morphological operations that allow to classify geometrical properties of discrete patches or their parts in a raster thematic layer. For instance, for a given land cover class of interest, a core is a part of the class area being further from its boundary than an arbitrary threshold (Soille and Vogt, 2009). To delineate core forests, we used the threshold of 100 m (one pixel width of CLC data), excluding then tiles with dominating compact forest areas, and retaining for the sampling tiles with more fragmented forests within the agricultural matrix. In the next step, we excluded tiles that had at least 80% of their area within national parks, due to the fact that agricultural activities in the national parks are strongly limited by conservation goals, and therefore differ significantly from agricultural activities outside the parks. Finally, a stratified random sampling was performed using the commune layer as a stratum.
Figure 2. Workflow of the sampling strategy development
2.4 Sample characteristics
Sampled tiles were characterized according to biophysical and locational features, in particular those that could be used later on in modelling SFSAL as explanatory variables (mean elevation of the tile – ELEV, mean slope of the tile – SLP, mean distance to the commune centre – distCC, and difference in elevation between mean tile elevation and the commune centre – Zdiff). For sampled tiles we checked also proportion of forests (FC), agricultural land (AGR), and urban areas (URBAN) within the tile, using Polish topographic data in
calculated on the base of SRTM DEM due to lack of high resolution elevation data for the entire study area.
3. RESULTS
There were 3,867 2 x 2 km tiles in the study area. The constraints used in analysis reduced the number of tiles suitable for sampling by 1,164 tiles, to 2,703. Random sampling over the communes resulted in a sample size of 231 tiles, evenly distributed over the entire Polish Carpathians. In five communes (Chmielnik, Hyżne, Jabłonka, Jawornik Polski, Lipnica Wielka) no suitable tiles were found.
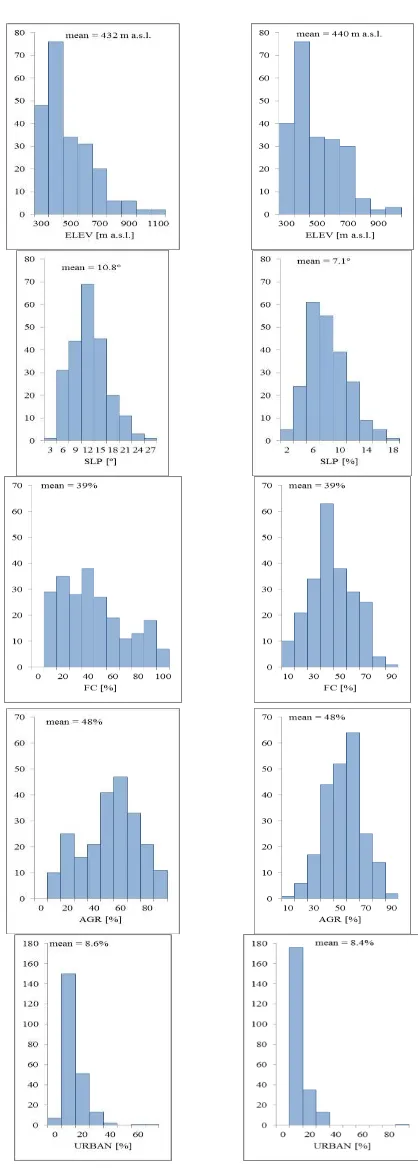
In all cases except for SLP distributions of mean values of the selected variables within tiles were similar to respective distributions in the communes (Figure 3), the same applies to mean values (ELEV – 432 and 440 m a.s.l., SLP –10.8º and 7.1º, FC – 39% and 39%, AGR – 48% and 48%, URBAN – 8.6% and 8.4%, respectively). Most selected tiles were located below 500 m a.s.l. For 25 tiles forest cover exceeded 80%, and for 2 tiles urban area exceeded 40% (Figure 3).
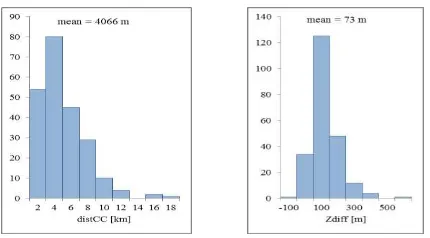
DistCC was mostly up to 8 km, with some cases exceeding 10 km. One tile was located lower than the corresponding commune centre, and one was located at significantly higher altitude, with Zdiff larger than 500 m (Figure 4).
4. DISCUSSION AND CONCLUSIONS
The main aim of this study was to extend the approach of (Kolecka et al., 2015) to efficiently map secondary forest succession on abandoned land over the entire Polish Carpathians. Spatial sampling was an important methodological issue that had to be solved prior to the analysis of ALS point cloud data. Elimination of forest core areas, built-up areas and water bodies, as well as the national parks, narrowed the analysis area to mostly agricultural land and other types of land use that might undergo land abandonment and related secondary forest succession.
The sample well represented the entire Polish Carpathians, according to natural conditions and locational features. While for most tested variables distributions of their mean tile values were similar to distributions of mean values in the Polish Carpathian communes, some discrepancies were found. Higher mean slope values for the tiles than for the communes resulted, most likely, from using for calculations of slopes in the tiles the DEM with higher spatial resolution (1 m) than that used for the communes (100 m). Slope variability in the tiles allows also further investigation of areas with both favourable and unfavorable conditions for agricultural land use. According to (Bański, 2007), agricultural machinery cannot be used when slope angle exceeds 9º-12º, and above 20º terracing becomes necessary. 149 tiles have mean slopes higher than 9º, and proportion of agricultural land with slopes >10º in 41 cases exceeds 50%.
Figure 3. Distribution of selected variables in the sample tiles (left) and communes (right)
Figure 4. Locational features of the sample tiles
The sampled tiles show also sufficient variability of locations within the communes, expressed by distCC and Zdiff distributions. Distance to the commune centres and elevation difference between the tile and the commune centre correspond to varied accessibility of the agricultural land, which was were positively verified using spatially detailed vector data. Only in some cases the accepted constraints were not met, for instance, only 2 tiles (less than 1%) had more than 40% of urban areas, and only 7 (approximately 3%) had more than 90% of forest cover, with high likelihood of having more than 80% of forest core. This is important, as using CLC significantly speeded up the sampling procedure and allowed to avoid large scale operations on high resolution land cover data sets.
ACKNOWLEDGEMENTS
The research was completed within FORECOM project (Forest cover changes in mountainous regions – drivers, trajectories and implications, PSRP-008/2010), supported by a grant from Switzerland through the Swiss contribution to the enlarged European Union.
REFERENCES
Balon, J., German, K., Kozak, J., Malara, A., Widacki, W., Ziaja, W., 1995. Regiony fizycznogeograficzne Polskich Karpat. InŚ Warszyńska, J. (Ed.), Karpaty Polskie. Uniwersytet Jagielloński, Kraków, Polska, pp. 117–130.
Bański, J., 2007. Przyrodnicze uwarunkowania gospodarki rolnej w Polsce. InŚ Grykień, S., Hasiński, W. (Eds.), Przyrodnicze Uwarunkowania Rozwoju Obszarów Wiejskich. PTG, PAN IGiPZ, Warszawa, pp. 9–18.
Blaschke, T., Hay, G.J., Kelly, M., Lang, S., Hofmann, P., Addink, E., Queiroz Feitosa, R., van der Meer, F., van der Werff, H., van Coillie, F., Tiede, D., 2014. Geographic Object-Based Image Analysis – Towards a new paradigm. ISPRS J.
–
CLC, 2006. CORINE Land Cover. URL http://clc.gios.gov.pl/ (accessed 11.16.15).
CODGiK, 2016. Centralny O rodek Dokumentacji Geodezyjnej i Kartograficznej. URL http://www.codgik.gov.pl/ (accessed 4.16.16).
Eysn, L., Hollaus, M., Schadauer, K., Pfeifer, N., 2012. Forest Delineation Based on Airborne LIDAR Data. Remote Sens., 4, pp. 762–783.
Falkowski, M.J., Evans, J.S., Martinuzzi, S., Gessler, P.E., Hudak, A.T., 2009. Characterizing forest succession with LiDAR data: An evaluation for the Inland Northwest, USA. Remote Sens. Environ., 113, 946–956.
GDO , 2015. GDO – Spatial Data. URL http://www.gdos.gov.pl/ (accessed 11.16.15).
Geoportal, 2016. Geoportal. URL http://www.geoportal.gov.pl/ (accessed 4.16.16).
Griffiths, P., Kuemmerle, T., Baumann, M., Radeloff, V.C., Abrudan, I. V., Lieskovsky, J., Munteanu, C., Ostapowicz, K., Hostert, P., 2014. Forest disturbances, forest recovery, and after socio-economic disturbances: the collapse of the Soviet Union versus Chernobyl. Environ. Res. Lett., 6, pp. 1–8. Kolecka, N., Kozak, J., Kaim, D., Dobosz, M., Ginzler, C., Psomas, A., 2015. Mapping Secondary Forest Succession on Abandoned Agricultural Land with LiDAR Point Clouds and Terrestrial Photography. Remote Sens., 7, pp. 8300–8322. Kostuch, R., 2003. Sukcesja ro linna na odłogowanych gruntach ornych. Woda- rodowisko-Obszary Wiej. rodowisko, 2, pp. 57–79.
Kozak, J., 2010. Reforesting Landscapes. Reforesting Landscapes Link. Pattern Process, Landscape Series, 10, pp. 253–273.
Kuemmerle, T., Hostert, P., Radeloff, V.C., Linden, S., Perzanowski, K., Kruhlov, I., 2008. Cross-border Comparison of Post-socialist Farmland Abandonment in the Carpathians. Ecosystems, 11, pp. 614–628.
Lieskovský, J., Bezák, P., Špulerová, J., Lieskovský, T., Koleda, P., Dobrovodská, M., Bürgi, M., Gimmi, U., 2015. The abandonment of traditional agricultural landscape in
Environmental consequences and policy response. J. Environ. Manage. 59, pp. 47–69.
Maier, B., Tiede, D., Dorren, L., 2008. Characterising mountain forest structure using landscape metrics on LiDAR-based canopy surface models. Object-Based Image Anal. Lect. Notes Geoinf. Cartogr. pp. 625–643.
Martinuzzi, S., Vierling, L. a., Gould, W. a., Falkowski, M.J., Evans, J.S., Hudak, A.T., Vierling, K.T., 2009. Mapping snags and understory shrubs for a LiDAR-based assessment of wildlife habitat suitability. Remote Sens. Environ., 113, pp. 2533–2546.
Munteanu, C., Kuemmerle, T., Boltiziar, M., Butsic, V., Gimmi, U., Kaim, D., Király, G., Konkoly-Gyuró, É., Kozak, J., Lieskovský, J., Mojses, M., Müller, D., Ostafin, K., Ostapowicz, K., Shandra, O., Štych, P., Walker, S., Radeloff, V.C., 2014. Forest and agricultural land change in the Carpathian region—A meta-analysis of long-term patterns and drivers of change. Land Use Policy, 38, pp. 685–697.
Musiał, W., Wojewodzic, T., 2015. Bariery przemian agrarnych w rolnictwie polskim - poszukiwanie rozwiązań innowacyjnych. InŚ Czyżewski, A., Klepacki, B. (Eds.), Problemy Rozwoju Rolnictwa i Gospodarki Żywno ciowej w Pierwszej Dekadzie Członkostwa Polski w Unii Europejskiej. Polskie Towarzystwo Ekonomiczne, pp. 1–11.
Soille, P., Vogt, P., 2009. Morphological segmentation of binary patterns. Pattern Recognit. Lett., 30, pp. 456–459.
SRTM, 2016. Shuttle Radar Topography Mission. URL https://lta.cr.usgs.gov/SRTM (accessed 4.15.16).
Tasser, E., Walde, J., Tappeiner, U., Teutsch, A., Noggler, W., 2007. Land-use changes and natural reforestation in the Eastern Central Alps. Agric. Ecosyst. Environ., 118, pp. 115– 129.
van Ewijk, K.Y., Treitz, P.M., Scott, N. a, 2011. Characterizing Forest Succession in Central Ontario using Lidar-derived Indices. Photogramm. Eng. Remote Sensing, 77, pp. 261–269.
Vogt, P., 2016. GuidosToolbox. http://dx.doi.org/10.13140/ RG.2.1.2633.8320
Wężyk, P., Kok, R. De, 2005. Automatic mapping of the dynamics of forest succession on abandoned parcels in south Poland. In: Strobl, J., Blaschke, T., Griesebner, G. (Eds.), Hrsg. Angewandte Geoinformatik Zum 17. AGIT-Symposium Salzburg 2005. Herbert Wichman Verlag, Heidelberg, pp. 774–779.