LINKING SATELLITE REMOTE SENSING BASED ENVIRONMENTAL PREDICTORS
TO DISEASE: AN APPLICATION TO THE SPATIOTEMPORAL MODELLING OF
SCHISTOSOMIASIS IN GHANA
M. Wrable a,*, A. Liss a,*, A. Kulinkinaa,*, M. Koch b, N. K. Biritwumc, A. Ofosud, K. C. Kosinskie, D. M. Gutea, E. N. Naumova f,*
a Dept. of Civil and Environmental Engineering, Tufts University, 200 College Ave, Medford, USA – (madeline.wrable, alexander.liss, alexandra.kulinkina, david.gute)@tufts.edu
b Center for Remote Sensing, Boston University, Boston, USA – [email protected]
c Neglected Tropical Disease Control Program, Ghana Health Service, Accra, Ghana – [email protected] d Policy, Planning, Monitoring, and Evaluation Division, Ghana Health Service, Accra, Ghana – [email protected]
e Dept. of Community Health, Tufts University, 574 Boston Avenue, Medford, USA – [email protected] f Friedman School of Nutrition Science and Policy, Tufts University, 150 Harrison Ave, Boston, USA – [email protected]
Commission VIII, WG VIII/2
KEY WORDS: Remote Sensing, Environmental Variables, Climate Classification, Spatiotemporal Analysis, Schistosomiasis Risk
ABSTRACT:
90% of the worldwide schistosomiasis burden falls on sub-Saharan Africa. Control efforts are often based on infrequent, small-scale health surveys, which are expensive and logistically difficult to conduct. Use of satellite imagery to predictively model infectious disease transmission has great potential for public health applications. Transmission of schistosomiasis requires specific environmental conditions to sustain freshwater snails, however has unknown seasonality, and is difficult to study due to a long lag between infection and clinical symptoms. To overcome this, we employed a comprehensive 8-year time-series built from remote sensing feeds. The purely environmental predictor variables: accumulated precipitation, land surface temperature, vegetative growth indices, and climate zones created from a novel climate regionalization technique, were regressed against 8 years of national surveillance data in Ghana. All data were aggregated temporally into monthly observations, and spatially at the level of administrative districts. The result of an initial mixed effects model had 41% explained variance overall. Stratification by climate zone brought the R2 as high as 50% for major zones and as high as 59% for minor zones. This can lead to a predictive risk model used to develop a decision support framework to design treatment schemes and direct scarce resources to areas with the highest risk of infection. This framework can be applied to diseases sensitive to climate or to locations where remote sensing would be better suited than health surveys.
* Corresponding authors
1. INTRODUCTION
Schistosomiasis is a debilitating infection acquired from contact with infested water bodies and caused by parasitic blood flukes of the genus Schistosoma. It infects over 200 million people worldwide, and around 779 million are at risk (Steinmann et al., 2006; Utzinger et al., 2009; Gray et al., 2010). Schistosomiasis is endemic to parts of South America, the Middle East, Asia, and Africa. Sub-Saharan Africa contributes 90% of cases worldwide (Chitsulo et al., 2000; Gryseels et al., 2006; Hurlimann et al., 2011) and Ghana has one of the highest prevalence rates of infections (WHO, 2010). In Ghana 30-35% of the population require preventative chemotherapy, however only 2–8% of the population receives it annually (WHO, 2010). Due to limited disease surveillance, control efforts are often based on infrequent, small-scale health surveys, which are expensive and logistically difficult to conduct.
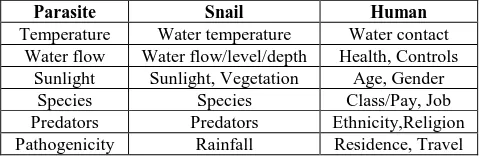
Favorable snail habitat can serve as a proxy for potential schistosomiasis transmission, because snails must be present for the parasite to develop into a stage infective to humans (Sturrock et al., 2001). For disease to occur there must be
reported schistosomaisis during 2008-2015 and their associations, with time-series built from remote sensing feeds at the district level in Ghana.
2. DATA
The environmental variables used in this work came entirely from publically available remote sensing data (Table 2). The environmental variables were selected based on their repeated use in the literature (Bavia et al., 2001; Simoonga et al 2009; Walz et. al 2015a), and for comparison to the predominant climate classification system for the past 100 years. The Köppen-Geiger (KG) climate classification system is based on the assumption that vegetation is the best proxy for climate, and that temperature and precipitation are the best proxies for vegetation (Kotteck et al., 2006). The variables were projected to WGS-84/UTM-30N datum prior to aggregation to mean values per district, using zonal statistics in the ArcGIS 10.3 software. Where resampling was required, the cubic convolution technique was used because it more realistically reflected the smooth transitions of environmental data across terrain.
² Normalized Difference Vegetation Index (NDVI) ³ LKN-regions (LKNr)
Accumulated Precipitation (AP)
Moderate Resolution Imaging Spectroradiometer (MODIS)
Tropical Rainfall Monitoring Mission (TRMM)
Ghana Health Service (GHS)
Table 2: Data sources and resolution of environmental parameters and the health outcome.
Ghana Health Service (GHS) provided monthly counts of schistosomiasis reported to the national surveillance system from January 2008 through December 2015. The records are likely to reflect the process of adult patients seeking medical treatment for schistosomiasis-related symptoms across 216 districts. The case counts were converted into monthly
3. METHODS 3.1 LKN regionalization
LKN (LKNr) regions were created following the methodology of our recently proposed automated climate regionalization method, LKN-regionalization, which are based on k-means clustering algorithm over time-space (Liss et al. 2015). The LKN method consists of the data limiting step (L-step) to reduce dimensionality by applying principal component analysis, a classification step (K-step) to produce hierarchical candidate regions using k-means unsupervised classification algorithm, and a nomination step (N-step) to determine the number of candidate climate regions using cluster validity indexes. Using a comprehensive set of multiple satellite data streams arranged as time series, the method is capable of defining climate regions over large spatial extents. This is essential for large-scale epidemiological studies to account for geographic heterogeneity.
MODIS Normalized Difference Vegetation Index (NDVI) and Land Surface Temperature (LST) for 15 years (2000-2015) were downloaded from the online Data Pool at the NASA Land Processes Distributed Active Archive Center (LP DAAC), USGS/Earth Resources Observation and Science (EROS) Center, Sioux Falls, South Dakota (LPDAAC-NASA 2000-2015). The data was mosaicked and re-projected so that it covered the entire extent of our study region (latitude and longitude of the upper left and lower right corners of the bounding box were: UL (11.625, -3.625), LR (4.375, 1.375)). Each of the two EOS satellites, Aqua and Terra, produced composites on overlapping 16 days schedules that we combined and constructed 8 day temporal resolution composites. The data was aggregated in a layered space-time series. Using a normalized vegetation index allowed us to reduce or eliminate the effects of annually changing lighting conditions, thin clouds, atmospheric and anisotropic distortions.
Figure 1: Climate classification workflow. A) flowchart of the LKN method. B) first four components of the PCA.C) 3 major zones and D) 9 minor zones determined by CVI analysis.
The original methodology employs cluster analysis to define regions with similar climate. It aims to assign a finite set of labels (also known as categories or classes) to a very large number of multidimensional objects (pixels, representing a defined area on the ground in our case) based on their similarity followed by determination of the cluster validity. We perform classification using several parameter sets and algorithms with a varying number of principal components, regions, and applied distance measures resulting in approximately 200 classifications. We assessed the quality of clustering using cluster validity index (CVI) analysis. K-Means using Euclidean distance produced the best clustering, with 3 major zones (Figure 2C) and 9 minor zones (Figure 2D).
3.2 Associations between disease and RS-based parameters Spatiotemporal patterns of schistosomiasis disease rates were explored using descriptive statistics, Spearman’s correlation, and a multivariate generalized linear mixed effects regression model. The model was designed to control for temporal variations, such as trend and seasonality with two harmonic terms, and spatial variations by including district-level clustering effects. The model was repeated for major and minor climatic zones and formulated as follows:
, (1)
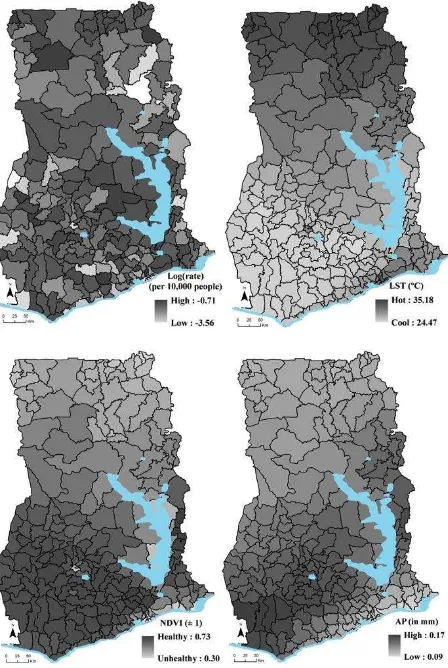
Figure 2: Spatial distribution of the 8 year averages of Loge(rate), LST, NDVI, and AP aggregated from 2008-2015 and extracted by the 216 districts of Ghana. Districts with no counts for the entire time period are shown in white, and data values were stretched from high to low.
where Ytj is the natural log transformed monthly rate per 10,000 people at t-month and j-district; t is the time in months (96 months from 2008 – 2015); βLand βM represent the regression coefficients for fixed effects of seasonality, S, and remotely sensed variables, RS, respectively:
(2) (3)
bp represents the coefficients of the random effects for the remote sensing parameters for each district. Two harmonic terms account for potential multiple peaks, as the north of Ghana is characterized by one wet-dry season, while the south by two seasons. The models were fitted by the restricted maximum likelihood (REML) using the glmer function of the R package [lme4] (version 3.2.2).
(mean ± stdev. = 0.45 ± 1.61), LST ranged from 25.64 to 34.03 degrees Celsius (28.18 ± 4.36), NDVI ranged from 0.39 to 0.68 in health of vegetation between ± 1 (0.58 ± 0.17), and AP ranged from 0.10 to 0.14 in mm/month of rainfall (0.13 ± 0.09). The long term average of reporting rate was very low, and could reflect underreporting.
All values of LST fall within the ideal range of temperature values suitable for the schistosoma parasite and snail species (Gryseels et al., 2006). Overall,NDVI shows healthy vegetation on average, as would be expected in a tropical environment. The range of rain values was small. The apparent albeit mild, differences in average values per LKN region suggest that studies of this nature require precision in order to flush out substantial spatiotemporal relationships in equatorial regions.
Zone Rates LST NDVI AP
Table 3: Descriptive Statistics of outcome and predictors.
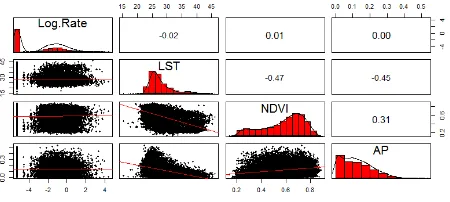
Overall, the correlation between the monthly values of rates and the environmental variables was near zero (which is confirmed by a more detailed analysis). There was moderate correlation among the environmental variables (Figure 3), which did not warrant collinearity.
Stratification by LKN region brought the R as high as 50% for major zones and as high as 59% for minor zones. Trend and seasonal oscillations contributes a major portion of the variability explained (see Figure 4; 37%). In terms of environmental predictor variables, LST and AP showed no significant risk association with disease rates. NDVI showed increased relative risk values in major zone 3 and minor zone 7 (RR = 1.64; CI95%: 1.01,2.67 and RR = 6.76 CI95%: 1.93,23.62, respectively). AP showed increased relative risk overall (RR = 1.47; CI95%: 1.01,2.15).
Figure 4: Needle plot of loge(rate) superimposed with fitted models: All (black), Z3:1 (red), Z3:2 (green), and Z3:3 (blue).
LST RR NDVI RR AP RR Results
5. DISCUSSION
The proposed mixed effects model explained ~ 41% of spatio-temporal variability of the health outcome. When stratified by LKN region the R2 ranged from 37-50% for the 3 major regions, and 28-59% for the 9 minor regions. RR associated with the trend variable in the models reflects the decline in the reported rates of schistosomiasis over the study period 2008-2015. While the exact nature of this will require further investigation, it is likely that mass drug administration (MDA) campaigns with the deworming drug, praziquantel, are a potential cause. MDA campaigns began in 2008 and have continued through 2015 to present (WHO, 2010; Merck, 2016). Also important to note is that according to the World Bank, Africa currently has one of the highest population growth rates in the world, necessitating the use of accurate population adjustments and growth rates per individual years (Linard et al., 2012). No similar decreasing trends were noted in the predictor variables, which alternatively may show effects of climate change.
Exploratory analyses showed noticeable seasonality in the environmental predictor variables. The documented single wet/dry cycle of northern Ghana was apparent in the major LKN region 1, while the double wet/dry cycles common to the south were seen in the major LKN regions 2 and 3. In addition to showing agreement with known hydrological cycles, the major LKN regions aligned well with the Köppen-Geiger climate classification regions. Thus, remote sensing feeds can effectively be used to capture the seasonal effects and climate divisions. Assessing the nature of schistosomiasis count seasonality needs further assessment; however model fit improved substantially with the incorporation of seasonal harmonics.
A long lag between infection and clinical symptoms may contribute to underreporting (Danso-Appiah et al., 2004; de Vlas et al. 2014), and so obscure the documentation of seasonality. Ghana’s equatorial location makes variations in seasonal environmental variables subtle, and so makes the precision of the data in this type of analysis especially important. Of the 600 partitions run on 200 classifications, most agreed that there were only 3 major and 7-10 minor clusters. For these reasons it is difficult to link schistosomiasis rates with purely environmental variables. However the 41% explained variance is promising.
To overcome these challenges, this study has utilized 8 years of overlapping remote sensing data feeds and national health data. Other studies approaching this length of temporal data have relied upon retrospective or prospective health surveys (Walz et al, 2015a). Studies that have taken place on similar or greater spatial scales have relied upon aggregated retrospective health surveys (Shur et al., 2011; Shur et al., 2013). While these data sources are highly accurate for the time and place in which they were collected, extrapolation of these results have increased uncertainty. used to direct control efforts was in 2008 (Soares-Magalhaes et al., 2011). This study used detailed health data collected in 77 schools to direct post study drug distribution by interpolating predicted risk for the rest of the country. A purely
environmental approach paired with access to national health data for the reportable disease, schistosomiasis, has the benefit of being a more cost effective spatiotemporal tool.
Increasing spatiotemporal resolutions of environmental and outcome variables would be of benefit to improving model fit (Utzinger et al., 2009). However the MODIS sensor has a spatial resolution limit of 250m unsharpened, and a temporal resolution limit of 4 day adapted composites before alternative satellite sensors would need consideration. ASTER or Landsat would be considered for future publically available satellite data as they provide continuous, high spatiotemporal resolution. However the computational price of this will need careful consideration.
By running the LKN regionalization algorithm hierarchically on each of the major zones separately we can hone in on subtler climatic differences on scales closer to our district level rates. Alternatively the spatial resolution of the health outcome is available at the rural health unit, provided that the georeferencing of the clinics is undertaken. Bringing the environmental and health data to a comparable scale is one source of improved model fit. Additional improvements would come from increasing the overall spatiotemporal resolution of all variables; adding additional environmental variables, use of fourier transform analysis to guide seasonality analysis, and incorporating adjustments such as collinearity, autocorrelation, over dispersion, and lag. By exploring the potential of purely environmental data to predict schistosomiasis, we are seeing if there might be a more sustainable, cost effective and rapid Reis, R. (2001). Use of thermal and vegetation index data from earth observing satellites to evaluate the risk of schistosomiasis in Bahia, Brazil. Acta Tropica, 79(1), 79–85. Retrieved from behaviour for schistosomiasis-related symptoms in the context of integrating schistosomiasis control within the regular health services in Ghana. Tropical Medicine & International Health, 9: 784–794. doi: 10.1111/j.1365-3156.2004.01267.x
De Vlas SJ, Danso-Appiah A, van der Werf MJ, Bosompem KM, Habbema JDF: Quantitative evaluation of integrated schistosomiasis control: the example of passive case finding in Ghana. Trop Med Int Health 2004, 9(6):A16-A21.
Ghana Statistical Service. 2010 Population and housing Census:
National analytical report. 2013;
RESOURCES DEVELOPMENT: A RE-EVALUATION OF AN IMPORTANT ENVIRONMENT-HEALTH LINKAGE (p. 43).
Ann Arbor, Michigan. Retrieved from
http://ageconsearch.umn.edu/bitstream/11881/1/twp2.pdf
Hürlimann E, Schur N, Boutsika K, Stensgaard A-S, Laserna de Himpsl M, Ziegelbauer K, et al. (2011) Toward an Open-Access Global Database for Mapping, Control, and Surveillance of Neglected Tropical Diseases. PLoS Negl Trop Dis 5(12): e1404. doi:10.1371/journal.pntd.0001404
Kosinski KC, Bosompem KM, Stadecker MJ, Wagner AD, Plummer J, Durant JL, Gute DM: Diagnostic accuracy of urine filtration and dipstick tests for Schistosoma haematobium infection in a lightly-infected population of Ghanaian schoolchildren. Acta Trop 2011, 118(2):123-127.
Kosinski, K. C., Adjei, M. N., Bosompem, K. M., Crocker, J. J., Durant, J. L., Osabutey, D. Plummer, J.D., Stadecker, M.J., Wagner, A., Woodin, M., Gute, D. M. (2012). Effective Control of Schistosoma haematobium Infection in a Ghanaian Community following Installation of a Water Recreation Area. PLOS Neglected Tropical Diseases, 6(7). doi:10.1371/journal.pntd.0001709
Kosinski, Karen Claire, Alexandra V. Kulinkina, Akua Frimpomaa Atakora Abrah, Michael N. Adjei, Kara Marie Breen, Hafsa Myedah Chaudhry, Paul E. Nevin, Suzanne H. Warner, and Shalini Ahuja Tendulkar. "A Mixed-methods Approach to Understanding Water Use and Water Infrastructure in a Schistosomiasis-endemic Community: Case Study of Asamama, Ghana." BMC Public Health 16.1 (2016).
Kottek, Markus, Jürgen Grieser, Christoph Beck, Bruno Rudolf, and Franz Rubel. "World Map of the Köppen-Geiger Climate Classification Updated." Meteorologische Zeitschrift Meteorol. Z. 15.3 (2006): 259-63. Retrieved from http://www.srh.noaa.gov/jetstream/global/images/Koppen-Geiger.pdf
Kulinkina, Alexandra V., Karen C. Kosinski, Alexander Liss, Michael N. Adjei, Gilbert A. Ayamgah, Patrick Webb, David M. Gute, Jeanine D. Plummer, and Elena N. Naumova. "Piped Water Consumption in Ghana: A Case Study of Temporal and Spatial Patterns of Clean Water Demand Relative to Alternative Water Sources in Rural Small Towns." Science of The Total Environment 559 (2016): 291-30.
Liss, A., Koch, M., & Naumova, E. N. (2014). Redefining climate regions in the United States of America using satellite remote sensing and machine learning for public health applications. Geospat Health Geospatial Health, 8(3), 467.
schistosomiasis prevalence among individuals aged ≤20 years in West Africa. PLoS Negl Trop Dis. 2011;5:e1194.
Schur N, Hürlimann E, Stensgaard AS, Chimfwembe K, Mushinge G, Simoonga C, et al. Spatially explicit Schistosoma infection risk in eastern Africa using Bayesian geostatistical modelling. Acta Trop. 2013;128:365–77.
Soares Magalhaes RJ, Biritwum NK, Gyapong JO, Brooker S, Zhang Y, Blair L, Fenwick A, Clements AC. Mapping helminth co-infection and co-intensity: geostatistical prediction in Ghana. PLoS Neglected Tropical Diseases 2011, 5: e1200.
Simoonga C, Kazembe LN, Kristensen TK, Olsen A, Appleton CC, Mubita P, et al (2008). The epidemiology and small-scale spatial heterogeneity of urinary schistosomiasis in Lusaka province, Zambia. Geospatial Health. ;3:57–67.
Simoonga C, Utzinger J, Brooker S, Vounatsou, P, Appleton CC, Stensgaard AS, Olsen A, Kristensen TK. Remote sensing, geographical information system and spatial analysis for schistosomiasis epidemiology and ecology in Africa. Parasitology 2009, 136(13): 1683-1893.
Steinmann, P., Keiser, J., Bos, R., Tanner, M., & Utzinger, J. (2006). Schistosomiasis and water resources development: Systematic review, meta-analysis, and estimates of people at risk. The Lancet Infectious Diseases, 6(7), 411-425.
Sturrock, R. F., Diaw, O., Talla, I., Niang, M., Piau, J., & Capron, A. (2001). Seasonality in the transmission of schistosomiasis and in populations of its snail intermediate hosts in and around a sugar irrigation scheme at Richard Toll, Senegal. Parasitology, 123(07), 77-89. doi:10.1017/S0031182001008125.
Utzinger, J., Raso, G., Brooker, S., De Savigny, D., Tanner, M., Ornbjerg, N., … N’goran, E. K. (2009). Schistosomiasis and neglected tropical diseases: towards integrated and sustainable control and a word of caution. Parasitology, 136(13), 1859–74. doi:10.1017/S0031182009991600
Walz Y, Wegmann M, Dech S, Raso G, Utzinger J. Risk profiling of schistosomiasis using remote sensing: approaches, challenges and outlook. Parasites & Vectors 2015, 8: 163 (a).
Walz Y, Wegmann M, Dech S, Vounatsou P, Poda JN, N’Goran EK, Utzinger J, Raso G. Modeling and validation of environmental suitability for schistosomiasis transmission using remote sensing. PLoS Neglected Tropical Diseases 2015, 9(11): e0004217 (c).