THE 21st CENTURY MUSEUM CLIMATIC MONITORING SYSTEM Wai-sum Liu
Conservation Office, Leisure and Cultural Services Department, Hong Kong, China [email protected]
KEY WORDS: Museum climatic monitoring system, Radio/GPRS, Off-site store, Gallery
ABSTRACT
1. Introduction
1.1 The importance of a non-stop RH/Temp monitoring system in museums and stores
It is crucial to have a stable and steady environment for displaying and storing humidity/ temperature sensitive collections in museums, such as metal art pieces, works of art on paper, lacquerers, woods, ivory, horns etc. These objects are vulnerable to physical damages from the undesirable levels of RH/Temperature or sudden and drastic changes of these conditions during their display and storage. Objects may suffer from irreparable damages if they have been exposed to the adverse condition for long. In fact, a sophisticated Heat, Ventilation and Air Conditioning system controlled by a reliable monitoring and recording system can help reducing the damage. The system logs the data and reports to the user instantly if the parameters fall out of the satisfactory range. Data can be plotted and shown as a hydro-thermograph to better illustrate the trend and environmental profile of the place at a specific period of time. Users and keepers can duly adjust the climatic settings from the abnormal environmental condition to the pre-set levels by referring to this primitive hand-held RH/Temp data-loggers two decades ago. These loggers are small battery powered devices equipped with sensors and microprocessors aiming at monitoring and recording essential data, like RH/Temp (Conserve, 2011). These loggers only record the climatic conditions at a pre-set duration, yet they cannot show the reading nor report any irregularities during monitoring. Readings can only be retrieved upon the completion of measurement. Any irregularities cannot be instantly revealed or rectified, but can only be dealt with upon the completion of data download by the control panel (Arentein, 2002). Given the time lapse on data retrieval, these loggers were soon replaced with its second generation, well equipped with the General Packet Radio System (radio/GPRS). It transmits the essential RH/Temp signals to the control panels instantly by radio wave and shows a viewable climatic chart on a real time basis. The system has been widely used in museums to monitor and control the climatic conditions of 22 galleries and 40 stores with various environmental settings. The data signals of RH/Temp collected from the existing 250 sensors at different museums and stores are then transmitted to/from and kept at the corresponding 15 stations every fifteen minutes. Once logged into the system, the recorded information of a target sensor can be viewed by the designated users at the workstation at any time. This system greatly facilitates museum to exchange and retrieve important
type of exhibits from a particular lending institute. Resources and facilities can be properly managed and shared eventually.
Moreover, artifacts displaying in a hermetically sealed showcase will not be disturbed if the data can be sent via radio frequency to the control panel without opening the showcase to retrieve data from the logger.
1.3 The latest evolution of technology - the 3rd generation
Nowadays, most of the museums strategically relocate their ever-expanding collection to off-site stores at remote areas far away from the museum in order to resolve their over-congested storage problems. The offsite store is required to provide a steady and satisfactory RH/Temp level for storing its treasure with an aid of a monitoring system showing any irregularities and reporting problems. The 3rd generation of data-logger performs well in this task. Sensor of this generation can facilitate transmission of signals from a remote workstation to the main base somewhere far away. The climatic condition of the store can be viewed at the office of the museum through a computer system given its workstation has been connected through internet. Any alarm signals will be transmitted to the electronic devices of the alert group of users to prompt for their remedial actions when the RH/Temp readings fell out of the satisfactory or pre-set level by admin. The system developed from GPRS technology, a packet-switched technology, can support the internet protocol (IP) and is currently used in wireline communications. With the same protocols as internet, the GPRS base station serves as a host and possesses with its own IP address. With the recognized static IP address, data and settings collected by the sensors placed at remote stores can be instantly identified, viewed and interacted anywhere via commercially available browsers, such as: Firefox or Internet Explorer etc. The wireline currently applied is an upgraded telephone line called ADSL (Asymmetrical Digital Subscriber Line) and getting online with broadband. 10Mbps would be enough for transmission of raw RH/Temp data.
2. Application of the wireless communication
2.1 Galleries in Hong Kong
Data collected from sensors at different rooms is transmitted to the workstation in the premise via radio frequency signals of about 434.075Hz. A Synergy Management Tool has been installed in the workstation which provides a physical link to the database, allowing synchronizing, calibrating and merging hardware devices at any places via internet. It gives an outstanding mobility of the usage and stability of communication with other devices anytime and anywhere (Wibowo, 2005)
Fig. 1 Layout plan of sensors (indicating by red dots) in Room 902 of an offsite store
Fig. 2 Layout plan of sensors (indicating by red dots) in Room 901 of an offsite store
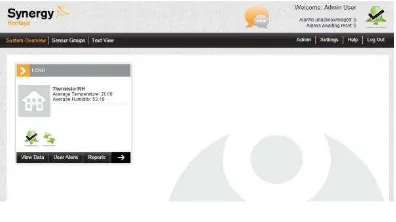
Fig. 3 Homepage of the Synergy Management Tool
2.3 The Synergy Management Tool
The management tool provides several important functions for the monitoring system, including data retrieval, communication of the individual sensors, data logging, data analysis and alarm notification to user through the smart phone device.
Retrieving data
The sensors located at different rooms can be browsed through this managing tool. Data of the selected sensors is available for download. It gives a graphical user interface (GUI) which works on all up-to-date web browsers. Data displays in the forms of graph, table or plan views, which can be chosen by the user.
Fig.4 Graphical view display
Fig.5 Live view display
Fig. 6 Plan view display
Access right
Table 1 Access right of the 3-level users
Synchronizing and configuring the devices
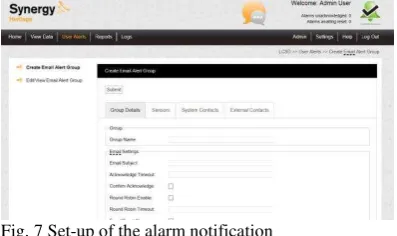
Sensors can be configured and set remotely in the alarm levels can also be established for each sensor at different zones under various requirements. When the recorded readings fall out of the pre-set levels, alarm will be automatically triggered and sent to the dedicated Alert Group electronically. Alarm notification will be instantly delivered via Email or SMS or both to Users who are members of the Alert
be taken by the users once alert notification has been received
.
Fig. 7 Set-up of the alarm notification
3. The wireless technologies
3.1 Pros and Cons of the technology
More and more museum, archive, library and cultural institutes prefer to equip their galleries, stores and book stacks with novel facilities like the wireless network system for monitoring their environmental condition. In this century, the application of a wireless system is more favorable as it provides a higher mobility, reliability and user connectivity than the wired networking system. Though its set-up cost is always on the high side, its installation time is comparatively less even in a complex venue setting or under a difficult installation condition. The recording signals are all transmitted via radio waves or microwaves without any installation of conduit or wiring. Sensor has been self-supported by its own lithium battery which can run for three years. No additional electricity supply is required for the sensor, but just for the workstation. For sure, signals can be automatically, instantly and accurately pop up in front of the viewer without any delay. It establishes a very good reporting mechanism for revealing irregular conditions through sending alarm notification to the users. For example, an alarm was reported at the off-site store at 11:40 and 16:00 on 15 July, showing a raise of relative humidity from 55% to 70% in a very short period of time. It was finally found that doors of the store had been opened for delivery of the storage cabinets during that period of time. The information is so valuable that not only showing the environmental conditions being monitored, but also revealing any human activities being conducted in the store if any of which has bad effect on the change of RH (Kaur et al, 2014).
3.2 The unforeseeable problems encountered and their solutions communication system nearby, especially during the festive seasons or there were any on-going mega
Access Reports Allow Allow Deny
Access Reports - Sensor Groups
Allow Allow Deny
Access Settings Allow Deny Deny
during the non-operating hours of the museum. To tackle the latter problem, a signal amplifier or repeater has to be additionally installed to ensure a smooth transmission of the signals. For the first problem, a special permission of using the specific radio frequency has been sought from the Office of the Communications Authority (OFCA) in Hong Kong to ensure the sole usage of this frequency from other party to prevent any technical interference. Museum has to pay for the license management fee to the government every year for the engagement of this specific wavelength.
After all, the recurrence cost as well as its installation cost has gone up. In fact, it is quite an amount in equipping the whole set of system and its maintenance. The manufacturer is eager to upgrade its existing hardware device for its own profits. Some parts may be obsolete during the upgrading or intentionally re-designed by the supplier. More and more resources have to be reserved by the museum for the system upgrade. Moreover, the migration of software, along with the mega-data and updating the computer OS system are another hot issue to be further addressed and discussed. There are a lot to follow once there is a small change of the system. Needless to say for the launch of a brand new system, relevant and intensive training has to be provided.
It turns out that the traditional logger without distinctive and vital functions may work quite well in some occasions. It does not have the above mentioned difficulties and problems. Sometime, museum prefers using traditional logger to record the shipment condition of its valuable artworks if the data is only for reference. Data will be kept safely and easily downloaded after the return of trip. Wire/Wireless loggers may not provide significant help such cases.
4. Conclusion
Technology without doubt greatly increases the efficiency, productivity of work, and better management of time. Wireless communication allows transmission vital environmental data from a remote site to the office without delay no matter how far they are apart. It can also trigger alarm to remind users for immediate follow-up action if there are any undesirable conditions. Though the system did resolve problems and overcame lot of technical limitations for the museum in the past system, it has brought up other hectic issues during its implementation. Museum may need to seriously consider its needs and resources allocation before the adoption of a novel technology and launching a brand new system.
Acknowledgements
This project can only be made possible mainly subject to the tremendous effort and endless supports from our team of technicians at the Conservation Office. Special thanks to their dedication and commitment over the past two decades to advance the system with new technology relentlessly.
References
Conserve O Gram, Sept 2011. Comparing Temperature and Relative Humidity Dataloggers for Museum Monitoring
R.P. Arenstein, Spring 2002. Comparison of Temperature and Relative Humidity Dataloggers for Museum Monitoring, A technical Publication Series of the Society for the Preservation of Natural History Collection, Number 4.
Wibowo, April 2005. Wireless Networks Security, File_svr_1//conservation//A New Home//.
Kaur et al., April-June 2014. Comparisons of Wired and Wireless Networks: A review, International
Journal of Advanced Engineering Technology/ Vol.

