COMPARISON OF UNCALIBRATED RGBVI WITH SPECTROMETER-BASED NDVI
DERIVED FROM UAV SENSING SYSTEMS ON FIELD SCALE
G. Baretha,c*, A. Boltena,c, M.L. Gnypb, S. Reuschb, and J. Jasperb
aInstitute of Geography, GIS & RS Group, University of Cologne, Albertus-Magnus-Platz, 50923 Cologne, Germany bResearch Centre Hanninghof, Yara International ASA, 48249 Dülmen, Germany
cSpatial Data Services Cologne UG (haftungsbeschränkt)
[email protected], [email protected],
[email protected], [email protected], [email protected] [email protected]
Commission VIII, WG VIII/8
KEY WORDS: Remote Sensing, UAV, agriculture, Yara N-Sensor, winter wheat, nitrogen, vegetation index, hyperspectral, RGB
ABSTRACT:
The development of UAV-based sensing systems for agronomic applications serves the improvement of crop management. The latter is in the focus of precision agriculture which intends to optimize yield, fertilizer input, and crop protection. Besides, in some cropping systems vehicle-based sensing devices are less suitable because fields cannot be entered from certain growing stages onwards. This is true for rice, maize, sorghum, and many more crops. Consequently, UAV-based sensing approaches fill a niche of very high resolution data acquisition on the field scale in space and time. While mounting RGB digital compact cameras to low-weight UAVs (< 5 kg) is well established, the miniaturization of sensors in the last years also enables hyperspectral data acquisition from those platforms. From both, RGB and hyperspectral data, vegetation indices (VIs) are computed to estimate crop growth parameters. In this contribut ion, we compare two different sensing approaches from a low-weight UAV platform (< 5 kg) for monitoring a nitrogen field experiment of
winter wheat and a corresponding farmers’ field in Western Germany. (i) A standard digital compact camera was flown to acquire
RGB images which are used to compute the RGBVI and (ii) NDVI is computed from a newly modified version of the Yara N-Sensor. The latter is a well-established tractor-based hyperspectral sensor for crop management and is available on the market since a decade. It was modified for this study to fit the requirements of UAV-based data acquisition. Consequently, we focus on three objectives in this contribution: (1) to evaluate the potential of the uncalibrated RGBVI for monitoring nitrogen status in winter wheat, (2) investigate the UAV-based performance of the modified Yara N-Sensor, and (3) compare the results of the two different UAV-based sensing approaches for winter wheat.
1. INTRODUCTION
Remote sensing is an important and central technology for crop monitoring (Atzberger 2013; Hatfield et al., 2008) and is well established in precision agriculture to support crop management (Mulla 2013). Since decades, the development and application of vegetation indices (VI) to monitor crop status is in the focus of numerous research activities (Thenkabail et al., 2000; Tucker 1979). In general, these VIs are developed from multi- or hyperspectral field or remote sensing data (Gnyp et al., 2014; Koppe et al., 2010; Li et al., 2008). In the last five years, the image acquisition with UAVs exponentially increased (Colomina and Molina 2014; Zhang and Kovacs 2012). While multi- and hyperspectral sensors are still quite expensive and image acquisition and analysis requires a high expertise (Aasen et al. 2015, Kelcey and Lucieer 2012), it is nowadays even possible for lay persons to take georeferenced RGB images with a very high spatial resolution with low-cost UAVs, e.g. DIJ’s Phantom 3 Pro (www.dji.com).
The lately widespread UAV-based RGB imaging activities lead to an increased research interest to use this data source for precision agriculture applications (Ballesteros et al., 2014, Lopez-Granados et al., 2016). A well-established crop monitoring approach, which is also based on RGB images from UAVs, is the generation of multitemporal Crop Surface Models (CSMs) for plant height and biomass estimations (Bendig et al., 2013; Hoffmeister et al,. 2015; Tilly et al., 2014). In this context, investigations were conducted by Bendig et al. (2015) to analyse
and evaluate the potential of RGB-based VIs which are e.g. proposed by Tucker (1979) and Hunt et al. (2005). Bendig et al. (2015) also introduce a new, moderately performing visible domain VI, the RGBVI, which is additionally applied in combination with plant height from CSMs. Similar research are presented by Tilly et al. (2015) and Bareth et al. (2015) and document the potential of the RGBVI. Both studies evaluated the RGBVI against VIs which were computed from hyperspectral field spectrometer measurements.
The overall objective of this research is to further investigate the performance of the RGBVI from spectrally uncalibrated RGB images captured with a low-cost UAV system. In contrary to other studies, the performance is not tested against field spectrometer measurements but evaluated with calibrated UAV-based spectrometer measurements. Therefore, three working packages are investigated below: (i) multitemporal RGB imaging UAV-campaigns, (ii) multitemporal hyperspectral UAV campaigns with a modified Yara N-Sensor, and (iii) comparison of the two approaches for a controlled field experiment and a
conventionally managed farmers’ field.
2. STUDY AREA
Measurements in a nitrogen field experiment and on a farmers’ field were conducted in the vicinity of the Research Center Hanninghof, Dülmen, North Rhine-Westphalia, Western
Germany (51°50’24’’N, 7°15’07’’E). The study site is flat to
slightly hilly and the soil type is a stagnic cambisol: This area is The International Archives of the Photogrammetry, Remote Sensing and Spatial Information Sciences, Volume XLI-B8, 2016
characterized by a temperate and humid climate with a mean annual temperature of 9.3 C° and precipitation of 718 mm. In the field trial, one winter wheat cultivar (Inspiration) was sown on October 22nd, 2014. As basic fertilization the whole field received 113 kg P2O5/ha as triple superphosphate and 75 K2O kg/ha as patentkali. At the first topdressing, the field was subdivided in twelve treatments (N0-N11), where ten treatments (N0-N8, N11) received increasing N rates of 0-270 kg N/ha in 30 kg/ha increments and two treatments (N9+N10) received 240 kg N/ha with different timing. Each treatment had a size of 11.5 m by 15 m (Fig.1). Additionally, a farmers’ field (winter wheat) with a triangular shape and a size of approximately 13 hectares was selected and managed according to the common farmers’ practice. Destructive biomass samples were taken in the growing season of 2015 at BBCH-31, BBCH-49, and BBCH-59.
Figure 1. Field experiment with twelve nitrogen (N) treatments
3. METHODS
UAV-platform
The UAV-System used for RGB image and Yara N-Sensor data acquisition is a HiSystems Mikrokopter XL (www.hisystems. de). The multi-rotor platform is equipped with navigation hardware and allows a precise autonomous GPS-controlled flight mode in a 1 km radius around the take-off point. Both sensors are mounted on an actively stabilized two axes gimbal. The third axis is solved by yawing the UAV. Together with batteries, sensors, and if necessary a mini-PC, its total take-off weight is below 5 kg. Up to 16,000 mAh 14.7 V Lithium Polymer batteries allow up to 20 minute flight time in maximum loaded configuration.
RGB Camera
For the recording of RGB-images, the UAV is equipped with a Sony Alpha ILCE 5100 camera combined with a 20 mm Sony SEL20F28 lens. The 24 MP camera mounted on the stabilized gimbal in nadir position takes approx. 2 frames per second (fps). The standard flight survey reachs an overlap in flight direction of more than 95 %, across track overlap is about 60 %. Typical ground resolution at 100 m altitude is around 1.5 cm. Orthoimages are computed using Agisoft Photoscan (1.1.5) in combination with highly accurate measurements of ground control points (GCPs) using a RTK GNSS positioning system.
Lightweight spectrometer prototype
A lightweight double spectrometer (modified version of the Yara N-Sensor, approx. 1 kg) was mounted on the active gimbal of the UAV platform. The device includes two AvaSpec-128 spectrometers (AVANTES BV, Apeldoorn, Netherlands) with a spectral range of approx. 600-1100 nm and with 10 nm effective spectral resolution. One spectrometer measured ambient irradiance through a cosine-corrected diffusor to correct for
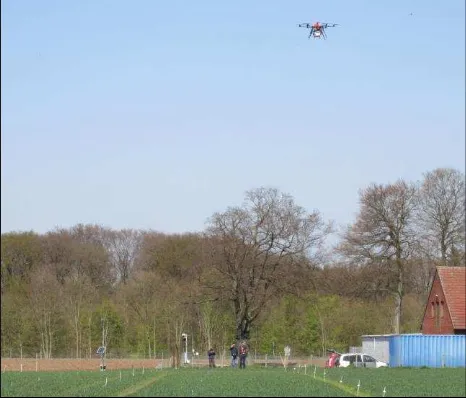
changing light conditions (Reusch, 2003). Simultaneously, a light fiber connected to the second spectrometer looked down into the crop canopy with a field of view of 22° and measured the reflected radiation. The prototype was mounted on active gimbal to ensure that the fiber optics of both spectrometers were in one axe. Spectrometer settings were adjusted in the spectrometer software on a notebook and were transferred via wireless transmission to the on-board mini PC of the UAV-platform. In one second interval, spectral data, GPS position, and altitude were automatically logged and saved in the mini PC. Operational flight height was set to 7 m for the field experiment and to 30 m for the farmers’ field (Fig.2).
Figure 2. UAV-mounted Yara N-Sensor in air
Data Analysis
Three UAV campaigns for each field were conducted with both sensors during the winter wheat growing season in 2015 (field experiment: 20.04., 27.05., 08.06.; farmers’ field: 20.04., 18.05., 08.06.). The RGB images were mosaiced and orthorectified with Agisoft Photoscan. Further spatial data processing was performed with Esri ArcGIS. The RGBVI, calculated as (G2 - R*B)/(G2 + R*B), was computed from the RGB orthoimages for each date in full spatial resolution of approx. 1.5 cm. Zonal statistics were then calculated for the plots of the experimental field, resulting in mean values for each plot. Accordingly, mean NDVI values were computed from the Yara N-Sensor data for each plot. For the farmers’ field, the hyperspectral point measurements using the UAV-mounted Yara N-Sensor were buffered with a 2 m radius which is actually smaller than the real footprint of the spectrometer. The buffered points were used for computing zonal statistics of the RGBVI. Again, NDVI was computed from the hyperspectral point data. Finally, regression analyses were done using MS Excel to compare the uncalibrated RGBVI against calibrated NDVI.
4. RESULTS
As mentioned above, the focus of this study is on three working packages for which the results are presented below, with the analysis for the experimental field shown first.
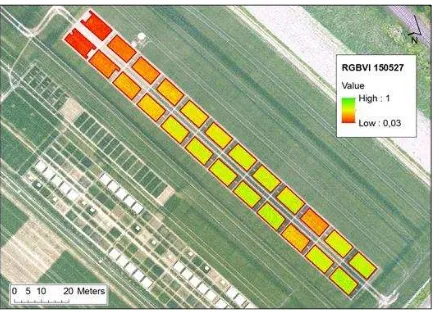
In Fig.3, the N field experiment is shown for May 27th, 2015. Even in the reduced resolution of this map the very high spatial resolution of the generated orthophoto is clearly visible. The coloured polygons with the red outline represent the plots of the N experiment. A pair of two polygons represents one treatment The International Archives of the Photogrammetry, Remote Sensing and Spatial Information Sciences, Volume XLI-B8, 2016
according to Fig.1, as the tractor tracks and plot borders were excluded from analysis. For the zonal statistics, the two polygons representing one treatment were aggregated.
Figure 3. UAV-derived RGBVI data for the N experiment nearby the Research Center Hanninghof
For the N experiment, the uncalibrated RGBVI (RGBVIuncal.) was computed pixel by pixel and afterwards zonal statistics were applied for each of the twelve N treatments and the three investigated phenological stages, resulting in 36 data points. The same accounts for the calibrated NDVI (NDVIcal.) which is derived from the UAV-mounted Yara N-Sensor. Mean NDVIcal. values were also computed for each N treatment. Finally, the potential of the RGBVIuncal. was analysed by a regression analysis against the well-established NDVIcal.. As it is shown in Fig.4, there is a strong correlation with an R2 of 0.71.
Figure 4. Evaluation of the RGBVIuncal. vs. NDVIcal. for the N experiment
When calculated for each of the three phenological stages separately, this correlation is even higher (R2 of 0.89, 0.92, and 0.99). The results are presented in Fig.4, Fig.5, and Fig.6. The slope of the trendline is different for every date and is decreasing to the later growth stage. Also recognizable is the saturation of the NDVI-like VI in later growth stages which is well described by Li (2008).
Figure 5. Evaluation of the RGBVIuncal. vs. NDVIcal. for the N experiment for April 20th, 2015
R² = 0,71
0,0 0,1 0,2 0,3 0,4 0,5 0,6 0,7
0,0 0,2 0,4 0,6 0,8 1,0
R
G
B
V
I
unca
l.
NDVI
cal.RGBVI
uncal.vs. NDVI
cal. R² = 0,990,0 0,1 0,2 0,3 0,4
0,0 0,5 1,0
R
G
B
V
I
unca
l.
NDVI
cal.RGBVI
uncal.vs. NDVI
cal.(20.04.2015)
Figure 6. Evaluation of the RGBVIuncal. vs. NDVIcal. for the N experiment for May 27th, 2015
Figure 7. Evaluation of the RGBVIuncal. vs. NDVIcal. for the N experiment for June 8th, 2015
The second part of this study focuses on a conventionally
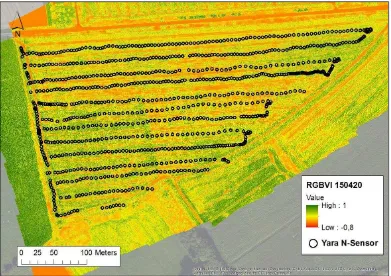
managed farmers’ winter wheat field covering an area of approx. 13 ha. In Fig. 8, the RGBVIuncal. and the positions of the UAV-based Yara N-Sensor measurements are shown for April 20th, 2015. As mentioned above, even in the reduced resolution of Fig. 8, the very high spatial resolution acquired from an UAV altitude of approx. 100 m is clearly visible and makes within-field variability very obvious. The round polygons with the black outline represent the point measurements of the UAV-mounted Yara N-Sensor. In total, 900 of such spectral measurements were used for deriving NDVIcal..
…The RGBVIuncal. is again computed pixel by pixel and afterwards zonal statistics were applied for each of the 900 spectral footprints of the UAV-mounted Yara N-Sensor being represented by the polygons with a diameter of 2 m for analysis. This is actually a little smaller than the real footprint with a diameter of around 3 m. In total, a dataset of 2700 observations was produced for the three data campaigns in 2015. As described for the N experiment, the potential of the RGBVIuncal. was analysed by a regression analysis against the NDVIcal..
Figure 8. Evaluation of the RGBVIuncal. vs. NDVIcal. for the farmer’s field on April 20th, 2015
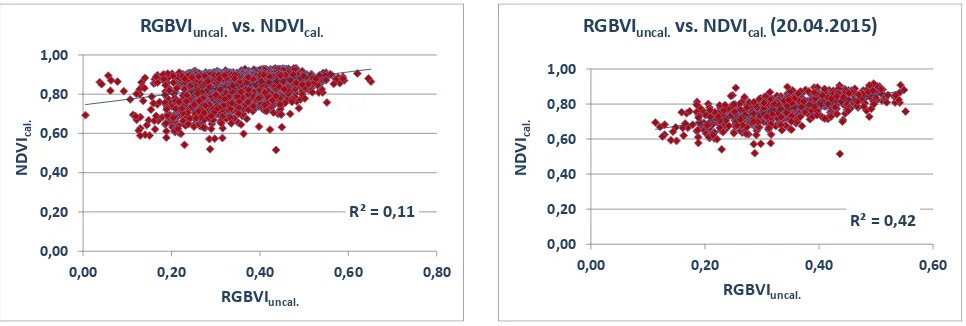
As it is clearly shown in Fig.9, the correlation between RGBVIuncal. and NDVIcal., when calculated for all three phenological stages together, is rather poor (R2 = 0.11). Besides the first campaign, this is true for the second and third considered phenological stages (Fig.11 and Fig.12). In both datasets, RGBVIuncal. and NDVIcal. seem to have no common trend. Only
the analysis of the first campaign on April 20th in Fig.10 shows a weak trend (R2 = 0.42) indicating that computed within-field variability was high enough. This is especially true for the NDVIcal.. The data of the latter for May 18th and June 8th clearly show a saturated NDVI performance while the RGBVI still produces a proper range of values.
R² = 0,89
0,0 0,1 0,2 0,3 0,4 0,5 0,6 0,7
0,0 0,5 1,0
R
G
B
V
I
unca
l.
NDVI
cal.RGBVI
uncal.vs. NDVI
cal.(27.05.2015)
R² = 0,92
0,0 0,1 0,2 0,3 0,4 0,5
0,0 0,5 1,0
R
G
B
V
I
unca
l.
NDVI
cal.RGBVI
uncal.vs. NDVI
cal.(08.06.2015)
Figure 9. Evaluation of the RGBVIuncal. vs. NDVIcal.
for the farmers’ field Figure 10. Evaluation of the RGBVIfor the farmers’ field for April 20uncal.th vs. NDVI, 2015 cal.
Figure 11. Evaluation of the RGBVIuncal. vs. NDVIcal. for the farmers’ field for May 18th, 2015
Figure 12. Evaluation of the RGBVIuncal. vs. NDVIcal. for the farmers’ field for June 8th, 2015
5. DISCUSSION
The general objective of this study is the evaluation of the potential of a spectrally uncalibrated vegetation index computed from UAV-derived RGB images for crop monitoring. The RGBVIuncal. was proposed by Bendig et al. (2015) for monitoring barley. In the latter study, the RGBVIuncal. is also combined with CSM-derived plant height to monitor barley biomass which worked very well. Marshall and Thenkabail (2015) also stated that the combined analysis of plant height and VIs can serve as a robust estimator for agronomic parameters. Same findings are published by Tilly et al. (2015) who also evaluated the RGBVI, but in contrast to Bendig et al. (2015), as a calibrated RGBVI computed from hyperspectral field measurements. Bareth et al. (2015) computed uncalibrated RGBVI for a long-term grassland experiment. In the latter study, the major objective was the application of the RGBVIuncal. to identify relative or qualitative differences within one campaign which represent a given phenological stage and not a multitemporal analysis for a complete growing season. The results of Bareth et al. (2015) indicate that the RGBVIuncal. might have a similar potential as the NDVIcal. for monitoring grasslands.
In our study, these findings can be confirmed. RGBVIuncal. correlates well to NDVIcal. for all three growth stages in the N experiment. Analysing each of the growth stages alone (Fig.5, Fig.6, and Fig.7), the correlation is outstanding high (R2 > 0.89). This might be a first proof that the RGBVI could serve as a strong
predictor for qualitative differences in crop growth for any captured growth stage. This fits to the findings of Hunt et al. (2005, 2013, 2014) who investigated the potential of such vegetation indices derived from the visible domain for precision agriculture. However, the slopes of the trend lines are different for every date and are decreasing to the later growth stages. One reason for that might be that, due to varying irradiation condition for each of the three campaigns, the uncalibrated RGBVI produces a varying range of values representing the variability. A reason for the good performance could be the strongly varying N input/variance of the N experiment which is producing a large variability that results in such high R2 values. Therefore, the key question is if similar results could also be found in a conventionally managed field.
This issue was investigated with the second data set acquired on a 13 ha winter wheat field. The RGBVIuncal. vs. NDVIcal. correlation is much weaker than expected (Fig. 9). The reason is that NDVI tends to saturate after canopy closure in crops (Gnyp et al., 2013; Li et al., 2008). The UAV-derived RGBVIuncal. is not showing such a saturation. Consequently, the performance of the RGBVIuncal. should be investigated against real agronomic parameters rather than the NDVI in a multiscale approach like it is proposed by Gnyp et al. (2014). Additionally, the potential of polygon grids for zonal statistics should be tested on this field level (Bareth et al. 2016).
R² = 0,11
RGBVI
uncal.vs. NDVI
cal.(20.04.2015)
R² = 0,07
RGBVI
uncal.vs. NDVI
cal.(18.05.2015)
R² = 0,003
RGBVI
uncal.vs. NDVI
cal.(08.06.2015)
The International Archives of the Photogrammetry, Remote Sensing and Spatial Information Sciences, Volume XLI-B8, 20166. CONCLUSION & OUTLOOK
This study compares the uncalibrated RGBVI derived from UAV-based RGB images with calibrated NDVI data computed from the hyperspectral UAV-mounted Yara N-Sensor. Although a strong correlation between uncalibrated RGBVI and NDVI was found in an N rate experiment, this was not the case in a farmers’ field. The reason is the saturation of the NDVI values in later growing stages while the uncalibrated RGBVI still produces a promising range of values representing the observable variability of crop growth. Therefore, future studies on the uncalibrated RGBVI should not only include performance evaluations against well-established calibrates VIs but also an evaluation against destructively measured agronomic parameters like biomass.
REFERENCES
Aasen, A., Burkart, A., Bolten, A., Bareth, G., 2015. Generating 3D hyperspectral information with lightweight UAV snapshot cameras for vegetation monitoring: From camera calibration to quality assurance. ISPRS Journal of Photogrammetry and Remote Sensing, 108, pp.245-259. doi: 10.1016/j.isprsjprs.2015.08.002
Atzberger, C., 2013: Advances in Remote Sensing of Agriculture: Context Description, Existing Operational Monitoring Systems and Major Information Needs. Remote Sensing, 5(2), pp.949–981. doi: 10.3390/rs5020949
Ballesteros, R., Ortega, J.F., Hernandez, D., and Moreno, M.A., 2014. Applications of georeferenced high-resolution images obtained with unmanned aerial vehicles. Part I: Description of image acquisition and processing. Precision Agriculture, 15(6), pp.579-592. doi: 10.1007/s11119-014-9355-8
Bareth, G., Bolten, A. Hollberg, J., Aasen, H., Burkhart, A., and Schellberg,J., 2015:Feasibility study of using non-calibrated UAV-based RGB imagery for grassland monitoring: case study at the Rengen Long-term Grassland Experiment (RGE), Germany. DGPF Annual Conference'15. – Cologne, Germany: 55-62. http://www.dgpf.de/src/tagung/jt2015/proceedings/ papers/07_DGPF2015_Bareth_et_al.pdf
Bareth, G., Bendig, J., Tilly, N., Hoffmeister, D., Aasen, H., and Bolten, A., 2016, in print. A comparison of UAV- and TLS-derived plant height for crop monitoring: using polygon grids for the analysis of crop surface models (CSMs). PFG, 2016(2). doi: 10.1127/pfg/2016/0289
Bendig, J., Bolten, A., and Bareth, G., 2013: UAV-based imaging for multi-temporal, very high resolution crop surface models to monitor crop growth variability. PFG, 2013(6), pp.551–562. doi:10.1127/1432-8364/2013/0200
Bendig, J., Yu, K., Aasen, H., Bolten, A., Bennertz, S., Broscheit, J., Gnyp, M.L., and Bareth, G., 2015. Combining UAV-based plant height from crop surface models, visible, and near infrared vegetation indices for biomass monitoring in barley. International Journal of Applied Earth Observation and Geoinformation, 39, pp.79-87. doi: 10.1016/j.jag.2015.02.012
Colomina, I., and Molina, P., 2014. Unmanned aerial systems for photogrammetry and remote sensing: A review. ISPRS Journal of Photogrammetry and Remote Sensing, 92, pp.245-259. doi: 10.1016/j.isprsjprs.2014.02.013
Gnyp, M.L., Yu, K., Aasen, H., Yao, Y., Huang, S., Miao, Y., and Bareth, G., 2013: Analysis of crop reflectance for estimating
biomass in rice canopies at different phenological Stages. PFG, 2013(4), pp.351–365. doi: 10.1127/1432-8364/2013/0182.
Gnyp, M.L., Bareth, G., Li, F., Lenz-Wiedemann, V.I.S., Koppe, W., Miao, Y., Hennig, S.D., Jia, L., Laudien, R., Chen, X., Zhang, F., 2014. Development and implementation of a multiscale biomass model using hyperspectral vegetation indices for winter wheat in the North China Plain. International Journal of Applied Earth Observation and Geoinformation, 33, pp. 232-242. doi: 10.1016/j.jag.2014.05.006
Hatfield, J.L., Gitelson, A.A., Schepers, J.S., and Walthall, .L. 2008. Application of spectral remote sensing for agronomic decisions. Agronomy Journal, 100(3), pp.117-131. doi: 10.2134/agronj2006.0370c
Hoffmeister, D., Waldhoff, G.; Korres, W., Curdt, C., and Bareth, G. (2015, online): Crop height variability detection in a single field by multi-temporal terrestrial laserscanning. Precision Agriculture, 1-17. doi: 10.1007/s11119-015-9420-y
Hunt, E.R., Cavigelli, M., Daughtry, C.S.T., McMurtrey, J.E., and Walfhall, C.L., 2005. Evaluation of digital photography from model aircraft for remote sensing of crop biomass and nitrogen status. Precision Agriculture, 6, pp.359-378. doi: 10.1007/s11119-005-2324-5
Hunt, E.R., Doraiswamy, P.C., and McMurtrey, J.E., 2013. A visible band index for remote sensing leaf chlorophyll content at the canopy scale. International Journal of Applied Earth Observation and Geoinformation, 21, pp.103-112. doi: 10.1016/j.jag.2012. 07.020
Hunt, E.R., Daughtry, C.S.T, Mirsky, S.B., and Hively, W.D., 2014. Remote sensing with simulated unmanned aircraft imagery for precision agriculture applications. IEEE JSTARS, 7(11), pp.4566-4571. doi: 10.1109/JSTARS.2014.2317876
Kelcey, J., and Lucieer, A. , 2012. Sensor Correction of a 6-Band Multispectral Imaging Sensor for UAV Remote Sensing. Remote Sensing, 4(5), pp.1462-1493. doi: 10.3390/rs4051462
Koppe, W., Li, F., Gnyp, M.L., Miao, Y., Jia, L., Chen, X.P., Zhang, F.S., and Bareth, G., 2010. Evaluating multispectral and hyperspectral satellite remote sensing data for estimating winter wheat growth parameters at regional scale in the North China Plain. PFG, 2010(3), pp.167-178. doi: 10.1127/1432-8364/ 2010/0047
Li, F., Gnyp, M.L., Jia, L., Miao, Y., Yu, Z., Koppe, W., Bareth, G., Chen, X., Zhang, F., 2008. Estimating N status of winter wheat using a handheld spectrometer in the North China Plain. Field Crops Research, 106, pp.77-85.
Lopez-Granados, F., Torres-Sanchez, J., Serrano-Perez, A., de Castro, A.I., Mesas-Carrascosa, F.J., and Pena, J.M., 2016. Early season weed mapping in sunflower using UAV technology: variability of herbicide treatment maps against weed thresholds. Precision Agriculture, 17(2), pp. 183-199. doi: 10.1007/s11119-015-9415-8.
Marshall, M. and Thenkabail, P., 2015. Developing in situ Non-destructive Estimates of Crop Biomass to Address Issues of Scale in Remote Sensing. Remote Sensing, 7, pp.808-835. doi: 10.3390/rs70100808
Mulla, D.J., 2013: Twenty five years of remote sensing in precision agriculture: key advances and remaining knowledge gaps. Biosystems Engineering, 114(4), pp.358–371.
Reusch, S., 2003. Optimisation of oblique-view remote measurements of crop N-uptake under changing irradiance conditions. In: Stafford, J.V., Werner, A. (Eds.) Proceedings of the 4th European Conference on Precision Agriculture. Wageningen Academic Publisher, The Netherlands, pp.573-578.
Thenkabail, P. S., Smith, R. B., and De Pauw, E., 2000: Hyperspectral vegetation indices and their relationships with agricultural crop characteristics. Remote Sensing of Environment, 71(2), pp.158–182.
Tilly, N., Hoffmeister, D., Ciao, Q., Huang, S., Miao, Y., Lenz-Wiedemann, V., and Bareth, G. (2014): Multi-temporal Crop Surface Models: Accurate plant height measurement and biomass estimation with terrestrial laser scanning in paddy rice. J. Applied Remote Sensing, 8(1), 083671. doi: 10.1117/ 1.JRS.8.083671
Tilly, N., Aasen, H., and Bareth, G.,2015: Fusion of plant height and vegetation indices for the estimation of barley biomass. Remote Sensing, 7(9), pp.11449-11480. doi:10.3390/ rs70911449
Tucker, C.J., 1979. Red and photographic infrared linear combinations for monitoring vegetation. Remote Sensing Environment, 18, pp.67-73. doi: 10.1016/0034-4257(79) 90,013-0
Zhang, C. and Kovacs, J.M., 2012. The application of small unmanned aerial systems for precision agriculture: a review. Precision Agriculture, 13(6), pp.693-712. doi: 10.1007/s11119-012-9274-5