IDENTIFYING LOCAL SCALE CLIMATE ZONES OF URBAN HEAT ISLAND FROM
HJ-1B SATELLITE DATA USING SELF-ORGANIZING MAPS
C. Z. Wei a,*, T. Blaschke a a
Department of Geoinformatics Z_GIS, University of Salzburg, Schillerstrasse 30, 5020 Salzburg, Austria [email protected]
Commission VIII, WG VIII/8
KEY WORDS: Urban heat island, Local climate zones, Impervious surface area, Land surface temperature, Surface albedo, Self-organization maps
ABSTRACT:
With the increasing acceleration of urbanization, the degeneration of the environment and the Urban Heat Island (UHI) has attracted more and more attention. Quantitative delineation of UHI has become crucial for a better understanding of the interregional interaction between urbanization processes and the urban environment system. First of all, our study used medium resolution Chinese satellite data-HJ-1B as the Earth Observation data source to derive parameters, including the percentage of Impervious Surface Areas, Land Surface Temperature, Land Surface Albedo, Normalized Differential Vegetation Index, and object edge detector indicators (Mean of Inner Border, Mean of Outer border) in the city of Guangzhou, China. Secondly, in order to establish a model to delineate the local climate zones of UHI, we used the Principal Component Analysis to explore the correlations between all these parameters, and estimate their contributions to the principal components of UHI zones. Finally, depending on the results of the PCA, we chose the most suitable parameters to classify the urban climate zones based on a Self-Organization Map (SOM). The results show that all six parameters are closely correlated with each other and have a high percentage of cumulative (95%) in the first two principal components. Therefore, the SOM algorithm automatically categorized the city of Guangzhou into five classes of UHI zones using these six spectral, structural and climate parameters as inputs. UHI zones have distinguishable physical characteristics, and could potentially help to provide the basis and decision support for further sustainable urban planning.
1. INTRODUCTION
The rapid urbanization and rapid growth of large cities has been accompanied by localized temperature increases, known as Urban Heat Islands (Wake 2012). Studies on the ecosystem have shown that the effects of urban thermal climate change are aggravated by land-cover changes (Kalnay and Cai 2003; Ziska et al. 2003). Thermal Climate change thus in turn influences the cities and regions at a particular scale, increasing the risk of heat stress, extreme precipitation, etc. These reports acknowledge that an understanding of the urban thermal climate context is of prime importance for implementing effective urban adaptation strategies. Many studies have emerged discussing resilience to urban heat islands change in urban areas and what contributes to it (Karl, Diaz, and Kukla 1988; McGranahan, Balk, and Anderson 2007; Grimm et al. 2008). However, there was still no universal approach to describe the physical characteristics of urban heat island across multi-scale regions. Since the 1970s, Earth Observation data have been widely applied and recognized as a powerful and effective data source in detecting urban land use and land cover (Anderson 1976), urban heat islands (Lo, Quattrochi, and Luvall 1997; Streutker 2002), impervious surface areas (RIDD 1995), and other climate factors (X.-L. Chen et al. 2006). These detailed urban survey products made it possible to study the urban climatology in a cheap and rapid way. Stewart and Oke (2012) proposed the concept of a Local Climate Zone (LCZ) to illustrate the Urban Heat Island (UHI), and emphasized that the portray of LCZ should be based on the expert knowledges of surface structure (e.g. building/tree height and spacing), metabolism (e.g. land surface temperature), fabric (e.g. land surface albedo) and land
cover features (e.g. land use class, impervious surface). This framework is more conducive to analyse the LCZ differences than the traditional urban-rural climate difference. However, the physical properties of all zones listed in this framework cannot correspond well with all field sites, the delineation of local climate zones is constrained by the resolution of remote sensing data, and how to quantitatively describe the contribution of each climate factor into the delineation of the urban climate zones is still the question that needs to be explored.
This study aims to use the medium resolution images (30 meter) to quantitatively define the UHI zones. We plan to describe the local climate zones of UHI by (1) using object-based image analysis to identify spatial patterns of Impervious Surface Areas, Land Surface Temperature, Land Surface Albedo, Normalized Difference Vegetation Index, and object-based spectral information; (2) quantifying the contribution of all the relevant factors to the delineation of UHI zones by unsupervised cluster method - Self-Organization Map; (3) formulating all factors to effectively map the UHI zones.
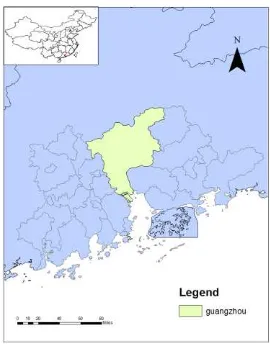
2. STUDY AREA AND DATA COLLECTION Guangzhou (shown in Figure 1), with a total area of 7,434.4 square kilometres, is located in southern China. As one of the fastest growing cities in China, Guangzhou has around 8.5 million inhabitants and has become a typical industrial city. A high intensity of economic activities in this city is causing serious urban environmental problems, including suburban underlying surface anomalies and the tendency of rising average temperatures (Yang et al. 2013).
HJ-1B, which belongs to the disaster mitigation satellite constellation-Huanjing (Environment, HJ-1B) was used in this study. A HJ-1B image was acquired over the study area on the 20th of August, 2011. The HJ-1B satellite contains 2 CCD Optical Cameras both with 4 bands (30 m Resolution) and a broad swath 1 Infrared Camera (300 m Resolution).
Figure 1. The study area-Guangzhou, China
3. METHODOLOGY 3.1 Workflow
The Percentage of Impervious Surface Area
Land Surface Temperature
Surface Albedo
Normalized Difference Vegetaion Index (NDVI)
Spectral feature-Mean of inner border
Spectral feature-Mean of outer border HJ-1B
imagery
Local Climate Zones of UHI Self-organization
Cluster analysis
Figure 2. Overall workflow. White box presents the data sources, grey boxes represent the climate parameters, blue box represents the aggregation method, and original box represents
results.
We proposed a framework (Figure 2), which was based on the medium resolution HJ-1B satellite data, to derive different local climate zones parameters (including the percentage of Impervious Surface Area (%ISA), Land Surface Temperature (LST), surface albedo, Normalized Difference Vegetation Index (NDVI), two spectral intensity features-Mean of Inner Border (MOIB) and Mean of Outer Border (MOOB)). Then we integrated these six parameters with the self-organization maps to classify the urban thermal climate phenomenon into different local climate zones.
3.2 Estimation of the parameters for LCZ of UHI
3.2.1 The percentage of impervious Surface Area: The percentage of impervious surface area is a parameter that reflects a concomitant environmental change in urban cover composition (Yuan and Bauer 2007). It can objectively model the impact of human activities on energy and moisture flux, and is thus suitable to monitor the environmental impact related to urbanization and examine the local climate zones of UHI from the urban morphology aspect.
Wu and Murray (2003) found that impervious surfaces are likely on or near the line connecting the low albedo and high albedo endmembers in the feature spaces, and those most impervious surfaces might be represented by the Linear Spectral Mixture Analysis (LSMA). Therefore, the LSMA model was used to extract the percentage of ISA information in this study. We firstly used the Maximum Noise Fraction (MNF), which is implemented in the software ENVI, to build a statistical model for the images and transform the noise covariance matrix of the dataset to an identity matrix. The MNF components suggested that the spectral reflectance of the HJ-1B image might be best represented by a three end-member linear mixing model. These end-members are high albedo (e.g. concrete, clouds, and sand), low albedo (e.g. asphalt road, built-up area), and vegetation (e.g. farmland, grass and trees). Then, based on the end-member extraction function PPI in ENVI, three types of end-members were identified according to their feature spaces and associated interpretations. Finally, the combination of the three end-members represented the percentage of impervious surface areas. More details of the processing can be found in Wu and Murray (2003).
3.2.2 Land Surface Temperature: Studies on the urban heat island phenomenon using satellite derived land surface temperature (LST) were conducted using AVHRR data, Modies data, Landsat data and so on (Weng, Lu, and Schubring 2004). The LST, which shows the partitioning of sensible and latent heat fluxes, is believed to correspond closely with the urban climatology. We thus chose it as a parameter to delineate the local climate zones.
Jiménez-Munoz & Sobrino’s discovered a linear relationship between radiance and temperature, and set up a first order Taylor’s approximation formula (Jiménez-Muñoz and Sobrino 2003). Based on JM&S model, in order to get the Ts, the land surface emissivity (ε) and the water vapour content (w) are the two main values that need to be calculated. In this study, the land surface emissivity (ε), which indicates how effectively thermal energy is transmitted across the surface into the atmosphere, was obtained through the NDVI thresholds method (Qin et al. 2004). The atmospheric water vapour content (w) was obtained from the website of global atmospheric monitoring designed by the University of Wyoming (http://weather.uwyo.edu/upperair/sounding.html). More details of the processing can be found in Jiménez-Muñoz and Sobrino (2003).
3.2.3 Land Surface Albedo: Surface albedo was treated as an indicator which represents the ability of the surface to reflect the incoming direct and diffused irradiance at all wavelengths and towards all possible angles (Taha 1997). The physical characteristics of surface albedos are crucial to model surface energy balance processes. We therefore used surface albedo as an indicator to delineate the local climate zones of UHI. Remote Sensing images make the global mapping of land surface albedo possible. Liang (2001) established a general conversion formula by incorporating hundreds of measured reflectance spectra of different cover types, and simulated surface spectral albedo based on different spectral sensor response functions. Because the HJ-1B imagery has the same narrowband as Landsat ETM+, we derived the surface albedo using the approach of Liang (2001) adjusted for HJ-1B (band 1-band 3) in 30 m spatial resolution.
3.2.4 Spectral information analysis: Spectral information extracted from satellite data has been an active research area for decades. In order to illustrate the urban climate zone characteristics, we used the NDVI to provide information about the spatial and temporal distribution of vegetation communities. The NDVI, which links the impact of human activities to vegetation, has demonstrated the possible key role in environmental changes analysis in an ecosystem context (Ichii, Kawabata, and Yamaguchi 2002; Pettorelli et al. 2005). Obtaining detailed objects boundary information is an important issue for the LCZ interpretation. Therefore, we used a series of spectral-shape-texture information as the input layer to carry out the image segmentation, and test their performance using the local variance in ESP tool (Drăguţ et al. 2014), and finally selected two object-based edge detector indicators: Mean of Inner Border (MOIB) and Mean of Outer Border (MOOB), as the most appropriate features to describe the objects’ boundaries by using the mean layer intensity value of the pixel/voxels belonging to an image object (eCognition Developer 2014) .
3.3 Delineation of LCZ of UHI based on Self-organisation Map
The Object-Based Image Analysis (OBIA), which focuses on objects and allows combining characteristics of shape, texture, context and relationships with neighbours into the image analysis (Blaschke 2010), can provide object-based units carry out the LCZ delineation. We used the ESP2 tool to generate an optimised segmentation scale-50 for the HJ-1B image, and then used the multi-resolution segmentation to divide the original image into 75630 objects with the optimised scale of 50. Taking each object as a unit, we estimated the mean value of the percentage of ISA, LST, surface albedo, NDVI, MOIB and MOOB, in order to further describe the LCZ of UHI.
Depending on the object-based urban climate factors introduced above, Self-Organization Maps (SOM), with the advantages of independence from external evaluation function, recognition of the most meaningful features within vector space, auto stability of network, etc (Kohonen 1990), was used to automatically categorise the urban climate zones into different classes in Guangzhou.
In this study, we firstly used the principal component analysis (PCA) to evaluate the usability of all the parameters, and then combined the optimised parameters as the input for the SOM
classification. As an unsupervised clustering method, the SOM method does not need to prepare the training samples, covering the limits of convergence and holistic optimisation problem in many other automatic learning algorithms, such as BP neural network, Support Vector Machine, etc (H. Chen, Schuffels, and Orwig 1996). We only need to design the size of the input vector and then use the input vector present the multilayer feedforward network. After many repetitions with many sets of vector pairs, a SOM learner will classify multilayer networks from the high dimensions groups into the low-dimensions clusters group. In our study, we chose the hexagonal polygon as the input vector and trained the size input vector from 10 to 50. More details regarding the SOM algorithm can be found in the tutorial of GWmodel in the software R.
4. RESULTS 4.1 The validation of all indicators
The result of the % ISA is shown in Figure 3.a. The residual term RMS of every image pixel was calculated and used to assess the performance of this model (Wu and Murray 2003). The RMSE value of the LSMA algorithm for the HJ-1B image was 0.027, which is lower than the upper limit of model test standard 0.2. Then we conducted 200 random samples to evaluate the classification accuracy, the overall accuracy and the kappa of which are 92.1% and 78.6% separately.
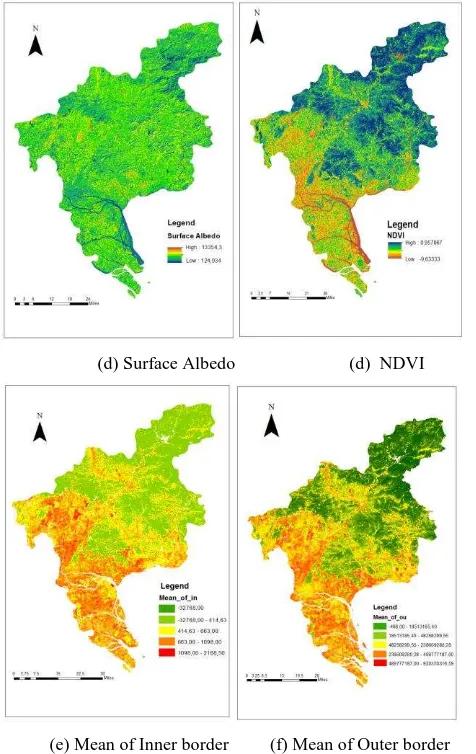
The result of the LST is shown in Figure 3.b. Due to the lack of ground truth data of land surface temperature, the JM&S algorithm was validated by comparing the results with MODIS LST products (MOD11_L2). There was a positive correlation (0.215) between the LST product of MODIS and that of HJ-1B. The validations of other four spectral indicators (surface albedo, NDVI, MOIB, MOOB) which were also lacking the ground truth data were conducted by estimating their correlations with ISA and LST. In this procedure, the LST result was downscaled from 300 metre resolution to 30 metre resolution. The result of bivariate correlation analysis is depicted in Table 1. Except for the parameter MOOB (Figure 3.f), which showed only a slight correlation with the other five parameters, there were strongly positive correlations within all the other parameters. In order to further test the performance of MOOB in the LCZ delineation, we finally decided to use all these six parameters as inputs to describe the UHI zones.
(a) %ISA (b) LST The International Archives of the Photogrammetry, Remote Sensing and Spatial Information Sciences, Volume XLI-B8 2016
(d) Surface Albedo (d) NDVI
(e) Mean of Inner border (f) Mean of Outer border Figure 3. The spectral parameters and climate parameter that
were derived from HJ-1B image
Table 1. The correlations matrix between all climate and spectral parameters (1 is ISA; 2 is LST, 3 is MOIB, 4 is
MOOB,5 is NDVI, 6 is Surface albedo)
1 2 3 4 5 6
1 1 -.579* -.810* .012* .925* -.824* 2 -.579* 1 .569* -.028* -.647* .593* 3 -.810* .569* 1 -.014* -.879* .980* 4 .012* -.028* -.014* 1 .016* -.013* 5 .925* -.647* -.879* .016* 1 -.888* 6 -.824* .593* .980* -.013* -.88** 1 *Correlation is significant at the 0.01 level (2-tailed).
4.2 The contribution of all climate indicators for LCZ of UHI
Table 2 shows the total variance of all components in the Principal Component Analysis (PCA). Table 3 shows the contribution of all the parameters to the first two components of the PCA. The cumulative of the top three principal components sum up to 94.346%, which demonstrates that they can represent well the main characteristics and the interrelationships of all the six relevant climate parameters. In the component matrix, the indicators of the NDVI made the most significant contribution to the first principal component, following by surface albedo,
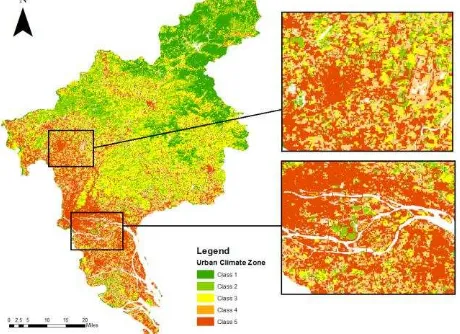
MOIB, and ISA. It means that the indicators concerning the vegetation distribution performed as the basic but the most important parameter in terms of delineating the LCZ. The contribution of the NDVI to LCZ in turn confirmed the interregional interaction in the urban-ecological system of urban areas, in which the landscape heterogeneity feature of vegetation areas directly influence the characteristics of surface albedo, the impervious surface areas, and the spatial pattern landscape surface temperature. The final result of LCZ in Guangzhou (Figure 4) was divided into five classes based on the three principal components of the PCA by the SOM algorithm. The result remains stable as the size of input vector ranges from 10 to 50.
Table 2.Total Variance Explained in PCA
Component
Initial Eigenvalues
Total % of Variance Cumulative %
1 4.113 68.542 68.542
2 1.000 16.670 85.212
3 0.548 9.134 94.346
4 0.260 4.331 98.677
5 0.060 0.997 99.674
6 0.020 0.326 100. 000
Table 3. The Component Matrix of all parameters in PCA Component
1 2
ISA -0.921 -0.013
LST 0.727 -0.030
MOIB 0.946 0.013
MOOB -0.023 0.999
NDVI -0.965 -0.008
Surface
albedo 0.955 0.014
The physical characteristics of LCZ are shown in Table 4. There are obviously differences in the physical characteristics of the mean value of %ISA, LST, MOIB, MOOB, NDVI and Surface Albedo in these five classes. Class 1 and Class 2 are the areas which have a high percentage of impervious surface areas (larger than 70%). These impervious surface areas are mainly located in the south-eastern part of Guangzhou with similar LST attributes (larger than 37. 2 °C), suggesting that the urban heat island phenomenon has influenced the built-up areas to a large degree. Since there is less than 1 °C difference between the entire urban climate zones, growing urban expansion and the urban heat island in Guangzhou has primarily influenced the sub-urban areas.
Table 4. The physical characteristics of LCZ of UHI in different levels
Class %ISA LST MOIB MOOB NDVI Surface 1 12.4 36.5 484.6 465.3 0.747 326.8 2 18.2 36.8 656.8 632.2 0.621 495.6 3 47.4 37.0 777.6 746.1 0.558 633.9 4 73.9 37.2 1154.3 1050.7 0.377 996.1 5 87.5 37.8 1024.3 1000.7 0.337 871.1 The International Archives of the Photogrammetry, Remote Sensing and Spatial Information Sciences, Volume XLI-B8 2016
The mean values of MOIB, MOOB and land surface albedo in Class 4 are larger than that in Class 5, a possible explanation is that mixed-pixel problem in the medium resolution image leads to the uncertainty of the object-based spectral information for built-up areas. The spectral indicators based on medium resolution satellite data performed better in distinguishing the physical characteristics between the built-up areas and the vegetation areas than in separating the high density built-up area and low density built-up areas. Furthermore, the unregularly distribution of the formal and informal settlements in the urban areas of Guangzhou make the landscape configuration and composition analysis become more and more difficult. Nevertheless, these spectral indicators are still consistent with the %ISA and LST indicators and make a contribution to the exploration of the LCZ characteristics.
Figure 4. The result of LCZ in August of 2011,Guangzhou
5. DISCUSSION
Five urban climate zones provide the basis of information for the local government to further sustainable urban planning. The results of urban climate zones in Class 1 and Class 2 show that almost all parts of the central business sub-district in the municipal district of Guangzhou is made up of impervious surface areas and also corresponds to high temperatures (higher than 37°C). This tendency gradually expanded to the south-western districts of Guangzhou. The rapidly urban expansion has no doubt triggered a large area of urban heat island in the municipal district of Guangzhou. The urban heat island problem in this megacity should be enough to attract attention.
Meanwhile, it is worth to notice that the reliability of our study is ultimately restricted by the uncertainty of remote sensing data. The seasons of the image acquirement, the quality of the satellite data, the short term weather condition, and the roughness of the land surface all ultimately influence the LCZ delineation. Our study chose the cloud-free image in August of 2011, the historical climate data show that there is no extreme whether in that month and the temperature kept stable in the summer season, and the vegetation areas in Guangzhou, the southern part of China, were covered by the trees which were green all the year round. Therefore, the LCZ result is possible to demonstrate the local scale of UHI phenomenon in the summer season in 2011 to some extent. The LCZ results in other season will be inevitable influenced by the derivation of LST estimation, which is influenced by the uncertainty of atmospheric and astronomical. Besides, as the urban sprawl, the
directional variation of the measured land surface temperature and shape-texture indicators would be intensified by built-up surface areas, such as business, residential and industrial districts.
Our study can be considered as a first attempt to demonstrate how medium resolution satellite data can assist in quantifying parameters related to the urban climatology, with the ultimate goal of classifying the local climate zones of UHI. The medium resolution data from the Chinese HJ-1B satellite allowed mapping the percentages of impervious surface areas, landscape surface temperature, surface albedo, and landscape spectral and textural features thereof at a reasonable spatial resolution. Moreover, NDVI, which has the highest correlation coefficients with another five parameters, has demonstrated its significant influence on the local climate zones classification. It should be one of the most important parameters to be taken into consideration in the future urban climate zones exploration. According to integrate the relevant climate and spectral parameters, the SOM analysis enables the categorisation of the urban climate zones in Guangzhou without any training samples, it improves the training efficiency and avoids the influence of choosing training samples in the final results. Our model has the advantage of computational convenience, and can be widely applied in the future urban climate zone analysis. However, the inputs parameters may affect the reliability of the modelling. How to choose the spectral-textural-context indicators based on satellite data to describe the local scale urban climate zones is still the problem that needs to address in the next step.
6. CONCLUSION
Our results presented here offer several possible applications for future research. The correlations and contributions of results only suggest a possible way to automatically classify the urban climate zone, but other multi-resources data, including social-economic data, multi-resources Earth Observation products with higher spatial resolution, and climate field survey data can all be integrated into our study, in order to get a more comprehensive urban human environment interaction model. Especially more earth observation high resolution satellite data will potentially help to evaluate the spatial-temporal dynamic change of urban areas, and provide the decision support for further sustainable urban planning.
REFERENCES
Anderson, James Richard. 1976. A Land Use and Land Cover Classification System for Use with Remote Sensor Data. U.S. Government Printing Office.
Blaschke, T. 2010. “Object Based Image Analysis for Remote Sensing.” ISPRS Journal of Photogrammetry and Remote Sensing 65 (1): 2–16.
Chen, Hsinchun, Chris Schuffels, and Richard E. Orwig. 1996. “Internet Categorization and Search: A Self
-Organizing Approach.” Journal of Visual
Communication and Image Representation, Special Issue on Digital Libraries.
Chen, Xiao-Ling, Hong-Mei Zhao, Ping-Xiang Li, and Zhi-Yong Yin. 2006. “Remote Sensing Image-Based Analysis of the Relationship between Urban Heat Island and Land Use/cover Changes.” Remote Sensing The International Archives of the Photogrammetry, Remote Sensing and Spatial Information Sciences, Volume XLI-B8 2016
of Environment, Thermal Remote Sensing of Urban Areas, 104 (2): 133–46.
Drăguţ, L., O. Csillik, C. Eisank, and D. Tiede. 2014. “Automated Parameterisation for Multi-Scale Image Segmentation on Multiple Layers.” ISPRS Journal of Photogrammetry and Remote Sensing 88 (February): 119–27.
eCognition Developer, Trimble. 2014. “9.0 User Guide.” Trimble Germany GmbH: Munich, Germany. Grimm, Nancy B, David Foster, Peter Groffman, J Morgan
Grove, Charles S Hopkinson, Knute J Nadelhoffer, Diane E Pataki, and Debra PC Peters. 2008. “The Changing Landscape: Ecosystem Responses to Urbanization and Pollution across Climatic and Societal Gradients.” Frontiers in Ecology and the Environment 6 (5): 264–72.
Ichii, K., A. Kawabata, and Y. Yamaguchi. 2002. “Global Correlation Analysis for NDVI and Climatic Variables and NDVI Trends: 1982-1990.” International Journal of Remote Sensing 23 (18): 3873–78.
Jiménez-Muñoz, Juan C., and José A. Sobrino. 2003. “A Generalized Single-Channel Method for Retrieving Land Surface Temperature from Remote Sensing
Data.” Journal of Geophysical Research:
Atmospheres 108 (D22): 4688.
Kalnay, Eugenia, and Ming Cai. 2003. “Impact of Urbanization and Land-Use Change on Climate.” Nature 423 (6939): 528–31.
Karl, Thomas R., Henry F. Diaz, and George Kukla. 1988. “Urbanization: Its Detection and Effect in the United States Climate Record.” Journal of Climate 1 (11): 1099–1123.
Kohonen, T. 1990. “The Self-Organizing Map.” Proceedings of the IEEE 78 (9): 1464–80.
Liang, Shunlin. 2001. “Narrowband to Broadband Conversions of Land Surface Albedo I: Algorithms.” Remote Sensing of Environment 76 (2): 213–38.
Lo, C. P., D. A. Quattrochi, and J. C. Luvall. 1997. “Application of High-Resolution Thermal Infrared Remote Sensing and GIS to Assess the Urban Heat Island Effect.” International Journal of Remote Sensing 18 (2): 287–304.
McGranahan, Gordon, Deborah Balk, and Bridget Anderson. 2007. “The Rising Tide: Assessing the Risks of Climate Change and Human Settlements in Low
Elevation Coastal Zones.” Environment and
Urbanization 19 (1): 17–37.
Pettorelli, Nathalie, Jon Olav Vik, Atle Mysterud, Jean-Michel Gaillard, Compton J. Tucker, and Nils Chr. Stenseth. 2005. “Using the Satellite-Derived NDVI to Assess Ecological Responses to Environmental Change.” Trends in Ecology & Evolution 20 (9): 503–10. RIDD, M. K. 1995. “Exploring a V-I-S (vegetation-Impervious
Surface-Soil) Model for Urban Ecosystem Analysis through Remote Sensing: Comparative Anatomy for Cities†.” International Journal of Remote Sensing 16 (12): 2165–85.
Stewart, I. D., and T. R. Oke. 2012. “Local Climate Zones for Urban Temperature Studies.” Bulletin of the American Meteorological Society 93 (12): 1879– 1900.
Streutker, D. R. 2002. “A Remote Sensing Study of the Urban Heat Island of Houston, Texas.” International Journal of Remote Sensing 23 (13): 2595–2608.
Taha, Haider. 1997. “Urban Climates and Heat Islands: Albedo, Evapotranspiration, and Anthropogenic Heat.” Energy and Buildings 25 (2): 99–103.
Wake, Bronwyn. 2012. “Urban Climate: Defining Local Zones.” Nature Climate Change 2 (7): 487–487. Weng, Qihao, Dengsheng Lu, and Jacquelyn Schubring. 2004.
“Estimation of Land Surface Temperature–vegetation Abundance Relationship for Urban Heat Island Studies.” Remote Sensing of Environment 89 (4): 467–83.
Wu, Changshan, and Alan T. Murray. 2003. “Estimating Impervious Surface Distribution by Spectral Mixture Analysis.” Remote Sensing of Environment 84 (4): 493–505.
Yang, Jun, Hua-Zhang Liu, Chun-Quan Ou, Guo-Zhen Lin, Qin Zhou, Gi-Chuan Shen, Ping-Yan Chen, and Yuming Guo. 2013. “Global Climate Change: Impact of Diurnal Temperature Range on Mortality in Guangzhou, China.” Environmental Pollution 175 (April): 131–36.
Yuan, Fei, and Marvin E. Bauer. 2007. “Comparison of Impervious Surface Area and Normalized Difference Vegetation Index as Indicators of Surface Urban Heat Island Effects in Landsat Imagery.” Remote Sensing of Environment 106 (3): 375–86.
Ziska, Lewis H., Dennis E. Gebhard, David A. Frenz, Shaun Faulkner, Benjamin D. Singer, and James G. Straka. 2003. “Cities as Harbingers of Climate Change: Common Ragweed, Urbanization, and Public Health.” Journal of Allergy and Clinical Immunology 111 (2): 290–95.