USING LEGACY SOIL DATA FOR STANDARDIZING PREDICTIONS OF TOPSOIL
CLAY CONTENT OBTAINED FROM VNIR/SWIR HYPERSPECTRAL AIRBORNE
IMAGES.
C. Gomez a, A. Gholizadeh a,b, L. Borůvka b, P. Lagacherie c
a
IRD, UMR LISAH (INRA-IRD-SupAgro), F-34060 Montpellier, France, [email protected] b
Department of Soil Science and Soil Protection, Czech University of Life Sciences, 165 21 Prague, Czech Republic, [email protected]
c
INRA, UMR LISAH (INRA-IRD-SupAgro), F-34060 Montpellier, France, [email protected]
KEY WORDS: VNIR/SWIR spectroscopy; Airborne remote sensing; Clay content mapping; Legacy soil data, Spectral indexes; Mediterranean context.
ABSTRACT:
Mapping of topsoil properties using Visible, Near-Infrared and Short Wave Infrared (VNIR/SWIR) hyperspectral imagery requires large sets of ground measurements for calibrating the models that estimate soil properties. To avoid collecting such expensive data, we proposed a procedure including two steps that involves only legacy soil data that were collected over and/or around the study site: 1) estimation of a soil property using a spectral index of the literature and 2) standardisation of the estimated soil property using legacy soil data. This approach was tested for mapping clay contents in a Mediterranean region in which VNIR/SWIR AISA-DUAL hyperspectral airborne data were acquired. The spectral index was the one proposed by Levin et al (2007) using the spectral bands at 2209, 2133 and 2225 nm. Two legacy soil databases were tested as inputs of the procedure: the Focused-Legacy database composed of 67 soil samples collected in 2000 over the study area, and the No-Focused-Legacy database composed of 64 soil samples collected between 1973 and 1979 around but outside of the study area. The results were compared with those obtained from 120 soil samples collected over the study area during the hyperspectral airborne data acquisition, which were considered as a reference.
Our results showed that: 1) the spectral index with no further standardisation offered predictions with high accuracy in term of coefficient of correlation r (0.71), but also high bias (-414 g/kg) and SEP (439 g/kg), 2) the standardisation using both legacy soil databases allowed an increase of accuracy (r = 0.76) and a reduction of bias and SEP and 3) a better standardisation was obtained by using the Focused-Legacy database rather than the No-Focused-Legacy database. Finally, the clay predicted map obtained with standardisation using the Focused-Legacy database showed pedologically-significant soil spatial structures with clear short-scale variations of topsoil clay contents in specific areas.
This study, associated with the coming availability of a next generation of hyperspectral VNIR/SWIR satellite data for the entire globe, paves the way for inexpensive methods for delivering high resolution soil properties maps.
1. INTRODUCTION
Visible, Near-Infrared and Short Wave Infrared (VNIR/SWIR, 0.4-2.5 µm) spectroscopy is a physical nondestructive, rapid, reproducible, and low-cost method that allows characterization of materials including soils. VNIR/SWIR spectroscopy has been proven to be accurate for the discrimination of soil types and estimation of a large range of soil properties (e.g., Viscarra Rossel et al., 2006; Ben-Dor et al., 2009), such as clay and CaCO3. More recently, VNIR/SWIR hyperspectral airborne imaging has been demonstrated to be a potential tool for topsoil property mapping over large areas (e.g., Selige et al., 2006; Gomez et al., 2008; Stevens et al., 2010).
Various methods have been developed and used to relate soil spectra to soil properties, including spectral indexes (e.g., Gomez et al., 2008; Lagacherie et al., 2008) and partial least-squares regression (PLSR) (e.g., Selige et al., 2006; Stevens et al., 2010). Spectral indexes are based on physical analyses of spectral reflectance, such as slope or absorption band depth value which allow estimating mineral, rock, and soil properties. For example, the absorption band depth values centered at 2206 and 2341 nm can be used to estimate clay (Chabrillat et al., 2002) and CaCO3 (Gaffey, 1986) content, respectively. In the PLSR approach, the full spectrum is used to establish a linear regression model where the significant information contained in
the VNIR/SWIR spectra is concentrated in a few latent variables that are optimized to produce the best correlation with the desired soil property.
The application of these techniques to airborne hyperspectral data included a calibration step that used a set of sites with VNIR/SWIR spectra associated to the studied soil property measured by physico-chemical lab analysis. These sets were sized large enough (> 70) to accurately represent the distributions of soil property over the study area. This induces significant costs that may limit the applicability of such approach. This will become all the more true with the coming availability of the next generation of orbiting hyperspectral sensors and routinely delivered high spectral resolution images for the entire globe.
The aim of this study was to test the use of legacy soil data collected over and/or around the study site, to calibrate a clay spectral index in order to reduce the soil sample collection cost and time. This study employed VNIR/SWIR AISA-DUAL hyperspectral airborne data acquired over a large area (300 km²) in a Mediterranean region.
2. MATERIALS
2.1 Study Area and AISA-DUAL Airborne Data
The study area is located in the Cap Bon region in northern
Tunisia (36°24’N to 36°53’N; 10°20’E to 10°58’E), 60 km east
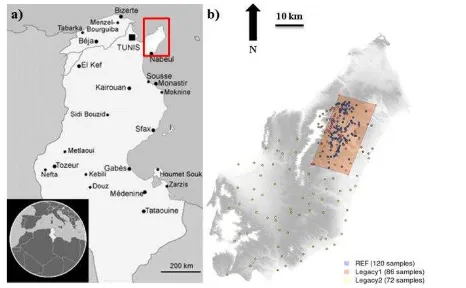
of Tunis (Figure 1a). This 300 km² area includes the Lebna catchment, which is primarily rural (>90 %) and devoted to cereals, legumes, olive trees, natural vegetation for breeding and vineyards.
VNIR/SWIR AISA-DUAL hyperspectral data were acquired in 2010, over the study area (12 × 25 km) with a spatial resolution of 5 m (Figure 1b). The AISA-DUAL airborne imaging spectrometer measures the reflected radiance in 359 noncontiguous bands covering the 400–2450 nm spectral domain. Noisy and atmospheric absorption bands were removed and 249 spectral bands 0.489 µm and 2.451 µm were retained. To isolate the bare soil areas, pixels with Normalized Difference Vegetation Index (NDVI) values over an expert-calibrated threshold were masked. As well water areas were masked using an expert-calibrated threshold and 13 urban areas were identified by visual inspection, and masked. So bare soils represent 46.3% of our study area. The AISA-DUAL airborne data and the study area have been described in details in Gomez et al. (2012).
Figure 1: a) Location of the study area in the Northern Tunisia (Red rectangle), b) Hyperspectral image area (orange rectangle), 120 soil samples of the REF database (blue), 86 soil samples collected in 2000 including the Focused-Legacy database (pink) and 72 soil samples collected between 1973 and 1979 including the No-Focused-Legacy database (yellow) plotted over a DEM of the Cap Bon.
2.3. Soil Field Sampling and Laboratory Analysis
The three following soil datasets differed in the standards of soil sampling and descriptions, the georeferencing methods, the laboratory analysis protocols and the data storage methods. They are most located on arable land.
2.3.1. Reference Soil Database
One hundred and twenty soil samples were collected over the study area covered by the AISA-DUAL data. Among this sample set, 50 samples were collected in June 2008, 30 in October 2009, and 40 in November 2010 (Figure 1b). All of these soil samples were collected in fields that were bare during the hyperspectral airborne data acquisition in November 2010. They were composed of five sub-samples collected to a depth of
5 cm at random locations within a 10×10 m2 square centered on the geographical position of the sampling plot, as recorded by a Garmin GPS instrument.
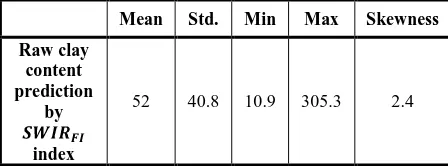
The clay content (granulometric fraction < 2 µm) was determined using a pipette method (method NF X 31-107, particle size distribution by sedimentation) (Baize and Jabiol, 1995). The clay content of the 120 soil samples varied between 108 and 772 g/kg and followed a normal distribution (Table 1). This dataset will be denoted as REF.
2.3.2. Legacy Soil Databases
Eighty-six soil samples were collected in 2000 over the CapBon region (Figure 1b). Among these eighty-six soil samples, only sixty-seven samples located over the study area covered by the AISA-DUAL data were used and denoted as the Focused-Legacy database. All of these soil samples correspond to the first soil horizon of profiles described by the IAO (Instituto Agronomico per l'Oltremare) 20th course professional master
“remote sensing and natural resources evaluation” field survey
staff from 2 to 28 April 2000 according to the IAO framework (IAO, 2002) (Figure 1b). The soil profiles were located initially on topographic maps georeferenced in CGE (Geodetic system Carthage Tunisia) with Lambert coordinates and the Greenwich Meridian as the origin.
Seventy-two soil samples were collected between 1973 and 1979 over the CapBon region (Figure 1b). Among these seventy-two soil samples, only sixty-four samples located outside of the study area covered by the AISA-DUAL data were used and denoted as the No-Focused-Legacy database. All of these soil samples correspond to the first soil horizon of profiles described following a set of specifications that were defined by the Tunisian ministry of Agriculture by adapting existing specifications of the French overseas research institute (ORSTOM – Maignien, 1980). The soil profiles were located initially on topographic maps georeferenced in CGE (Geodetic system Carthage Tunisia) with latitude and longitude coordinates in grade and the Paris Meridian as the origin.
Finally, the Focused-Legacy and No-Focused-Legacy databases were grouped to form the Entire-Legacy database containing 158 soil samples.
The clay content of the Focused-Legacy and No-Focused-Legacy databases was determined by hydrometer method (Baize and Jabiol, 1995). The clay content of Focused-Legacy database varied between 39 and 762 g/kg (Table 1). The clay content of No-Focused-Legacy database varied between 10 and 425 g/kg
Table 1: Statistical measurements of clay contents (g/kg) The International Archives of the Photogrammetry, Remote Sensing and Spatial Information Sciences, Volume XL-3/W3, 2015
3. METHODS
3.1. Spectral Index
The clay contents were predicted from the Clay Index (called index) proposed by Levin et al (2007) using the
spectral bands , and
, and following:
(1)
The HYperspectral SOil Mapper (HYSOMA) software interface was used to derive semi-quantitative soil properties maps from the hyperspectral data. HYSOMA was developed at the GZF German Research Center for Geosciences in the Remote Sensing section and is a software package written in IDL language (www.gfz-potsdam.de/hysoma, Chabrillat et al, 2011).
3.2. Prediction Standardisation
The clay content predictions obtained from the
index were then standardized using a process in three steps. At the first step, a boxcox transformation was applied to transform the distribution of the clay content predictions into normal distribution (Legendre and Legendre, 1984) defined as:
(2)
where is the clay content predictions obtained from the index, is the transformed prediction and α is the transformation parameter. The assumption is that among all transformations with α values between -5 and +5, transformed data has the highest likelihood – but not a guarantee – to be normally distributed when standard deviation is the smallest. This step is independent to a calibration database (legacy or reference).
At the second step the normalized predicted values were scaled from a calibration database as follow:
(3)
where is the mean of the clay contents from the calibration database and is the mean of the .
3.3. Performances Predictions Indicators
The prediction performances of the spectral index were evaluated using the coefficient of correlation r of the predicted values ( or ) against the measured values in the REF database. The coefficient of correlation r is defined as the covariance of the two variables ( or ) and , divided by the product of their standard deviations as follow:
(5)
As recommended by Davies and Fearn (2006), prediction performances analyses have to be also guided by the Standard Error of Prediction (SEP) or Root Mean Square Error of Prediction (RMSEP). The SEP is the parameter commonly used
in the NIR spectroscopy literature to describe the prediction ability of a model. SEP appears as an averaged error recorded on the validation-sample set, and was calculated as follow:
(6)
Where is the clay content of the sample i from the REF database, is the estimated clay content of the sample i from the REF database by the spectral index, and N is the number of soil samples in the REF database.
Finally, the SEP value can be decomposed as follows (Davies
As explained in detailed by Bellon-Maurel et al. (2010), the bias and the (for ‘‘SEP corrected for bias’’) appear as the error of means and the residual variance respectively. and the high bias and SEP (Table 2). These clay predicted values were ranged from 10 to 305 g/kg (Table 3) which were small compared to the one of the REF database (Table 1). Moreover, the distribution of these clay predicted values was not normal
Table 3: Distribution of raw clay content predictions (g/kg) The International Archives of the Photogrammetry, Remote Sensing and Spatial Information Sciences, Volume XL-3/W3, 2015
4.2. Standardized Predictions
Clay contents obtained from the spectral index were
transformed using the boxcox transformation, with α = 0.7 in
equation (2).This step allows the increasing of r from 0.71 to 0.76, without any changes of bias and SEP.
4.2.1. Range and Standard Deviation Transformation Using REF Database
Estimated clay contents after boxcox transformation ( )
were transformed using the REF database following equations (3) and (4). This process allowed to increase the performance of predictions with a significant decrease of bias (8 g/kg) and SEP (around 116 g/kg) (Table 2).
4.2.2. Range and Standard Deviation Transformation Using Legacy Databases
Estimated clay contents after boxcox transformation
( were transformed using the Focused-Legacy and No-Focused-Legacy databases following equations (3) and (4). This process using the Focused-Legacy and No-Focused-Legacy databases allowed increasing the performance of predictions with a decrease in bias (respectively -187 g/kg and -288 g/kg) and SEP (respectively 219 g/kg and 311 g/kg) (Table 2). Finally, estimated clay contents after boxcox transformation
( ) were transformed using the Entire-Legacy database following equations (3) and (4). This process allowed obtaining predictions with a bias of -245 g/kg and a SEP of 269 g/kg (Table 2).
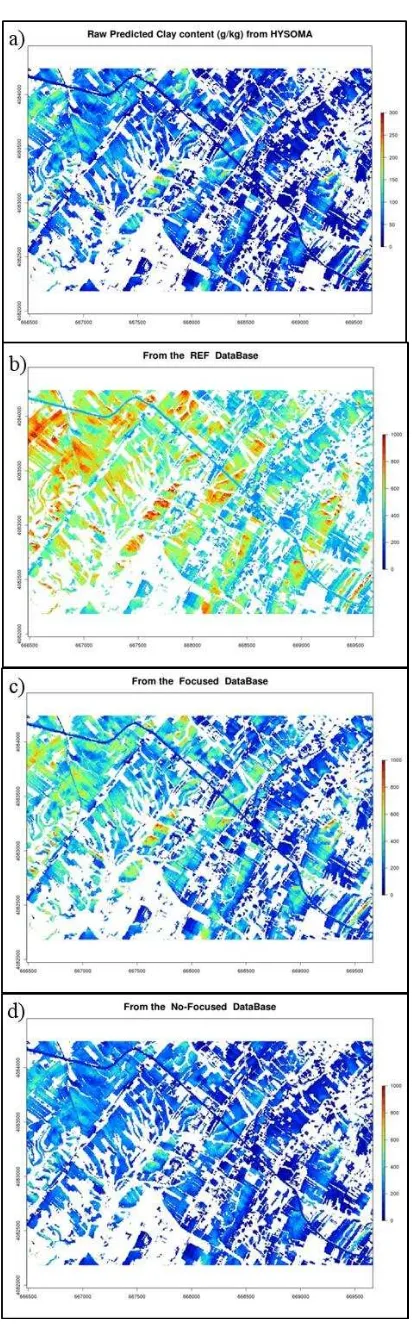
4.3. Clay Predicted Maps
The analysis of the clay predicted maps was focused on a test area. This test area is a 6.67 km² area that is centered on the Kamech catchment, which contained a high percentage of bare soils during image acquisition and exhibited contrasting soil patterns. The Kamech experimental catchment belongs to a long-term environmental research observatory called OMERE (Mediterranean observatory of water and rural environment) which aims to study the anthropogenic impacts on water and sediment budgets at catchment scale (e.g., Mekki et al., 2006; Raclot and Albergel, 2006). The Kamech catchment is characterized by strong variations in soil patterns on a small scale, with a close succession of clay-rich areas and clay-poor areas, oriented northwest/southeast, corresponding to marl and sandstone outcrops, respectively.
The raw clay predicted map was obtained from the spectral index following equation (1) (Figure 2a). And the clay maps of using the REF, Focused-Legacy and No-Focused-Legacy databases were also obtained (Figure 2b, c and d). The estimations at field-scale had low accuracies because of high bias (Table 2). Nevertheless, these maps restricted to the Kamech catchment, showed the close successions of clay-rich and poor-clay areas whatever the soil dataset used for standardisation.
5. DISCUSSION
The clay spectral index proposed by Levin et al (2007) and used without calibration data to estimate relative soil property values, offered accurate estimations (r= 0.71) but highly biased (bias =
-414 g/kg). The standardisation of the estimated clay contents using the REF dataset allows a significant increasing of model performances (r= 0.76 and SEP = 116 g/kg), compared to the model without standardisation. These performances are comparable to those obtained by Lagacherie et al. (2008) also using a clay spectral index and Hymap airborne data (R2 = 0.6 and RMSE = 130 g/kg). Nevertheless, the model performances remain lower than those obtained by Gomez et al. (2015) (R2val = 0.75 and SEP = 86 g/kg) using PLSR technique to estimate clay content from the same datasets than in this study (the VNIR/SWIR AISA-DUAL images and the REF soil data).
The standardisation of the estimated clay contents using legacy soil data allows a slightly increasing of model performances (accuracy increasing and bias decreasing), compared to the model without standardisation. Nevertheless, the model performances remain lower than using the REF dataset, whatever the legacy soil dataset used for the standardisation. The location of the legacy samples is more important than the number of these legacy samples for standardisation. Indeed, the use of a small legacy soil database (~80 samples, Focused-Legacy database) with all samples located over the study area, provides better results than bigger legacy soil database (~150 samples, Entire-Legacy database) including samples located out of the study area. Much of the performances limitations are due to bias of clay measurements that affect the legacy soil databases. This means that these legacy soil databases need to be standardized themselves before using them for such approach, as some attempts has been already done in that objective (Baume et al, 2011, Ciampalini, 2013)
The standardisation applied in our study is composed of a boxcox transformation for normalization of the predicted data, and a scaling and centering of the normalized data. This standardisation process is comparable to one of the most widely used transfer methods for correcting predicted values which is the univariate slope and bias correction (SBC) (Bouveresse et al., 1996). Transfer methods have been developed to enable a calibration model to be effectively transferred between two
“systems” (e.g., two spectroscopic instruments), thus
eliminating the need for a full recalibration (Fearn 2001; Feudale et al., 2002). In our case, we do not have a calibration
model which has to be adjusted to different “systems”, but we
have a model which has to be calibrated with an approximate Lagacherie et al., 2008). This may confirm the independence of our actual observations from the selected spectral index and the topsoil property.
Figure 2: a) Raw_Map, b) Tr_REF_map, c) Tr_Focused_Map, and d) No-Focused_Map of Clay contents (g/kg).
6. CONCLUSION
This paper shows a procedure to estimate relative soil property values from a spectral index applied to VNIR/SWIR AISA-DUAL hyperspectral airborne data, and standardize it with legacy soil data. The maps accuracy depends on the legacy soil data. The more the legacy soil data are focused on the study area, the more the accuracy is high and the soil patterns are mapped.
With the coming availability of a next generation of hyperspectral VNIR/SWIR satellite data for the entire globe (such as the French HYPerspectral X Imagery – HYPXIM –, the Spaceborne Hyperspectral Applicative Land and Ocean Mission – SHALOM –, the PRecursore IperSpettrale della Missione Applicativa – PRISMA –, the Environmental Mapping and Analysis Program –EnMAP – and the Hyperspectral Infrared Imager – HyspIRI –), this study may open new way toward accessible and cheap methods for the delivery of soil properties maps to the geoscience community.
ACKNOWLEDGEMENTS
This research was supported by the French National Research Agency (ANR) through the ALMIRA project (ANR-12-TMED-0003). The authors are indebted to UMR LISAH (IRD, France) and to CNCT (Centre National de Cartographie et de Télédétection, Tunisia), for providing the AISA-DUAL hyperspectral images for this study. This hyperspectral data acquisition was granted by IRD (Institut de Recherche pour le Developpement), INRA (Institut National de la Recherche Agronomique) and the French National Research Agency (ANR) (ANR-O8-BLAN-C284-01).
REFERENCES
Baize, D., and Jabiol, B., 1995. Guide pour la description des sols. INRA édition, Paris.
Baume, O., Skøien, J.O., Heuvelink, G.B.M., Pebesma, E.J., 2011. A geostatistical approach to data harmonization - application to radioactivity exposure data. International Journal of Applied Earth Observation and Geoinformation 13 (3), 409– 419.
Bellon-Maurel, V., Fernandez-Ahumada, E., Palagos, B., Roger, J.M., and McBratney, A., 2010. Prediction of soil attributes by NIR spectroscopy. A critical review of chemometric indicators commonly used for assessing the quality of the prediction. Trac-Trends in Analytical Chemistry. 29 (9), 1073–1081. Ben-Dor, E., Chabrillat, S., Dematte, J.A.M., Taylor, G.R., Hill, J., Whiting, M.L. and Sommer, S., 2009, Using imaging spectroscopy to study soil properties. Remote Sensing of Environment. 113:S38–S55.
Bouveresse, C., Hartmann, D.L., Massart, I.R. Last and Prebble, K.A., 1996. Standardisation of near-infrared spectrometric instruments, Analytical. Chemistry, 68, 982–990.
Ciampalini, R., Lagacherie, P., Gomez, C., Grunberger, O., Hamrouni, H., Mekki, I., and Richard, A., 2013. “Detecting and correcting biases of measured soil profiles data. A case study in
the Cap Bon Region (Tunisia)”. Geoderma. Volume 192,
January 2013, Pages 68-76.
Chabrillat, S., Goetz, A.F.H., Krosley, L., Olsen, H.W., 2002. Use of hyperspectral images in the identification and mapping The International Archives of the Photogrammetry, Remote Sensing and Spatial Information Sciences, Volume XL-3/W3, 2015
of expansive clay soils and the role of spatial resolution. Remote Sensing of Environment 82, 431–445.
Chabrillat, S., Eisele, A., Guillaso, S., Rogaß, C., Ben-Dor, E. and Kaufmann, H., 2011, HYSOMA: An easy-to-use software interface for soil mapping applications of hyperspectral imagery, Proceedings of the 7th EARSeL SIG Imaging Spectroscopy Workshop, Edinburgh, Scotland, UK, 11-13 April 2011.
Davies, A. and Fearn, T., 2006. “Bask to basics: Calibration Statistic”. Spectroscopy Europe, 18, 31.
Fearn, T., 2001. Standardisation and calibration transfer for near infrared instruments: a review. J. Near Infrared Spectrosc 9 (4), 229-244
Feudale, R.N., Woody, N.A., Tan H., Miles A.J., Brown S.D. and Ferre, J., 2002. Transfer of multivariate calibration models: a review, Chemometrics and Intelligent Laboratory Systems 64, 181– 192.
Gaffey, S.J., 1986. Spectral reflectance of carbonate minerals in the visible and near infrared (0.35–2.55 μm): Calcite, aragonite and dolomite. American Mineralogist 71, 151–162.
Gomez, C., Lagacherie, P., and Coulouma, G., 2008. Continuum removal versus PLSR method for clay and calcium carbonate content estimation from laboratory and airborne hyperspectral measurements. Geoderma, 148 (2), 141–148. Gomez C., Lagacherie P. and Bacha S., 2012. Using an Vis-NIR hyperspectral image to map topsoil properties over bare soil surfaces in the Cap Bon region (Tunisia). Digital Soil Assessments and Beyond. CRC Press 2012, Minasny, Malone & McBratney (eds), pp. 387-392.
Gomez C., Oltra Carrio R., Lagacherie P., Bacha S. and Briottet X., 2015. Sensitivity of soil property prediction obtained from Hyperspectral Vis-NIR imagery to atmospheric effects and degradation in image spatial resolutions. Remote Sensing of Environment 164, 1–15.
Lagacherie, P., Baret, F., Feret, J-B, Madeira Netto, J., and Robbez-Masson, J.-M., 2008. Estimation of soil clay and calcium carbonate using laboratory, field and airborne hyperspectral measurements. Remote Sensing of Environment, 112(3), 825-835.
Legendre, L., and Legendre, P., 1983. Numerical ecology. Develop. Environ. Model. V. 3. Elsevier. -, AND -. 1984. Ecologic numerique, 2e ed. Tome 2: La structure des données ecologiques. Collect. Ecol. 13. Masson, p. 39-45.
Levin, N., Kidron, G.J. and Ben-Dor, E., 2007. Surface properties of stabilizing coastal dunes: combining spectral and field analyses. Sedimentology, 54, pp. 771-788.
Madeira, J., Bedidi, A., Cervelle, B., Pouget, M. and Flay, N., 1997. Visible spectrometric indices of hematite (Hm) and goethite (Gt) content in lateritic soils: the application of a Thematic Mapper (TM) image for soil-mapping in Brasilia, Brazil. Int. J. Remote Sens., 18(13), pp. 2835-2852.
Mekki, I., Albergel, J., Ben Mechlia, N. and Voltz, M., 2006. Assessment of overland flow variation and blue water production in a farmed semi-arid water harvesting catchment. Physics and Chemistry of the Earth, 31, 1048-1061.
Raclot, D., and Albergel, J., 2006. Runoff and water erosion modelling using WEPP on a Mediterranean cultivated catchment. Physics and Chemistry of the Earth, 31, 1038-1047.
Selige, T., Bohner, J., and Schmidhalter, U., 2006. High resolution topsoil mapping using hyperspectral image and field data in multivariate regression modeling procedures. Geoderma, 136(1-2), 235-244.
Stevens, A., Udelhoven, T., Denis, A., Tychon, B., Lioy, R., Hoffmann, L., and Wesemael, B., 2010. Measuring soil organic carbon in croplands at regional scale using airborne imaging spectroscopy, Geoderma, 158(1-2), 32-45.
Viscarra Rossel, R.A., Walvoort, D.J.J., McBratney, A.B., Janik, L.J., and Skjemstad, J.O., 2006. Visible, near-infrared, mid-infrared or combined diffuse reflectance spectroscopy for simultaneous assessment of various soil properties. Geoderma, 131, 59–75.