UNFOLDING LEONARDO DA VINCI’S GLOBE (AD 1504) TO REVEAL ITS
HISTORICAL WORLD MAP
Geert J. Verhoeven a, *, Stefaan J. Missinne b
a Ludwig Boltzmann Institute for Archaeological Prospection & Virtual Archaeology, Franz-Klein-Gasse 1, 1190 Vienna, Austria [email protected]
b Independent Scholar and Imcos Representative, Untere Weissgerberstraße 5, 1030 Vienna, Austria [email protected]
Commission II
KEY WORDS: Image-based modelling, Leonardo da Vinci, Map projection, Ostrich egg globe, Renaissance, Unfolding
ABSTRACT:
This paper reports in detail on the image-based modelling and unwrapping approach used to create a two-dimensional projected map of an astonishing ostrich egg globe from AD 1504. This miniature egg globe is not only the oldest extant engraved globe, but it is also the oldest post-Columbian globe of the world and the first ever to depict Newfoundland and many other territories. The intention of digitally recording the surface geometry and colour of this unique artefact was to portray the original layout of the world map used by the Florentine Renaissance artist to make this globe. In addition, it was expected to substantiate iconographical details, which are hard to study at its scale of 1:80,000,000.
The ostrich egg globe is the prototype of the Lenox Globe kept at the New York Public Library. The latter is very beneficial to examine how the egg globe looked like before being glued together at its equator. On the other hand, unfolding the map engraved in the ostrich egg halves enables a more detailed study of the remarkable details visible on both globes, since the engravings on the quasi-white egg surface are much easier to discern than those of the highly reflective red copper Lenox Globe. Finally, a detailed study of the unwrapped 3D surface is essential to learn more about the world vision of its creator and the incredible efforts that went into making this globe. Thanks to some particular pictographic details as well as the way in which the engravings are applied (by a left-handed person), the globe artist can be identified as Leonardo da Vinci.
* Corresponding author
1. INTRODUCTION 1.1 The Renaissance egg globe
Mapping the Earth is a classic problem for which cartographers and mathematicians have come up with hundreds of possible solutions. Although the Earth is not the topic here, this paper will illustrate the complete image-based processing chain that was used to unfold the curved three-dimensional surface of a unique and very small ostrich egg globe onto a flat plane. This recently discovered early sixteenth-century globe, whose age and authenticity have already been confirmed (Missinne, 2013), measures approximately 11.1 cm in diameter.
The Renaissance globe is constructed out of the lower halves of two different ostrich eggs (confirmed by Raman spectroscopy), resulting in a mass of 134 g. As can be seen in Figure 1 and Figure 2, the globe is not painted but has intricately braided waves engraved in anonymous seas and oceans. Those waves bear a faded dark blue/black colour, applied with an iron gall ink. The ink does not rub off, but impregnates the organic material of the surface engravings on the egg shell, which in turn makes the colour last longer (Missinne, 2013).
The egg globe features many wonderful details, all made by a left-handed artist and one of them even drawn using the reverse perspective (a form of anamorphosis of which the earliest known definitive example is attributed to Leonardo da Vinci).
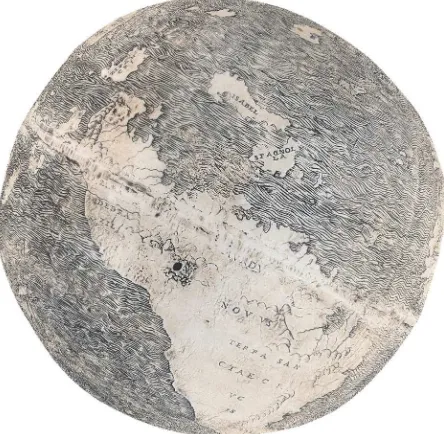
Figure 1. The ostrich egg globe (displayed as a textured 3D surface model and oriented as the Lenox Globe in Figure 3).
As an example, the detailed engravings in the upper part of Figure 2 show a large sailing ship, a square-rigged carrack with one mast, in the eastern Indian Ocean. This carrack is strikingly
similar to one miniature made by Cristoforo de Predis (AD 1440-1486) who was Leonardo da Vinci’s (AD 1452-1519) host in Milan. The lower portion of Figure 2 shows a drowning sailor next to the remains of his sinking ship. The style and mid-neck length of his hair are, according to Elisabetta Gnignera (pers. communication), compatible with the dating of AD 1504 and the provenance (Florence, Italy) of the egg globe.
Furthermore, the globe features a rebus – a sentence expressed pictorially – which is very ingenious: according to the vantage point, it is a drawing of Ionas and the monster or a volcanic island.
Figure 2. The upper part displays a large sailing ship in the eastern Indian Ocean. The lower illustration shows a drowning sailor next to his sinking ship remains. To appreciate the details,
both excerpts of the egg globe feature a 1 cm bar.
The left-handed engravings, the reversed perspective and many other pictorial details all point into the direction of homo universalis Leonardo da Vinci. Finally, yet importantly, the diameter of this egg globe reflects the artist´s knowledge of the span of his Renaissance Earth. Given an empirically determined scale of exactly 1:80,000,000 (Missinne, 2015), this boils down to a diameter of 7000 nautical Mediterranean Renaissance miles (i.e. 8960 km or 29.6 % smaller than the real diameter). This
number is, until today, only known from pages 727r and 311r in Leonardo da Vinci’s Codex Atlanticus (Eng. Atlantic Codex).
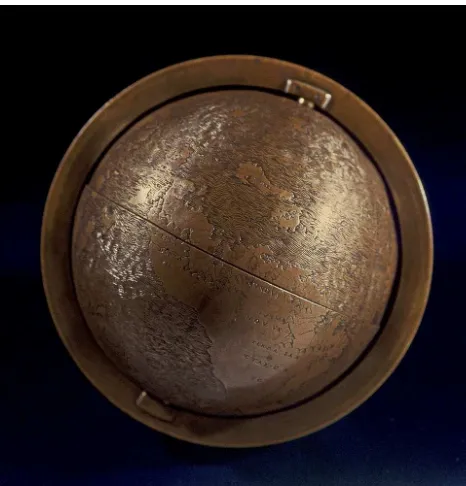
This egg globe is a twin of the Hunt-Lenox Globe (or simply Lenox Globe), currently kept at the New York Public Library (NYPL) and dated between AD 1504 and AD 1506. Prior to the discovery of the ostrich egg globe, the Lenox Globe was considered the earliest post-Colombian globe in existence (Missinne, 2013). The Lenox Globe consists of two halves of a 2 mm thick, lustrous reddish copper alloy, measures circa 11.2 cm in diameter and has 72 Latin inscriptions. Being hollow and featuring two holes on its poles, the Lenox Globe was intended for a lightweight armillary sphere (Missinne, 2013).
Figure 3. The (Hunt-)Lenox Globe. Courtesy of the NYPL Rare Book Division, Astor, Lenox and Tilden Foundations.
After a thorough comparison, it was concluded that the Lenox Globe is a cast of the ostrich egg globe (Missinne, 2013). The minute difference in size is due to the natural shrinkage of the eggshells over time. In addition, computed tomography has revealed a loss of shell density over 50 % due to bacterial decomposition. As such, this egg globe is the prototype and therefore the earliest surviving engraved globe as well as the earliest surviving post-Columbian globe in world history.
1.2 Study objective: flattening an egg without breaking it Since its first publication (Missinne, 2013), research on the egg globe and mutual comparison with the Lenox Globe has continued. However, an essential requirement for much of the planned research was the availability of a high-resolution two-dimensional (2D) depiction of the small and very fragile egg halves. Although the Lenox Globe is instrumental in examining how the egg globe looked like prior to being glued together at its equator, unfolding the ostrich egg halves enables a more detailed study of the remarkable cartographic details since the engravings on the quasi-white egg surface are much easier to discern than those of the highly reflective copper Lenox Globe. Moreover, projecting the surface of the egg globe on a plane was anticipated to provide new general insights, but more importantly, it was expected to shed light on the worldview of the artist who engraved the egg and cast the Lenox Globe.
2. DATA ACQUISITION
Given the very high level of detail of the egg globe (see Figure 2), its full surface geometry should be accurately captured in three dimensions (3D) with a spatial resolution of 0.1 mm or better (0.1 mm to 0.2 mm is about the thickness of the engravings that symbolise the water waves). Since a proper recording of the colour was also wished for, an Image-Based Modelling (IBM) approach relying on a Structure-from-Motion (SfM) and Multi-View Stereo (MVS) pipeline was chosen as the preferred documentation method. The next section first describes the hardware that was used for the image acquisition. In addition, more specific IBM-related details will be provided for the sake of clarity. Afterwards, the processing steps that were used to compute the projected map will be outlined in section three.
2.1 Camera and lens
A Nikon D750, a 24-megapixel full-format reflex camera, was used to acquire the conventional, three-band colour images that represent the amount of reflected visible radiation. The Nikon body was fitted with a prime AF-S VR Micro-NIKKOR 105mm f/2.8G IF-ED lens whose focus ring was immobilised with cellophane tape at a focus distance of 80 cm. The D750 was set to capture 14-bit lossless compressed RAW imagery, with ISO 200 and f/22 dialled for all exposures. Although such a small aperture induces evident diffraction softening, it was still essential to provide sufficient Depth of Field – abbreviated DoF and defined as the range of object distances over which objects appear acceptably sharp in the photograph.
Using a focus distance of 80 cm with a 105 mm lens and f/22 aperture only yields a 6.6 cm long DoF for a full-frame sensor. Since that DoF has a near focus limit at 76.8 cm and a far limit at 83.4 cm, the focal point was placed circa 3 cm behind the front of the egg that faced the camera so that the front-to-middle part of the globe was enclosed by the DoF and rendered acceptably sharp. Since the amount of available illumination was too small to avoid hand-shake induced motion blur, the camera was mounted on a tripod and exposures were taken using a wireless remote shutter release. In addition, the mirror-lockup function was enabled to avoid vibrations that originate from the mirror slap (Verhoeven, 2016a).
2.2 Illumination
Obtaining an even and diffuse illumination for an object such as this egg globe is not a trivial task. To that end, the egg was placed inside a portable Cubelite studio from Lastolite. Three Lastolite lumen8 F400 flash heads provided illumination: one was positioned above the studio and the other two positioned on both sides. All three heads were operated in continuous illumination mode using the 100 W modelling bulbs. Because it features tensioned diffuser fabric, the Cubelite studio is capable of keeping any reflections from the light to an absolute minimum, although they cannot fully prevent it. To further soften the light, a Lastolite 60 cm x 60 cm Ezybox softbox was fixed to the flash head above the egg while the remaining two flash heads were equipped with an 80 cm black/white PVC umbrella. Finally, the front opening of the studio was partly closed with identical diffuser fabric to mask reflections from the camera operator as well. In this way, it was possible to continuously illuminate the egg globe rather uniformly while avoiding major specular reflections (although they could not be entirely omitted as illustrated by Figure 4).
2.3 Camera network
Although SfM reconstruction methods can deliver image orientations and sparse surface data using distinctive features, dense image matching approaches are needed to obtain complete 3D surfaces. For both the SfM and dense matching, the key challenge is the exact geometry and extent of the image network. The latter impacts both accuracy of the dense surface and its completeness (Nocerino et al., 2014), because dense reconstructions based on MVS need a suitable selection of stereo models. In other words, one must take care to properly select the image acquisition stations as well as the image scale to obtain a dense surface that has the right amount of spatial resolution, geometrical accuracy and surface completeness.
Figure 4. One of the photographs from the total IBM-series. Despite the diffuse, rather uniform illumination, some highlights can be noticed on the left and right side of the globe.
To produce a highly accurate map in which even the finest engravings are visible, a minimum spatial resolution for the digitised egg surface of 0.1 mm was deemed essential. Given that two to three pixels are needed to resolve a line feature (i.e. 1 to 1.5 times the Nyquist rate), a 100 µm geometrical resolution necessitates a Scene Sampling Distance or SSD (known as GSD or Ground Sampling Distance in air- and spaceborne imaging) of 50 µm or smaller. With an object distance between the camera and the egg in the [0.77, 0.83] m range and an image sensor photosite pitch of 5.95 µm, the nadir SSD for the Nikon D750 with attached 105 mm lens ranges between 43.5 µm and 47.3 µm. Although these SSDs should be sufficient, halve this SSD would even have been better to fully overcome image softening due to lens aberrations and the effect of diffraction (Verhoeven, 2016a).
Although a shorter object distance could easily accomplish this, it would also negatively affect the DoF and make focus stacking essential. However, without the right (i.e. motorised) equipment, this quickly becomes an extremely lengthy and error-prone solution. As such, it was decided to refrain from a focus stacking approach and acquire the 0.05 mm SSD imagery (all relevant image acquisition parameters are listed in Table 1).
Photographs were shot with the egg positioned in the middle of a rotating table. About 80 images were taken per full rotation. Five full rotations were executed in total, whereby the height of the camera in relation to the egg was changed. Although most images were acquired with the camera in landscape orientation, a few photographs were also generated with the camera 90° rotated, both clock-wise and anti-clockwise to considerably strengthen the network geometry and increase the accuracy of the camera self-calibration during the SfM stage.
Camera Sensor width Sensor height Photosite pitch
Nikon D750 35.9 mm 24.0 mm 5.95 µm
Focal length Aperture Object distance SSD
105 mm f/22 [0.77, 0.83] m [43.5, 47.3] µm Table 1. Overview of the relevant image acquisition parameters.
2.4 Ground control
SfM algorithms are not able to retrieve a correct scale factor because the image bundle generally only provides a network of angles, more specifically the angle between corresponding pixels in different images. To solve this issue of scale ambiguity and at the same time embed constraints in the SfM bundle adjustment (to avoid instability of the bundle solution and mitigate drift in the recovered camera and sparse point locations), three distances were used as ground control. To that end, three rulers with different lengths were included in the scene.
2.5 Image pre-processing
After tagging all NEF files (Nikon Electronic Format, Nikon’s proprietary RAW format) with the correct metadata, they were ’developed’ into 16-bit TIFFs using Adobe Lightroom 5. During conversion, the correct white balance was set using an X-Rite ColorChecker Passport Photo, the global and local contrast of all image files was slightly enhanced and an Adobe RGB (1998) colour profile embedded. All photographs were corrected for lens vignetting but not for lens distortion since the latter is taken care of in the IBM chain that was used to extract 3D geometry from them.
3. DATA PROCESSING
Owing to the recent popularity of (semi-) automated image orientation techniques such as SfM complemented by dense image-matching algorithms embedded in MVS approaches, IBM approaches have become commonplace in cultural heritage documentation. Although several SfM-MVS-based packages enable a (semi-)automated IBM processing pipeline, the 3D surface model was computed using Agisoft’s PhotoScan Professional Edition (version 1.2.6).
3.1 Image orientation
After masking the parts of every photograph that do not belong to the globe (such as background and supporting structures), PhotoScan’s SfM step was run with an unlimited maximum amount of feature points and a maximum of 20,000 tie points per image. After indicating the three distances on all photographs that featured a ruler, the sparse SfM point cloud was cleaned by removing the tie points with the highest reconstruction uncertainty and Reprojection Error (RE). Using the distances and this cleaned sparse point cloud, the bundle adjustment was executed several times to optimise the camera's interior and exterior orientation further. For every re-run of the
bundle adjustment, the amount of optimised interior orientation parameters was varied.
In the end, all possible SfM solutions were tested both quantitatively (in terms of overall and maximum RE as well as image-specific mean RE) and qualitatively (regarding obvious incorrectly positioned cameras and surface artefacts that were visible after densely matching the SfM solution at moderate quality). In the end, solving for three radial (k1, k2, k3) and two decentering lens distortion parameters (p1, p2) yielded the most satisfying result, with a total root-mean-square error for all three distances of 43 µm (which is almost identical to the smallest SSD). In addition, the normalised root-mean-square RE of 0.14 was the lowest of all SfM solutions. Note that PhotoScan computes this normalised error metric by incorporating the image scale at which the tie points were detected (personal communication by Dmitry Semyonov from Agisoft). Since such a normalisation yields errors that are less influenced by sub-optimal image quality (such as blur), an increase of their values – when comparing the results of different SfM runs – most likely indicates problems with the interior or exterior image orientations.
3.2 Two-manifold triangular mesh generation
The final SfM solution was used as input for the subsequent MVS stage, using “Ultra high” (as “Quality”) and “Moderate” (as “Depth filtering”) dense matching parameters. Although the conversion from the resulting unstructured dense point cloud to a continuous polymesh is a complex subject that already received a good deal of scientific attention (Martin and Watson, 2011; Cheng et al., 2013), the cloud of 44.5 M points was directly meshed in PhotoScan (although the final mesh should be hole-free, interpolation was disabled at this stage). First, a small patch on the globe was chosen to assess the geometrical differences between a surface that results from automatic mesh decimation and the geometry yielded by an undecimated meshing step. Since this small test indicated that no major morphological information was lost, PhotoScan was allowed to reduce the total amount of triangles automatically (i.e. “Face count” setting “High”) to come up with a polymesh surface model containing almost 9 M faces.
In the next stage, various mesh errors such as small holes and non-manifold areas were fixed in 3D Systems’ Geomagic Studio 2013. In the end, we could obtain an artefact-free, watertight and two-manifold triangular mesh (Figure 5) with a close to uniform face distribution Although this 3D mesh is perfectly suited to display and study the small undulations on the egg’s surface (Figure 5), a few additional steps are still needed to yield the final 2D map that depicts the unfolded globe. Therefore, a UV unwrapping procedure was put into place to generate a map-like texture for this surface model.
Figure 5. The polymesh as it came out of PhotoScan (left) and the cleaned, watertight mesh (right). Note the differences in and
around the small drilling hole. Moreover, almost all surface engravings (0.1 mm wide on average) are visible.
3.3 2D map generation
To grasp the map generation procedure, it is important to realise that when a 3D surface model features an image texture, it means that every vertex of that surface has texture coordinates u
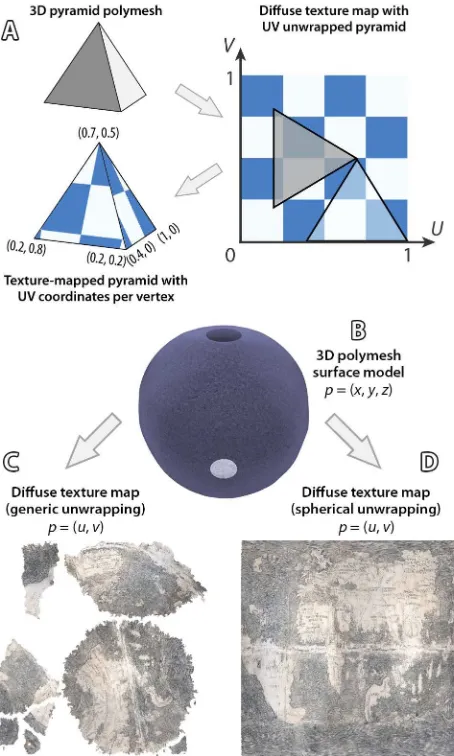
and v associated. These so-called UV texture coordinates (abbreviated “UVs” in computer graphics lingo) map every vertex of the 3D model to a specific location in the texture map (Figure 6A). Since the latter is a 2D image, two coordinates suffice to describe every position in that image. Given that X, Y, and Z are already used to indicate the Cartesian axes of the 3D object in model space, the letters U and V were chosen. Interpolation makes sure that every pixel of the image texture finds its place on the 3D model (Figure 6A). When using a 3D geometry representation structure such as NURBS (Non-Uniform Rational Basis Spline), obtaining UV coordinates is not a problem since NURBS surfaces have them by default. Polygon meshes, however, must have their UV coordinates assigned in a process known as surface parameterisation or UV mapping (Paquette, 2013).
Figure 6. (A) illustrates the process of UV mapping a pyramid. UV unwrapping the globe’s mesh (B) can result in a broken-up diffuse texture map (C) or a continuous diffuse texture map (D).
Although manual UV mapping exists, most IBM applications such as PhotoScan are equipped with automatic and non-interactive parameterisation for generating textures. In practice, this starts by defining the size of the texture map to be used
(e.g. 4096 pixels by 4096 pixels), the specific values of which can be set by the user in most software packages. Afterwards, the texture coordinates of this texture map are matched to the vertices of the 3D model by flattening the model’s surface on a plane. In other words: take every discrete triangular polygon facet of the mesh and lay them all (cleverly or not-so-cleverly) out on the 2D texture map (Figure 6A). Analogous to (un)wrapping a present, this process is commonly denoted unfold or (UV) unwrap. Many automatic solutions, like those embedded in IBM software, yield rather poor results (Cipriani et al., 2014). In most cases, they all produce an uncontrolled number of islands in the (u, v) parameter space. Although PhotoScan offers several texture “Mapping modes” in an attempt to optimally UV unwrap a surface, Figure 6C displays the rather messy parameterisation of the egg globe using the default “Generic” mapping mode. Although it still does the trick of mapping the texture onto the mesh, achieving a more uniform sampling in texture space and wasting less UV map pixels makes sense for various reasons. First, clean and intuitive UV layouts are critical when having to paint on them in an image editor such as Adobe’s Photoshop. Second, optimal texture layouts are very important for managing any stretching, incorrect scaling or overlap effects that might reduce the final visual quality of the textured model (Angel and Shreiner, 2015).
Professional modellers will therefore always choose a manual texture mapping solution to carefully unwrap a mesh, splitting the geometry at well-chosen seams to keep certain polygons intelligently grouped together and end up with sensible UVs. Several UV mapping programs exist, all differing in cost, capabilities and ease of operation. For this project, the stand-alone utility UVMapper Professional was chosen because it features an interactive creation and modification of UV coordinates while it also includes a spherical unwrapping mode (the importance of which will be explained further).
Before unwrapping the egg globe’s 3D surface onto a plane, its orientation was adapted in PhotoScan to align the equator with the X-axis. This reoriented, high-poly count mesh was then decimated in Geomagic Studio 2013. 420 k triangles proved more than sufficient to describe most of the important morphological details of the egg globe while not running the risk of choking UVMapper Professional due to excessive geometry. Since UV unwrapping is very dependent on the quality of the mesh topology, the decimated model was globally retriangulated to produce a more uniform mesh tessellation and remove disproportionate subdivisions. To get rid of very distorted north and south poles in the final map, two small holes were cut at both polar regions, perfectly symmetrical around the Y-axis. The edges of both holes were also remeshed to create a very smooth edge ring (Figure 6B and Figure 7).
Figure 7. The uniform mesh tessellation and smooth edge ring at the globe’s poles both enable a better UV unwrap.
This reoriented, cleaned and uniformly remeshed 3D model was then imported into UVMapper Professional. Even though the egg globe has some irregularities in its shape, it is quasi-spherical and such a known analytic surface is very convenient to unwrap (Karras et al., 1996). One needs to mark only one seam (running from north to south, as a meridian) along which the meshed model is split apart and where the boundaries of the UV map will be located. Then, UVMapper’s spherical map projection mode can unfold the mesh along the equator to a rectangular texture map. After saving this decimated mesh with its new UVs, it was again imported into PhotoScan to generate the texture colours. Choosing “Keep uv” as the “Mapping mode” prevents PhotoScan from re-unwrapping the model. At this point, the texture is generated from the selected source photographs using the existing parameterisation (Figure 6D).
Since a model’s texture map can provide various pieces of data such as transparency (by so-called transparency maps) and surface relief (with normal, bump or displacement maps), a texture with the apparent colour data is sometimes denoted a diffuse texture map (Paquette, 2013). To create a diffuse/colour texture map that reflected the average SSD of 45 µm for the globe’s circumference of 34.9 cm (34.9 / 0.0045 = 7756), a texture size of 8192 pixels by 8192 pixels was chosen in PhotoScan. Upon import in Adobe’s Photoshop CC, the aspect ratio of this 67-megapixel texture map was set to 2:1 again (i.e. twice the width for the height). Note that the correct aspect ratio was set in UVMapper, but that PhotoScan interprets UVs as inherently square (which is logical given that both u and v
coordinates are in the [0, 1] interval). Finally, the edges of the texture were cleaned and blending defects removed (see part 5).
In cartographic terms, one can say that the large texture map resulting from this UV unwrap depicts the unfolded egg globe in a 2D Cartesian coordinate system according to a perfect equirectangular projection. Also known as the cylindrical equidistant or simply rectangular projection, this map projection converts the spherical longitude and latitude coordinates (, ) into planar horizontal and vertical coordinates (x, y) as follows:
0 1 projection is true. Because this spherical projection map uses a formula instead of an arbitrary table to associate UV values with the surface, it is considered a special case of UV mapping (Ebert et al., 2003). Since the globe was positioned perfectly horizontal with the equator in the Y = 0 plane, the unwrapping treated the equator as the standard parallel (i.e. its scale is true and 1 is thus zero). As a result, the mapping equations become very simple (Snyder, 1997):
This means that all the meridians of longitude are mapped to evenly spaced vertical straight lines in the texture map and that likewise, all parallels of latitude are depicted as equidistant horizontal straight lines (for equal changes in longitude and latitude of course). Due to the resulting square graticule, this particular case of the equirectangular map projection is also denoted plate carée (French, meaning flat square) or plane chart
(Snyder, 1997). Although this projection suffers from being neither conformal nor equal area with shape and area becoming increasingly distorted towards the poles (Iliffe and Lott, 2008), it is very suited for mapping the ostrich egg globe because of its simplicity of construction coupled with valuable properties. First, there is the straightforward relationship between a 3D position on the globe and its corresponding 2D location on the map. Moreover, the meridians and the equator are of true scale, which means that distance is correct along them (Snyder, 1997). As a result, the same projection has also been used in other projects that unwrapped globes (e.g. Menna et al., 2012).
4. RESULTS
Figure 5 already illustrated the amount of detail that can be discerned on the 3D surface model. Although these data can be instrumental in the near-future for a detailed, on-surface 3D interpretative mapping (a process of which the technicalities are detailed in Verhoeven, 2016b), the main aim of this study was to produce an unwrapped 2D version of the ostrich egg globe. Although certain improvements to the workflow mentioned above are still possible (see part 5), the final result can already be considered a perfect equirectangular map which is nearly shadowless and specular highlight-free.
In cartography and photogrammetry, it is assumed that the plotting error (i.e. the average graphical accuracy of map drawing and printing) is around 0.2 mm to 0.1 mm (Maling, 1989). In addition, under photopic light levels (i.e. well-lit conditions), the optics of the human eye and the spacing of the foveal cones enable a resolving power of about 1 arc min or 1/60° (depending on various properties such as contrast of the stimuli) in the mid-visible range around 560 nm (Westheimer, 2012). For a normal reading distance of circa 25 cm, this means that adult humans with normal 20/20 vision can resolve points or lines that are approximately 0.07 mm apart under optimal viewing conditions – although even visual acuity values down to 0.5 arc min or 1/120° have been reported (e.g. Hecht and Mintz, 1939), which equals a point separation of 36 µm at 25 cm. However, when using the plotting error and the more conservative visual acuity values, a spatial resolution of 0.1 mm seems a safe threshold for creating a 1:1 scale photographic texture. Given the average SSD of 45 µm, this condition is more than satisfied here and the texture’s spatial resolution would even allow for a maximum map scale of 2:1. It is also possible to prove the latter in another way. A high-quality print usually has 300 ink dots per inch (a number that equals, not coincidentally, a point spacing of 0.08 mm). Given the globe’s circumference of 13.73 inches, a high-quality 2:1 print would, therefore, need 8238 pixels (13.73 * 2 * 300). This is almost identical to the texture size of 8192 pixels.
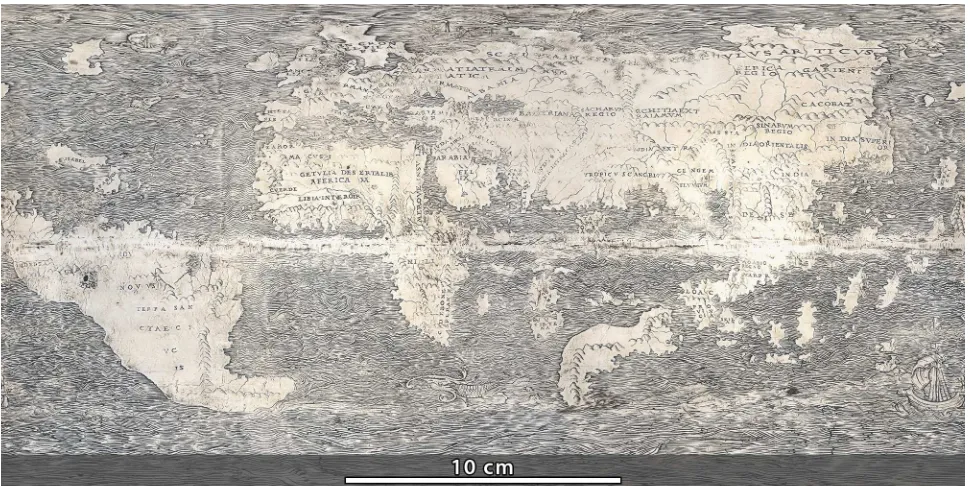
This historic, detailed map allows for the first time to capture the artist’s map layout and to grasp straightforwardly and comprehensively his personal Renaissance world view (Figure 8). This map shows the three known “old” continents Asia, Africa and Europe. It reflects the typical Ptolemaic-enlarged Asia, a recently (AD 1487) circumvented African continent with a horizontal dimension which is rather small, and a European continent with a Mediterranean Sea which bears the Ptolemaic dimension. The New World, Mundus Novus as Amerigo Vespucci called it in 1502, has the iconographic form of a cornucopia, reflecting the richness of the “newly-born” continent. The unnamed island of Newfoundland is the only part of North America that appears on this globe, only five years after Gaspar Corte-Real discovered it in AD 1499.
Figure 8. The entire unfolded surface of the egg globe, depicted with an equirectangular map projection.
This map also shows the 100 % concordance between the Latin inscriptions on the Lenox and the ostrich egg globe. However, the two superior horizontal lines of the last letter E in the sentence CABO DE BONE SPERANZA seem to have not fully captured the ink. Furthermore, the list of originally 71 words in Latin could be completed since the word ANFVROIN, which remains a mystery, was detected above the renowned phrase
HC SVNT DRAGONES. Many of these conclusions could only be drawn (or became simply more evident) after the digitisation and unfolding of the egg globe. In addition, tiny left-over traces of the meridians and the parallels could be detected in the southern part of South America and the large unknown island in the Indian Sea. The artist apparently used a five-degree interval for the meridians and a ten-degree interval for the parallels.
5. POSSIBLE IMPROVEMENTS
As mentioned in the beginning, moving the camera closer to the globe would result in a smaller SSD, but such close-up imaging situations give rise to DoF issues that often make focus stacking mandatory. Although several image-based modelling projects have already been completed with a focus stacking approach (e.g. Clini et al., 2016), more research is needed to truly assess the geometrical properties and proper camera calibration parameters of focus-stacked imagery in the macro range. In addition, photographing with a focus-stacking approach is extremely error-prone and should only be executed in a highly automated manner. Lastly, the sheer amount of imagery becomes very quickly overwhelming. As an example, consider an approach in which the egg globe would be documented using the same Nikon D750 equipped with the 105 mm macro lens at a 1.0x reproduction ratio. Given a globe surface of 384 cm², approximately 1100 images would be needed to cover its whole surface at a 1:1 magnification when aiming for a longitudinal and lateral frame overlap of 80 %. Although the nadir SSD of every photograph would be circa 6 µm, a diffraction-minimising effective aperture of f/11 (which is roughly equivalent to an aperture of f/5.6 when shooting at infinity focus) would yield a DoF of 0.68 mm. Since this means that minimally nine individual pictures have to be collected to
generate a focus-stacked image whose DoF covers about 6 mm (which is approximately the maximal depth range for every 24 mm x 36 mm portion of the globe), the total amount of photographs would amount to roughly 10,000 or more.
On the other hand, getting much closer to the egg would mean that it might be easier to overcome the anisotropic reflectance behaviour of the semi-glossy egg shell. Despite all the attempts to diffuse the illumination, the photographs of the egg still suffered from mild specular reflection (see also Figure 4). As a result, the final map composite had to be generated in Adobe’s Photoshop by carefully blending different textures produced by PhotoScan (using different “Blending mode” algorithms and with/out “Enable color correction”). Although the very short working distances typical for 1:1 macro photography would make ring lights or flashes necessary to properly illuminate the subject, recording a smaller portion of the curved globe surface means that less anisotropic effects come into play. The net result could be a series of photographs in which the reflectance is rendered more uniformly than what could be obtained when photographing the egg globe as a whole.
Finally, a polarised light setup would also make it possible to obtain yet another major illumination improvement. A normal beam of visible electromagnetic radiation is unpolarised, which means that it consists of light waves vibrating in all possible directions. When mounting linear polarising screens in front of such unpolarised illumination sources, only the light waves that vibrate in one particular direction are transmitted. The outcome is a beam of plane or linear polarised light with reduced illuminance (Ray, 1999). After fixing a circular polarising filter in front of the lens and rotating it to until its extinction effect is maximised, all unwanted specular surface reflections will be cut out. The product of such a cross-polarised setup is a photograph that solely records the diffuse reflection component, thereby effectively eliminating any surface glare in the photograph while also rendering the object with increased contrast. It should thus not come as a surprise that polarised light photography is commonly used in high-quality documentation of art (Warda et al., 2011). Due to its unique properties,
polarised data acquisition strategies have also found their way into image-based modelling approaches for cultural heritage objects (Menna et al., 2016).
6. CONCLUSION
Creating a detailed and colour-balanced world map of a very fragile ostrich egg globe was more complicated than most image-based modelling tasks. Although the complete workflow has the potential for improvement, this two-dimensional depiction of a globe that iconographically portrays the birth of the New World is unique in the history of cartography. For the first time, the vast variety of fascinating details on these ostrich eggshells are unfolded: mountains with individually carved tops, littoral delineations, lakes with unknown islands, ships, monsters, uniquely-shaped continents, whirlpool-like oceans, meandering rivers, ocean currents meeting seas, spaces for ports and fresh water supply, a drowning sailor, fishing boats and even a volcanic island. This globe is a didactical tool with a visual vocabulary for a Renaissance adventurer or ruler of that time, showing the newly discovered sea route from Europe to the East (and its spices) via the dangerous seas of the West.
A thorough study of all drawing details and the scale of the globe has previously led to the conclusion that nobody less than the most extraordinary genius of that time, Leonardo da Vinci, was its creator. Wherever one looks on this miniature egg globe, the mathematical and pictorial signature of this Italian polymath and artistic seismograph is apparent. While living in Florence (Italy) in AD 1504, Leonardo not only had access to the most recent maps, but many other sources of knowledge such as engravings and casting techniques. By engraving these highly exotic and very expensive ostrich egg shells, he wanted to stress the birth of the fourth continent: America. Although being named after Amerigo Vespucci, its name is Mundus Novus on the egg globe, exactly like Vespucci called it.
REFERENCES
Angel, E., Shreiner, D., 2015. Interactive computer graphics. A top-down approach with WebGL, 7th edition. Pearson, Boston.
Cheng, S.-W., Dey, T.K., Shewchuk, J.R., 2013. Delaunay mesh generation. CRC Press, Boca Raton.
Cipriani, L., Fantini, F., Bertacchi, S., 2014. 3D models mapping optimization through an integrated parameterization approach. Cases studies from Ravenna. In: The Int. Archives of the Photogrammetry, Remote Sensing and Spatial Inform. Sciences, Riva del Garda, Italy, Vol. XL-5, pp. 173–180.
Clini, P., Frapiccini, N., Mengoni, M., Nespeca, R., Ruggeri, L., 2016. SfM technique and focus stacking for digital documentation of archaeological artifacts. In: The Int. Archives of the Photogrammetry, Remote Sensing and Spatial Inform. Sciences, Prague, Czech Republic, Vol. XLI-B5, pp. 229–236.
Ebert, D.S., Musgrave, F.K., Peachey, D., Perlin, K., Worley, S., 2003. Texturing & modeling. A procedural approach, 3rd edition. Morgan Kaufmann, San Francisco.
Hecht, S., Mintz, E.U., 1939. The visibility of single lines at various illuminations and the retinal basis of visual resolution.
The Journal of General Physiology 22 (5), pp. 593–612.
Iliffe, J., Lott, R., 2008. Datums and map projections for remote sensing, GIS, and surveying. CRC Press, Caithness.
Karras, G., Patias, P., Petsa, E. 1996. Digital Monoplotting and Photo-Unwrapping of Developable Surfaces in Architectural Photogrammetry. In: The Int. Archives of the Photogrammetry, Remote Sensing and Spatial Inform. Sciences, Vienna, Austria, Vol. XXXI Part B5, pp. 290–294.
Maling, D.H., 1989. Measurements from maps. Principles and methods of cartometry. Pergamon Press, Oxford.
Martin, S., Watson, J.-P., 2011. Non-manifold surface reconstruction from high-dimensional point cloud data.
Computational Geometry 44 (8), pp. 427–441.
Menna, F., Nocerino, E., Remondino, F., Dellepiane, M., Callieri, M., Scopigno, R., 2016. 3D digitization of an heritage masterpiece - a critical analysis on quality assessment. In: The Int. Archives of the Photogrammetry, Remote Sensing and Spatial Inform. Sciences, Prague, Czech Republic, Vol. XLI-B5, pp. 675–683.
Menna, F., Rizzi, A., Nocerino, E., Remondino, F., Gruen, A., 2012. High resolution 3D modeling of the Behaim globe. In:
The Int. Archives of the Photogrammetry, Remote Sensing and Spatial Inform. Sciences, Melbourne, Australia, Vol. XXXIX-B5, pp. 115–120.
Missinne, S., 2013. A Newly Discovered Early Sixteenth-Century Globe Engraved on an Ostrich Egg. The Earliest Surviving Globe Showing the New World. The Portolan 87 (Fall), pp. 8–24.
Missinne, S., 2015. America’s Birth Certificate. The Oldest Globular World Map: c. 1507. Advances in Historical Studies
04 (03), pp. 239–307.
Nocerino, E., Menna, F., Remondino, F., 2014. Accuracy of typical photogrammetric networks in cultural heritage 3D modeling projects. In: The Int. Archives of the Photogrammetry, Remote Sensing and Spatial Inform. Sciences, Riva del Garda, Italy, Vol. XL-5, pp. 465–472.
Paquette, A., 2013. An introduction computer graphics for artists, 2nd edition. Springer, New York.
Ray, S.F., 1999. Scientific photography and applied imaging. Focal Press, Oxford.
Snyder, J.P., 1997. Flattening the Earth. Two thousand years of map projections, Paperback edition. University of Chicago Press, Chicago, London.
Verhoeven, G.J., 2016a. Basics of photography for cultural heritage imaging. In: Stylianidis, E., Remondino, F. (Eds.), 3D Recording, Documentation and Management of Cultural Heritage. Whittles Publishing, Caithness, pp. 127–251.
Verhoeven, G.J., 2016b. Mesh Is More—Using All Geometric Dimensions for the Archaeological Analysis and Interpretative Mapping of 3D Surfaces. Journal of Arch. Method and Theory.
Warda, J., Frey, F.S., Heller, D., Kushel, D., Vitale, T., Weaver, G., 2011. The AIC guide to digital photography and conservation documentation, 2nd edition. American Institute for Conservation of Historic and Artistic Works, Washington.
Westheimer, G., 2012. Optical superresolution and visual hyperacuity. Progress in Retinal and Eye Research 31 (5), pp. 467–480.