THE USE OF REMOTE SENSING TECHNIQUE TO PREDICT GROSS DOMESTIC
PRODUCT (GDP): AN ANALYSIS OF BUILT-UP INDEX AND GDP IN NINE MAJOR
CITIES IN CANADA
Kamil Fasial*a,b and Ahmed Shakera
a Department of Civil Engineering, Ryerson University, Toronto, Ontario, Canada (kamil.faisal, ahmed.shaker)@ryerson.ca b Department of Geomatics, College of Environmental Design, King AbdulAziz University, Kingdom of Saudi Arabia
Commission VII, WG VII/4
KEY WORDS: Remote Sensing, Multi Temporal Images, Landsat Images, Built-up area, NDBI, NDVI, Land Use, GIS, Industrial Area, GDP
ABSTRACT:
City/regional authorities are responsible to design and structure the urban morphology based on the desired land-use activities. One of the key concerns regarding urban planning is to establish certain development goals, such as Gross Domestic Product (GDP). In Canada, the gross national income mainly relies on mining and manufacturing industries. In order to facilitate new city development, this study aims to utilize remote sensing and GIS techniques to assess the relationship between the industrial area and the reported GDP in nine major cities in Canada. Free archive multi-temporal Landsat TM images and land use vector data were obtained for year 2005 and 2010 during the summer season, where the socio-economic data, such as GDP, population, and total employment are obtained from Metropolitan Housing Outlook for the same duration. The Landsat TM images were first atmospherically corrected and the built-up values were computed using the Normalized Difference Built-up Index (NDBI) and Normalized Difference Vegetation Index (NDVI) from the Landsat images. The high built-up values within the industrial areas were acquired for further analysis. Finally, a correlation analysis was conducted between the GDP, Population, and Total Employment with respect to the built-up areas. Preliminary findings show that the R2 between the percentage of built-up areas and industrial area within the corresponding city is 0.82. In addition, the R2 between the built-up areas and GDP ranges from 0.73 to 0.78. Consistent findings are observed in the similar correlation between the built-up areas and population, as well as the built-up areas and the employment, where the R2 is within 0.72 to 0.73. With the correlation found, we believe that results can be used as a generic indication for the federal / municipals authorities, which are aiming or target for a specific GDP with respect to the planned industrial area.
1. INTRODUCTION
Remote sensing technique has been used to aid in identifying the land use/ land cover areas by using image classification. Common land use/ land cover features include without limitation to urban (residential, commercial and industrial), water and wetland (Selcuk, 2003). Gross Domestic Product (GDP) mainly relies on the final goods and services, which was produced within a country/city in a certain period of time. In Canada, the gross national income mainly depends on mining and manufacturing industries, and services (Metropolitan Housing Outlook, 2013). Canada is one of the top mining countries and one of the largest producers of minerals and metals. The mining industry rated 21% of the total value of Canadian goods exports in 2010, where 28.6% of the industrial sector contributes to the total GDP in Canada (The Mining Association of Canada, 2011).
Remote sensors acquire images of the Earth surface by recording the solar radiation reflected from targets on the ground. Applications of remote sensing in socio-economic studies aim to map its spatial extent, urban populations (Sutton et al., 2001), intra-urban population density (Sutton, 1997 and Sutton et al., 2003) and economic activities (Sutton and Costanza, 2002). These data can provide valuable information for the municipals authorities and researchers around the world. There are number of researches using satellite remote sensing images for socio-economic studies.
Sutton et al. (2007) demonstrated a case study in four nations (India, China, Turkey, and the United States), to determine the relationships between observed changes in night time satellite images derived from the Defence Meteorological Satellite
Program’s Operational Line scan System (DMSP-OLS), and the changes in population and Gross Domestic Product (GDP). Two approaches were used in this research work to determine the relationship. First, the 1992-93 and 2000 DMSP OLS DMSP OLS night time images were used to measure the economic activity within each nation. The multi-temporal images were used to measure the extended areas from the images. Second, the extended light areas were correlated with the population to compute the GDP. The state level lights were correlated with the state level GDP values using a linear regression model. The results demonstrated high to mid correlation in this case study (R2 0.96 for China, 0.84 for India, 0.95 for Turkey and 0.72 for United state). These results showed a good opportunity to use remote sensing technique as a tool to map economic activity at national and sub-national levels.
Another research was conducted in City of Guangzhou, China (Ma and Xu, 2010). The main goal of this case study was 1) to detect the urban expansion of the built-up area of Guangzhou City in a period of 23 years lasting from 1979 to 2002, 2) to model the urban expansion in Guangzhou City, 3) to correlate the built-up area of Guangzhou City with the GDP, total population, urban resident income and urban traffic of the city.
Multi-temporal Landsat TM images were used in this case study due to the huge archive, which are available to the public for free. Supervised classification (maximum likelihood algorithm) was applied to classify the image and extract the built-up areas. Urban expansion was evaluated by analyzing the dynamic of land use. The results showed that City of Guangzhou extended about 4.5 times from year 1979 to 2002. That gives an indicator that City of Guangzhou extent about of 14.2 km2 average every year. An optimized trinomial equation was applied to determine the correlation between the built-up areas and socio-economic parameters. The relationship between the built-up urban area and the total population was observed with 0.97 correlation coefficient in City of Guangzhou. A value of correlation coefficient 0.98 was determined between the per capita GDP and per capita residence area for urban residents in Guangzhou City. The relationship between the urban road area and the built-up urban area of Guangzhou City was computed and the results showed about 0.96 correlation coefficient between them. The case study showed that economic growth is the main reason for expansion of the built-up urban area, population growth and resident income increase (Ma and Xu, 2010). With inspiration from these studies, in this research work, the authors aim to utilize remote sensing and GIS techniques to assess the relationship between the industrial area and the reported GDP in nine major cities in Canada.
2. DATASETS AND METHODS
2.1 Datasets
Nine major cities (Toronto, Ottawa, Montreal, Quebec City, Winnipeg, Edmonton, Calgary, Vancouver and Victoria) for year 2010 and seven cities (Toronto, Ottawa, Montreal, Quebec City, Edmonton, Calgary and Vancouver) for year 2005 were involved in this study. The datasets of the study contain three categories of data: 1) Landsat TM satellite images, 2) GIS shapefile data and 3) socio-economic data, including GDP, population and total employment.
Landsat Images of year 2005 and 2010 were downloaded from the USGS Earth as shown in Table 1. The spatial resolution for the Landsat images is 30 m for the multi-spectral bands and 60 m for the thermal bands. All these images were imported into PCI Geomatics V10.1, clipped, and then projected into the UTM coordinate system. The atmospheric correction was conducted using sensor parameters data, (sensor type, acquisition date, sun elevation, sun zenith and pixel size) and weather conditions (air temperature and visibility), and subsequently compute the NDVI and NDBI. The acquisition dates from November to March were neglected due to the weather conditions which could affect data results
GIS layers were downloaded from the Scholars GeoPortal for the same cities in 2005 and 2010. The land use layers were imported into the ArcGIS environment for further analysis. All the data were projected to UTM coordinate system.
The socio-economic data can be derived from the census report of each city of Canada. In this study, the social-economic data was obtained from the Metropolitan Housing Outlook for year 2010 and 2005. About three socio-economic parameters such as GDP, total employment, and population for the nine cities in 2010 and seven cities in 2005 were considered in this study. All these data were used in the analysis.
Acquisition Date Landsat Sensors City Jun 10th 2010
Table 1. Multi-temporal Landsat satellite images for 2010 and 2005
2.2 Methodology
Figure 1 shows the overall workflow for this research work, which can be summarized in the following steps. First, the multi-temporal Landsat images were downloaded from the USGS Earth Explorer where the images have been released free to the public since year 2008. Only the multi spectral bands (Band 3, 4 and 5) were used to determine the bio-physical parameters such as NDVI and NDBI from the image. Sixteen Landsat TM images were acquired from years 2010 and 2005. Nine cities (Toronto, Ottawa, Montreal, Quebec City, Winnipeg, Edmonton, Calgary, Vancouver and Victoria) for year 2010 and seven cities (Toronto, Ottawa, Montreal, Quebec City, Edmonton, Calgary and Vancouver) for year 2005 were downloaded from the USGS Earth Explorer. As the acquired Landsat images cover an area of 185×185 km2, the images were clipped to the study area in each city to improve the performance of data processing. Finally, all the subsets of the images were projected into the UTM coordinate system.
Second, before computing the bio-physical parameters, atmospheric corrections were conducted for all the multi-temporal Landsat images. The atmospheric correction model (ATCOR2) developed by Richter (1998) was utilized to calculate the transmission and the up and down radiance. To run the ATCOR2 model, weather information (e.g. air temperature,
visibility, etc.) were obtained from the Government’s national
climate and weather data archive. The calibration parameters for Landsat TM sensor (biases and gains) were also required for an atmospheric correction. After conducting the atmospheric correction, the bio-physical parameters were derived from the multi spectral bands of the Landsat images.
Third, bio-physical parameters such as NDBI and NDVI were used to extract the built-up areas in the Landsat image. The first step to extract the built-up areas is to compute the NDBI value.
NDBI can be calculated by using the following equation
MidIR is the mid infrared band in Landsat image,
NIR is the near infrared band in Landsat image,
B4 is Band 4 in the Landsat TM image, and
B5 is Band 5 in the Landsat TM image.
The next step is to extract the built-up areas by computing the
NDVI value by using the following equation (Jensen, 2005):
4 3
NIR is the near infrared band in Landsat image, Red is the near red band in Landsat image,
B3 is Band 3 in the Landsat TM image, and
Only those positive pixel values were considered to be built-up areas in his study, where this technique reported an accuracy of 92% (Jensen, 2005).
Fourth, only higher positive built-up pixel values were used in this study. Higher positive built-up pixel values were assigned based on the histogram of the built-up image. Statistical method was used to select the higher built-up pixel values. The mean of the histogram of the built-up image was used as a threshold to as shapfiles for the same cities in year 2005 and 2010. Only the land use data were used to extract the Industrial, commercial and residential areas from it. All maps were clipped to the study area in each city to improve the performance of data processing.. The built-up pixels were overlaid with the land use maps to calculate the percentage of built-up pixels that overlaid on each land use areas (industrial, commercial and residential).
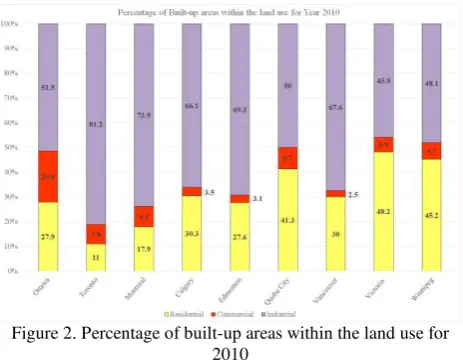
Sixth, social-economic data was obtained from the Metropolitan Housing Outlook for year 2005 and 2010. GDP, total employment, and population were derived for the nine cities in 2010 and seven cities in 2005. A preliminary analysis was carried out to investigate the correlation between the built-up pixels and the GDP, total employment, and population. The correlation between the built-up pixels and the GDP, total employment, and population were accrued during year 2005 and 2010, and a regression analysis was conducted to derive the relationship amongst these four factors. calculated from each land use (industrial, residential and commercial), then the percentage of the built-up areas was computed for each land use in the map. Apparently, most of the built-up areas are located in the industrial and residential zones. However, the built-up areas are occupied mainly on the industrial zones by 50-81% in 2010 and 51-70% in 2005. That is mainly because of the higher reflection of the industrial areas in the image comparing to residential and commercial areas. The industrial areas in mid-latitude environment are mainly containing a massive concrete structure without any notable vegetation on the site. However, the residential areas contain residential buildings and houses. Many of these buildings and houses have vegetation in the front yard and back yard which may affect the reflection in the image.
Figure 2. Percentage of built-up areas within the land use for 2010 more land than those industrial areas in the small cities by 70 to 100 km2 as shown in Table 2. Apparently, the highest percentage of the built-up areas within the industrial zones in 2010 is located in Toronto (81%). However, the lowest percentage of the built-up areas within the industrial zones is
located in Victoria (45%). This could be due to the variation of manufacturing and services industries in Toronto, which are bigger than in Victoria, since Victoria City mainly focuses on tourism industry and residential services (Harris Consulting, 2007).
Built-up areas
(%)
Industrial areas (Km2)
Industrial/Area of City
Area without
water (Km2) Toronto 81.2 108.63 0.17 629.84 Ottawa 51.5 38.47 0.04 1089.47 Montreal 73.8 161.02 0.13 1218.74 Vancouver 67.6 28.47 0.11 251.42
Calgary 66.1 70.54 0.09 811,81 Edmonton 69.3 64.64 0.13 479.39
Quebec
City 50 26.38 0.07 374.33 Winnipeg 48.1 32.5 0.04 739.52 Victoria 45 6.67 0.07 90.34
Table 2. A summary of built-up areas and industrial areas in 2010 for the nine cities in Canada
Figure 3. Percentage of built-up areas within the land use for 2005
Similar to the findings of year 2010, the pixels of the built-up areas in year 2005 are consistently located within the industrial zones in the seven cities ranging from 51% up to 70%. One should note that Victoria and Winnipeg City are missing from the 2005 data due to the availability of the data in the Metropolitan Housing Outlook report. That report was used in section 3.2 to determine the correlation between the percentage of the built-up areas and socio-economic parameters such as GDP, total employment, and population. Figure 2 and 3 show dramatic changes in the percentage of the built-up areas that located within the residential and commercial areas in cities. The percentage of the built-up areas that located within the residential and commercial areas in Quebec City and Ottawa changed from 4.5% to 12% throughout 2005 to 2010. This could be due to the urban sprawl in those two cities. However, the industrial areas in the other cities such as Toronto, Montreal, Vancouver and City of Calgary expanded by 7% to 10% from year 2005 to 2010. This could be because of the urban extension in the industrial sector are more than residential and commercial sector in these four cities.
The highest percentage of the built-up areas within the industrial zones in 2005 is located in City of Toronto (70%). However, the lowest percentage of the built-up areas within the industrial zones is located in City of Ottawa (51%). That is mainly because of the urban sprawl, where the residential areas changed from 24% to 28% from 2005 to 2010 respectively. However, only 0.4% of change was found in the industrial areas from year 2005 to 2010 as shown in Figure 2 and 3. From the two-year (2005 and 2010) study, it was observed that the built-up areas, which located within the industrial zones, are significantly higher than the built-up areas, which located within the residential and commercial areas zones.
Further analysis was conducted to determine the correlation between the percentages of the built-up areas and the industrial areas for year 2005 and 2010. High correlation was observed for both of the built-up areas and industrial areas, where R2 0.82
is detected for the percentages of the built-up areas within the industrial zones in 2010 and R2 0.98 for year 2005 as shown in Figures 4 and 5, respectively.
Figure 4. Relationship between the percentage of built-up areas and the industrial areas for 2010 (R2 = 0.82)
Figure 5. Relationship between the percentage of built-up areas and the industrial areas for 2005 (R2 = 0.98)
3.2 Correlation between the socio-economic parameters and Built up areas
Socio-economic data are provided by the Metropolitan Housing Outlook for more than 25 years. Metropolitan Housing Outlook measures and records the socio-economic parameters such as GDP, total employment, and population for the major cities in Canada. A preliminary analysis was conducted to determine the correlation between the GDP, total employment, and population from socio-economic parameters with respect to the percentage
of the built-up areas derived from the remote sensing images within the industrial zones in year 2005 and 2010. Such analysis has not been performed for the previous literature which adopted Landsat images for industrial landuse and socio- economic parameters correlation.
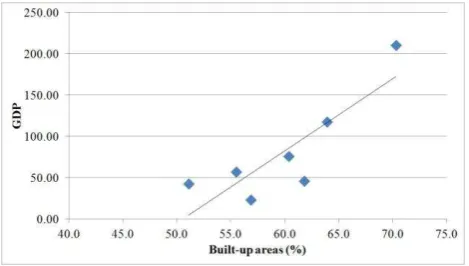
Figures 6, 7 and 8 show the relationship between the percentages of the built-up areas within the industrial zones and the GDP, total employment, and population in 2005 and 2010 respectively. Preliminary analysis revealed that a mid-correlation exists for both of the socio-economic parameters and the percentages of the built-up areas within the industrial zones in 2010. R2 of 0.78 was detected for the percentages of the built-up areas within the industrial zones and GDP. On the other hand, R2
of 0.71 was observed for the percentages of the built-up areas within the industrial zones and population. Furthermore, the correlation between the percentages of the built-up areas within the industrial zones and total employment was R2 0.73.
Figure 6. Relationship between the percentage of built-up areas and GDP for 2010 (R2 = 0.78)
Figure 7. Relationship between the percentage of built-up areas and total employment for 2010 (R2 = 0.73)
Figure 8. Relationship between the percentage of built-up areas and population for 2010 (R2 = 0.71)
However, when Victoria and Edmonton City were eliminated from the data, the correlation between socio-economic parameters and the percentages of the built-up areas within the industrial zones were dramatically changed. The R2 between the percentages of the built-up areas within the industrial zones and GDP jumped from 0.78 to 0.89. The correlation between the percentages of the built-up areas within the industrial zones and population increased from 0.71 to 0.94. The correlation between the percentages of the built-up areas within the industrial zones and total employment improved to be from 0.73 to 0.93 as shown Figures 9, 10 and 11. Victoria and Edmonton City were eliminated from the data due to the low correlation between industrial areas and socio-economic parameters that could be explained by the city of Edmonton which mainly depends on the oil and gas industries (Canadian Centre for Energy Information, 2012), that are located outside the city. Victoria City mainly relies on the tourist and serves industry, where, in 2010, Victoria attracts 3.65 million visitors, which yield major economic benefits for the city (Harris Consulting, 2007).
Figure 9. Relationship between the percentage of built-up areas and GDP without Edmonton and Victoria City for 2010 (R2 =
0.89)
Figure 10. Relationship between the percentage of built-up areas and population without Edmonton and Victoria City for
2010 (R2 = 0.94)
Figure 11. Relationship between the percentage of built-up areas and total employment without Edmonton and Victoria
City for 2010 (R2 = 0.93)
Figures 12, 13 and 14 show the relationship between the percentages of the built-up areas within the industrial zones and the GDP, total employment, and population in 2005, respectively. Similar to year 2010, a mid-correlation was observed for both of the socio-economic parameters and the percentages of the built-up areas within the industrial zones in 2005. R2 of 0.72 is detected for the percentages of the built-up areas within the industrial zones and all of GDP, population and total employment. Since Edmonton was eliminated from the data analysis, the correlation between socio-economic parameters and the percentages of the built-up areas within the industrial zones were changed same as year 2010. The R2
between the percentages of the built-up areas within the industrial zones and GDP jumped from 0.72 to 0.84. The correlation between the percentages of the built-up areas within the industrial zones and all of population and total employment increased from 0.72 to 0.87 as shown Figures 15, 16 and 17.
Figure 12. Relationship between the Percentage of Built-up areas and GDP for 2005 (R2 = 0.72)
Figure 13. Relationship between the percentage of built-up areas and total employment for 2005 (R2 = 0.72)
Figure 14. Relationship between the percentage of built-up areas and population for 2005 (R2 = 0.72)
Figure 15. Relationship between the percentage of built-up areas and GDP without Edmonton City for 2005 (R2 = 0.84)
Figure 16. Relationship between the percentage of built-up areas and population without Edmonton City for 2005 (R2 =
0.87)
Figure 17. Relationship between the percentage of built-up areas and total employment without Edmonton and Victoria
City for 2010 (R2 = 0.87)
In spite of these results, all the fitted regression lines show that the percentages of the built-up areas within the industrial zones have direct proportional relationship to socio-economic parameters that was used in this study. Further analysis was conducted to determine the correlation between the industrial area and the GDP for year 2005 and 2010. Mid-correlations (R2= 0.66 for year 2010 and R2= 0.73 for year 2005) were determined, when Edmonton and Victoria City were involved in the data set as shown Figure 18 and 19. However, high correlations were observed for both of industrial areas and GDP if the aforementioned two cities were eliminated, resulting in R2
of 0.82 for the industrial areas and GDP in 2010 and R2 0.86 for
year 2005 as shown in Figures 20 and 21.
Figure 18. Relationship between GDP and Industrial areas for 2010 (R2 = 0.66)
Figure 19. Relationship between GDP and Industrial areas for 2005 (R2 = 0.73)
Figure 20. Relationship between GDP and Industrial areas without Edmonton and Victoria City for 2010 (R2 = 0.84)
Figure 21. Relationship between the Percentage of Built-up areas and Total employment without Edmonton City for 2005
(R2 = 0.86Conclusions
4. CONCLUSIONS
16 Landsat images (9 images acquired in 2010 and 7 images acquired in 2005) and 16 land use maps were used to study the correlation between the percentage of built-up areas and the industrial zones. The analysis shows a high correlations between the percentage of built-up areas and the industrial zones (R2 = 0.82 for year 2010 and R2 = 0.98 for year 2005). The relationship between the socio-economic parameters and the percentage of built-up areas, which located in the industrial zones, was calculated to determine the correlation between the two parameters. It was found that the percentage of built-up areas, which located in the industrial zones, has mid correlation (R2 = 0.7) to the socio-economic parameters if all cites were considered in the data sets. However, an improvement on the correlation (R2 = 0.87) were observed when Edmonton and Victoria City were eliminated from the data sets for year 2005 and 2010. With the correlation found, the results can be used as a generic indication for the federal / municipals authorities, which are aiming or target for a specific GDP with respect to the planned industrial area.
5. REFERENCES
Canadian Centre for Energy Information. (2012). Evolution of
Canada’s Oil and Gas Industry. Available at: http://www.capp
.ca/getdoc.aspx?dt=PDF&docID=206748. [Accessed Jun 14, 2014].
Harris Consulting (2007). City of Victoria: Downtown and Downtown Fringe Retail Commercial and Hotel Demand Forecast. Available at: http://www.victoria.ca/cityhall/pdfs/ plnpln_downtown_anlyss_appc2.pdf. [Accessed Jun 25, 2014].
Jensen, J. R. (2005). Introductory Digital Image Processing. (3rd Ed.). New Jersey: Pearson Prentice Hall, 544pp.
Ma,Y., and Xu, R.(2010). Remote sensing monitoring and driving force analysis of urban expansion in Guangzhou City, China. Habitat International, 34(2).228-235.
Metropolitan Housing Outlook. (2013). In-Depth Housing Analysis for Canada, the Provinces, and Nine Metropolitan Areas. Available at: http://www.genworth.ca/en/pdfs/
Metropolitan_Housing_Outlook_Autumn13_EN.pdf. [Accessed Jun 19, 2014].
Richter, R. (1998). Correction of satellite imagery over mountainous terrain. Applied Optics, 37(18), 4004-4015.
Selçuk, R., Nişanci, B. Uzun, A. Yalçin, H. Inan and
T.Yomralioğlu. (2003). Monitoring Land–Use Changes by GIS and Remote Sensing Techniques: Case Study of Trabzon. Available at:http://www.fig.net/pub/morocco/proceedings/TS18 /TS18_6_reis_el_al.pdf. [Accessed July 10, 2014].
Sutton, P., and Costanza, R. (2002). Global estimates of market and non-market values derived from nighttime satellite imagery, land use, and ecosystem service valuation. Ecological Economics, 41, 509-527.
Sutton, P., Elvidge, C., and Obremski, T. (2003) Building and Evaluating Models to Estimate Ambient Population Density. Photogrammetric Engineering and Remote Sensing, 69 (5), 545-553.
Sutton, P., Elvidge, C., and Ghosh, T. (2007). Estimation of Gross Domestic Product at Sub-National Scales using Nighttime Satellite Imagery. International Journal of Ecological Economics & Statistics 8(S07), 5-21.
Sutton, P.C., Roberts, D., Elvidge, C.D. and Baugh, K, 2001, Census from heaven: An estimate of the global population using nighttime satellite imagery, International Journal of Remote Sensing, 22 (16), 3061-3076.
Sutton, P.C., Roberts, D., Elvidge, C.D., and Meij, H., 1997, A comparison of nighttime satellite imagery and population density for the continental United States. Photogrammetric Engineering and Remote Sensing, 63, 1303-1313.
The Mining Association of Canada. (2011). Facts & Figures 2011. Available at: http://www.miningnorth.com/wp-content /uploads/2012/04/MAC-FactsFigures-2011-English-small.pdf. [Accessed Jun 28, 2014].