GROUND OBJECT RECOGNITION USING COMBINED HIGH RESOLUTION
AIRBORNE IMAGES AND DSM
Qingming Zhana,b,*, Yubin Liangb,c, Chi Wei b,c, Yinghui Xiaoa,b
a School of Urban Design, Wuhan University, Wuhan 430072, China b
Research Center for Digital City, Wuhan University, Wuhan 430072, China c
School of Remote Sensing and Information Engineering, Wuhan University, Wuhan 430079, China [email protected]; [email protected]; [email protected]; [email protected]
Commission III, WG III/4
KEY WORDS: Ground Object Recognition, High Resolution, LiDAR, DSM, Sparse Representation, L1 Minimization
ABSTRACT:
The research is carried on dataset Vaihingen acquired from ISPRS Test Project on Urban Classification and 3D Building Reconstruction. Four different types of ground objects are extracted: buildings, trees, vegetation (grass and low bushes) and road. Spectral information is used to classify the images and then a refinement process is carried out using DSM. A novel method called Sparse Representation is introduced to extract ground objects from airborne images. For each pixel we extract its spectral vector and solve Basis Pursuit problem using l1 minimization. The classification of the pixel is same as the column vector of observation matrix corresponding to the largest positive component of the solution vector. A refinement procedure based on elevation histogram is carried on to improve the coarse classification due to misclassification of trees/vegetation and buildings/road.
* Qingming Zhan, Professor and Associate Dean of School of Urban Design, Deputy Director of Research Centre for Digital City, Wuhan University.
1. INTRODUTION
In recent years LiDAR (Light Detection And Ranging) has emerged as a new technology which provides valuable data in various forms and scales for mapping and monitoring land cover features. Its use has increased dramatically due to availability of high-density LiDAR data as well as high spatial/spectral resolution airborne imageries. However the data from these different sensors have their own characteristics. Spatial information which can be used to derive highly accurate DSM of scanned objects can be directly obtained from LiDAR data. On the other hand, high resolution airborne imageries offer very detailed spectral/textural information of ground objects. Although aerial photography has been used as a mapping tool for a century, the fusion of aerial photography and LiDAR data has only been possible in the past few years due to advances in sensor design and data acquisition/processing techniques (Baltsavias, 1999). So combining these two kinds of complementary datasets is quite promising for improving land cover mapping (Tao and Yasuoka, 2002).
There have been some attempts to fuse LiDAR and high-resolution imagery for land cover mapping and very promising results are shown in recent years. Haala and Brenner (1999) combined a LiDAR derived DSM with three-color-band aerial images to apply unsupervised classification based on the ISODATA (Iterative Self-Organizing Data Analysis Technique) algorithm to normalized Digital Surface Model (nDSM) and CIR image. In their experiment, nDSM was used to classify objects which had different distribution patterns in elevation direction. The low-resolution LiDAR data was greatly facilitated to separate trees from buildings by the near-infrared band from the aerial imagery. Schenk and Csatho (2002)
exploited the complementary properties of LiDAR and aerial images to extract semantically meaningful information. Rottensteiner et al. (2005) used a LiDAR derived DTM and the Normalised Difference Vegetation Index (NDVI) from multispectal images to detect buildings in densely built-up urban areas. The rule-based classification scheme applied Dempster-Shafer theory to delineate building regions, combining NDVI and the average relative heights to separate buildings from other objects. Ali et al. (2005) applied an automated object-level technique based on hierarchical decision tree to fuse high-resolution imagery and LiDAR data. Sohn and Dowman (2007) presented an approach for automatic extraction of building footprints in a combination of multispectral imagery and airborne laser scanning data. The presented method utilized a divide-merge scheme to obtain the recognized building outline. A comparison of pixel- and object-level data fusion and subsequent classification of LiDAR and high-resolution imagery was carried out by Ali et al. (2009). The results showed that fusion of the color imagery and the DSM generally exhibited better results than sole classification of color imagery.
The underlying assumption of fusion of multisource data is that classification accuracy should be improved due to more incorporated features (Tso and Mather, 2001). Image fusion can be performed at pixel-, object or feature- and decision-levels (Pohl and van-Genderen, 1998; Schistad-Solberg et al., 1994). Pixel level fusion focused on the merging of physical parameters derived from multisource data. It is very sensitive to geo-referencing and pixel spacing and topological information is often not used in the fusion and subsequent procedures. Object-level image fusion methods usually segment multisource data into meaningful objects which consists of many data units.
This kind of fusion techniques are often based on the spectra and spatial characteristics derived from datasets and the segmented objects are combined for further object recognition using fuzzy clustering, hierarchical decision tree and other pattern recognition algorithms (Geneletti and Gorte, 2003).
Nowadays LiDAR data are often derived from one or multi returns of laser pulses and the digital imageries usually contain multispectral bands. With the availability of full-waveform LiDAR data and hyperspectral imageries, the problems of data fusion and pattern classification become more complicated. Opportunities are that high classification accuracy should be achieved due to more spectral and spatial features. But there are still challenges in data processing, waveform modeling and measurements interpretation of full-waveform LiDAR (Wagner et al., 2004).
2. METHODOLOGY
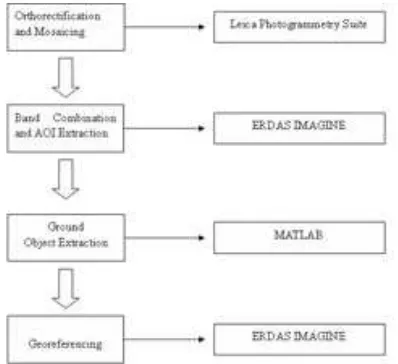
The workflow and software we use are illustrated in Figure 1. The main tasks are described in the following subsections with emphasis on method for ground object extraction.
2.1 Data Preparation
Orientation and registration procedures should be carried out first to guarantee that multisource data are operated under the same spatial framework (Habib, et al., 2006). The provied DSM file with resolution of 25cm is used as reference to orthrectify and mosaic image using given orientation parameters and the task is completed using Leica Photogrammetry Suite.
We combine mosaic image with DSM data and extract Area of interest (AOI) using ERDAS IMAGINE. Area1, Area2 and Area3 are extracted as required and image of each test area has four ‘bands’ (namely IR-R-G-H). All the airborne images are contrast-enhanced before classification.
2.2 Ground Object Extraction
Buildings, trees and vegetation (natural ground covered by vegetation) are extracted in Area1, Area2 and Area3. Before the extraction, we enhance the contrast of image to improve distinctiveness of different ground objects (Figure 2a). The ground object extraction procedure consists of two steps: coarse classification and refinement. Firstly we use spectral information to coarsely classify the images. Then a refinement process is carried out using elevation information. The method we use to extract ground objects is Sparse Representation. The seminal works to refer are (Chen, Donoho, and Saunders 1999; Candès and Tao 2005; Donoho 2006 a,b; Bruckstein, Donoho and Elad 2009; Wright, Yang, Ganesh, Sastry and Ma 2009). The key idea is to represent the spectral vector (vector of IR-R-G value) of a pixel using spectral vectors of pixels of typical ground objects. The problem of classification is formulated as a Basis Pursuit problem and then solved using convex programming (Equation 1) methods in MATLAB.
=
where y is the spectral vector of a pixel and column vectors of observation matrix A are spectral vectors of pixels of typical ground objects. These pixels are interactively selected on the images of test areas. In our implementation, we select five pixels for each typical ground objects (that is trees/vegetation, buildings and road). Then a test procedure is carried out to examine the distinctiveness of spectral vectors we select as observations and vectors which lead to misclassification are updated. Lastly, each pixel of images from test areas is classified using given observation matrix A. The procedure works as follows: for each pixel we extract its spectral vector as y in Equation 1; then we solve Equation 1 using l1 minimization solver; the classification of the pixel is same as the column vector of A corresponding to the largest positive component of the solution vector x (Figure 2b, 4b, 6b). Therefore the methodology we use is under framework of Supervised Classification. And it is in essence a pixel-oriented classification method.
Often we have to refine the coarse classification due to misclassification of trees/vegetation and buildings/road. Refinement is mainly based on elevation histogram. We select values that separate trees/vegetation and buildings/road as thresholds to refine coarse classification results.
The outputs of “Ground Object Extraction” have to be georeferenced due to loss of geoinformation when processing in MATLAB. The classified objects are separately output to files and georeference information is added using ERDAS IMAGINE.
Figure 1: Workflow and the software tools
3. RESULTS
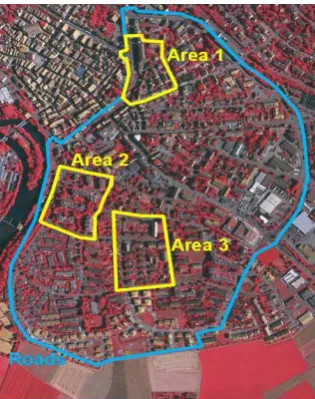
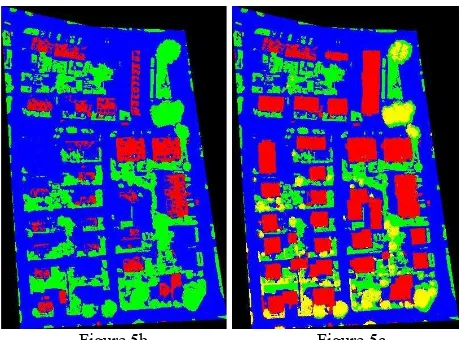
The whole research area is illustrated in Figure 2. Three test areas for buildings/trees/vegetation extraction are outlined in yellow. Test Area 1 consists of house with complex roof structures. The ground objects in Area 2 are mainly trees and buildings. Area 3 The classification results are separately shown in Figure 3a-3c, 4a-4c, 5a-5c). The extracted objects are color-coded as: vegetation (green), trees (yellow), road (blue) and
Figure 2: The Vaihingen test areas overlaid to images 10050105 and 10050107
Figure 3a
Figure 3b Figure 3c Figure 3: Classification result (3b, 3c) of Area1 (3a)
Figure 4a
Figure 4b Figure 4c Figure 4: Classification result (4b, 4c) of Area2 (4a)
Figure 5a
Figure 5b Figure 5c Figure 4: Classification results (5b, 5c) of Area3 (5a)
4. CONCLUSIONS AND FUTURE WORK
In this paper, we introduce Sparse Representation framework to classify the high resolution airborne images and use DSM derived from LiDAR data to improve the classification. It’s a pixel-oriented classification method and under the framework of Supervised Classification. The problem of ground object recognition is formulated as a Basis Pursuit problem and solved using convex programming methods
in MATLAB. The key idea of this method is to represent the spectral vector (vector of IR-R-G value) of a pixel using observation matrix. The observation matrix consists of spectral vectors of pixels of typical ground objects (that is buildings, trees, vegetation and road) which are interactively selected on the images of test areas. A test procedure is carried out to examine the distinctiveness of the selected pixels and pixels which lead to misclassifications are replaced. In the recognition process, each pixel of images from test areas is classified using given observation matrix. Misclassifications often result from both steps of the classification procedure. Misclassifications of buildings and road in coarse classification procedure are mostly due to shadows and spectral similarity. Some low bushes in the shadow at left-bottom of Figure 2b are classified as buildings. All the buildings with similar color like road are misclassified as road (Figure 4b). In the procedure of refinement, misclassifications result from enforcement of only single elevation threshold on classification of ground objects. Adaptive methods that take account of local properties of ground objects and methods based on semantic knowledge may help improve the result. In our future work generality and effectiveness of our method will be further investigated and adaptive methods will be examined.
Acknowledgement
This research is supported by the National Natural Science Foundation of China (No. 40871211). The Vaihingen data set was provided by the German Society for Photogrammetry, Remote Sensing and Geoinformation (DGPF) [Cramer, 2010]:
References
Ali, S., S., Dare, P., Jones, S., 2005. Automatic classification of land cover features with high resolution imagery and lidar data: an object-oriented approach. In: SSC2005 Spatial Intelligence, Innovation and Praxis: The national biennial Conference of the Spatial Sciences Institute. Melbourne, Australia, pp. 512–522.
Ali, S., S., Dare, P., Jones, S., 2009. A comparison of pixel- and object-level data fusion using lidar and high-resolution imagery for enhanced classification. In: Innovation in remote sensing and photogrammetry (Lecture Notes in Geoinformation and Cartography), Edited by Jones, S. and Reinke, K., part 1: 3-17.
Baltsavias, E. P., 1999. A comparison between photogrammetry and laser scanning. ISPRS Journal of Photogrammetry and Remote Sensing 54(2-3): 83–94.
Bruckstein, A., Donoho, D.L. and Elad, M., 2009. From sparse solutions of systems of equations to sparse modeling of signals and images. SIAM Review 50(1): 34-81.
Cande`s E. and Tao, T., 2005. Decoding by linear programming. IEEE Trans. Inf. Theory 51(12), pp. 4203–4215.
Chen, S.S., Donoho, D.L. and Saunders, M.A, 1999. Atomic decomposition by basis pursuit. SIAM Journal on Scientific Computing 20(1): 33–61.
Cramer, M., 2010. The DGPF test on digital aerial camera evaluation – overview and test design. Photogrammetrie – Fernerkundung – Geoinformation 2(2010): 73-82.
Donoho, D.L., 2006a. Compressed sensing. IEEE Trans. Inf. Theory 52(4), pp. 1289–1306.
Donoho, D.L, 2006b. For most large underdetermined systems of linear equations the minimal l1-norm solution is also the sparsest solution. Commun. Pure Appl. Math 59(6),: 797–829.
Geneletti, D., Gorte, B., G. H., 2003. A method for object-oriented land cover classification combining Landsat TM data and aerial photographs. International Journal of Remote Sensing, 24(6): 1273–1286.
Haala, N., Brenner, C., 1999. Extraction of buildings and trees in urban environments. ISPRS Journal of Photogrammetry and Remote Sensing, 54(2-3):130–137.
Habib, A., F., Cheng, R.W.T., Kim, E. M., Mitishita, E. A., Frayne, R., 2006. Automatic surface matching for the registration of LiDAR data and MR imagery. ETRI Journal, 2006, 28 (2): 162-174.
Pohl, C., van-Genderen, J. L., 1998. Multisensor image fusion in remote sensing: concepts, methods and applications. International Journal of Remote Sensing, 19(5): 823–854.
Rottensteiner, F., Trinder, J., Clode, S. and Kubik, K., 2005. Using the Dempster-Shafer method for the fusion of LIDAR data and multi-spectral images for building detection.
Landsat TM and SAR image. IEEE Transactions on Geosciene and Remote Sensing, 32(4): 768–778.
Sohn, G. and Dowman, I., 2007. Data fusion of high-resolution satellite imagery and LiDAR data for automatic building extraction. ISPRS Journal of Photogrammetry and Remote Sensing, 62(1): 43-63.
Tao, G., Yasuoka, Y., 2002. Combining high resolution satellite imagery and airborne laser scanning data for generating bareland dem in urban areas. In: IAPRS, Vol.34 (Part 5/W3): 6 pages.
Tso, B., Mather, P., M., 2001. Multisource classification. In: Classification methods for remotely sensed data. Taylor & Francis, New York, pp. 271–298.
Wagner, W., Ullrich, A., Melzer, T., Briese, C. and Kraus, K., 2004. From single-pulse to full-waveform airborne laser scanners: potential and practical challenges. In: IAPRS, Vol. 35 (Part B3): 201–206.
Wright, J., Yang, A., Ganesh, A., Sastry, S. and Ma, Y., 2009. Robust face recognition via sparse representation. IEEE Trans. Pattern Anal. Mach. Intell 30(2): 210–227.