%G
+
C profiling and cross hybridisation of microbial DNA reveals great
variation in below-ground community structure in UK upland grasslands
Christopher D. Clegg
∗, Karl Ritz, Bryan S. Griffiths
Soil Plant Dynamics Unit, Division of Plant, Soils and Environment, Scottish Crop Research Institute, Invergowrie, Dundee DD2 5DA, UK
Received 27 July 1999; received in revised form 21 January 2000; accepted 26 January 2000
Abstract
Total DNA was directly extracted from microbial populations in grassland soils taken from three geographically distinct upland sites at Garrigill, Aber and Sourhope, UK. Within each site, grasslands were categorised using the National Vegetation Classification into distinct vegetation sequences, namely unimproved, semi-improved and improved. Microbial community DNA was extracted from the different soils and analysed by determining (percent guanine+yctosine) %G+C profiles by thermal denaturation, and by cross hybridisation to measure the degree of similarity between the DNA extracted from the different soils. The %G+C profiles indicated that the microbial community structure within the different grasslands at Garrigill was significantly different. No significant differences in %G+C were detected under the different grasslands at Aber and Sourhope. However, significant differences in %G+C profiles derived from spatially-distinct replicate quadrats taken within grasslands were detected within the semi-improved grasslands at each site, and the unimproved grassland at Aber. Cross hybridisation analysis revealed significant differences between the improved, semi-improved and unimproved grasslands within all sites, with similarity values ranging from 51 to 94%. Significant differences were also detected between replicate quadrats within grassland types by this technique. These results provide evidence for great spatial variation in community DNA (i.e. genetic composition of microbial communities) within these grasslands. © 2000 Elsevier Science B.V. All rights reserved.
Keywords: Community DNA; %G+C profiling; Cross hybridisation; Microbial diversity; Soils; Grasslands
1. Introduction
Plant communities can often be described in terms of the characteristic species of which they are com-posed. What is much less clear is whether this also holds with respect to the microbial communities as-sociated with a particular vegetation type, and the degree to which microbial communities regulate plant
∗Corresponding author. Present address: Institute of Grassland and Environmental Research, North Wyke Research Station, Oke-hampton, Devon EX20 2SB, UK. Tel.: +44-1837-883500; fax: +44-1837-82139.
E-mail address: [email protected] (C.D. Clegg)
communities and vice versa. Microorganisms exist in the soil in the form of complex communities of di-verse composition. Factors regulating such assemblies in soils are poorly understood, although there is some evidence that vegetation affects the density and com-position of soil communities (e.g. Turkington et al., 1988; Chanway et al., 1991; Westover et al., 1997). Mechanisms by which this occurs may be based on the rate and quality of substrate input to soils which plays an important role in governing soil microbial com-munity structure (Griffiths et al., 1999). One of the primary sources of such substrate is material derived from vegetation, ranging from readily-assimilable substrates exuded from the roots of actively growing
plants to more recalcitrant ligno-cellulose complexes which constitute the plants structural material. There is variation in the composition of these components from different plant species, with bacterial selec-tion occuring in the rhizosphere (Lemanceau et al., 1995; Mahaffee and Kloepper, 1997; Siciliano et al., 1998).
One of the difficulties in attempting to understand relationships between plant and microbial community structure is that of description. It is relatively easy to qualify and quantify vegetation composition, whilst it is much more difficult to analyse the composition of soil microbial communities. Traditional culture-based measurements provide both a limited and selective representation of the total community as only 2–4% of bacteria may be readily isolated from soil (Olsen and Bakken, 1987). Phenotypic diversities of microbial populations in soils have been profiled by measur-ing potential function usmeasur-ing BIOLOG (Garland and Mills, 1991), phospholipid fatty acid (PLFA) analysis (Frostegärd et al., 1996) and also fatty acid methyl ester (FAME) analysis (Cavigelli et al., 1995). Molec-ular techniques have also been applied to the study of microbial populations in environmental samples. These have tended towards the application of specific oligonucleotide probes directed at DNA (Guo et al., 1997), rRNA (e.g. Stahl et al., 1988; Kämpfer et al., 1996) or to rRNA sequence analysis of microbial com-munities (e.g. Giovannoni et al., 1990; Stackebrandt et al., 1993). In a more wide ranging approach, reassoci-ation kinetics of DNA extracted from soils have sug-gested that as many as 10,000 different bacterial types may be present in 100 g soil (Torsvik et al., 1996). Such a broad-scale approach based on the analysis of community DNA may offer a useful level of reso-lution for plant:microbe community analyses. Com-munity DNA can be analysed by techniques which provide different but complementary information about the overall genetic structure of the community. These include percent guanine+cytosine (%G+C) profiling (Holben and Harris, 1995; Griffiths et al., 1997; Clegg et al., 1998), community cross hybridis-ation (Lee and Fuhrman, 1990; Griffiths et al., 1996; Clegg et al., 1998) and reassociation kinetics (Torsvik et al., 1990; Ritz et al., 1997; Clegg et al., 1998), denaturing gradient gel electrophoresis (DGGE) (Muyzer et al., 1993) and terminal restriction length polymorphism (Liu et al., 1997).
In this paper we report on %G+C profiling and community DNA cross hybridisation to determine the genetic composition of soil microbial communities under upland grasslands of characteristic vegetation types from three geographically distinct sites in the UK. A central hypothesis in this study was that there is coherence between the structure of plant communi-ties and their associated soil microbial assemblages. By comparing community structure between quadrats, we also examined the degree of spatial variation in community structure within these grasslands.
2. Materials and Methods
2.1. Soils and sampling regimes
Soil samples were taken from each of three sites in the UK, namely Garrigill (National Grid refer-ence NY(35) 761 387), Aber (SH(23) 651 723) and Sourhope (NT(36) 850 205). Within each of the sites were three grassland types characterised by their vascular composition as described in the National Vegetation Classification (Rodwell, 1991) hereafter referred to as unimproved (typically Agrostis,
Fes-tuca dominated), semi-improved (Holcus dominated)
and improved (Lolium dominated) (Table 1). Soil samples were collected by removing 50 random cores (3 cm diameter, 5 cm deep) from each of three
Table 1
National vegetation classification and pH of soils
Site Grassland National vegetation classificationa
pH
Garrigill Improved MG6 5.9
Semi-improved U4b 6.0
Unimproved U4a 5.1
Aber Improved MG6 5.8
Semi-improved U4b 4.7
Unimproved U4a 4.4
Sourhope Improved SL 6.4
Semi-improved SH 5.2
Unimproved SAF 5.6
aAccording to Rodwell (1991). Improved: MG6, SL — typi-cally Lolium, Cynosurus dominated; semi-improved: U4b, SH — typically Holcus, dominated; unimproved: U4a, SAF — typically
replicate 5 m×5 m quadrats within each vegetation sequence. Each set of 50 cores as pooled, sieved through a 2 mm mesh, and stored at−20◦C prior to
use.
2.2. DNA extraction from soils
Total community DNA was extracted from soils by a direct extraction method and purified as described previously (Clegg et al., 1997). Yields of extracted DNA were determined by the diphenylamine reaction (Lichtenstein and Draper, 1985). DNA purity was de-termined after taking absorbance readings at 230, 260 and 280 nm. Values of 1.8 and 2.0 for the absorbance ratios taken at 260:280 and 260:230 nm respectively, are indicative of pure DNA (Sambrook et al., 1989).
2.3. Thermal denaturation of DNA
Melting profiles of DNA samples were determined by placing approximately 1.5mg of DNA in 650ml
of 0.1×standard saline citrate (SSC: Sambrook et al., 1989) in a 1 cm light path quartz cuvette which was heated at 1◦C min−1. Absorbance at 260 nm was
recorded every 6 s using a Perkin Elmer Lambda 2S spectrophotometer. Triplicate aliquots of each sample were heated thus, along with a standard solution of
E. coli DNA (Sigma) to check on the consistency
of heating between runs. Individual melt profiles were normalised to a scale of 0–100%, whereby the largest hyperchromic shift was set at 100% (the ab-sorbance at 90◦C) and the lowest shift set at 0%
(the absorbance at 45◦C). The profiles were
param-eterised by fitting a general logistic equation to the data between 60–90◦C, and transforming the
resul-tant curves to %G+C profiles (Ritz et al., 1997). The curve parameters can be related to microbial genetic community characteristics in terms of the %G+C distribution as follows: curve parameter ‘m’ relates to the median %G+C; parameter ‘b’ (gradient of the slope) indicates whether G+C bases are distributed around a narrow range (i.e. the slope is steeper when there is an abundance of DNA with a similar %G+C content), or more uniformly across the entire range; and ‘t’ relates to the skewness of the distribution, i.e. whether there is a preponderance of low %G+C over high, or vice versa. The melting profiles are
de-scribed mathematically by the three curve parameters, thus significant differences in any of the parame-ters indicates that the melting profiles are different. The curve parameters were analysed by analysis of variance.
2.4. Cross hybridisation of soil DNA
The community DNA cross-hybridisation assay ap-plied was similar to that described previously (Grif-fiths et al., 1996). Briefly, target DNA was prepared by denaturing at 90–95◦C for 5–10 min followed by
rapid cooling on ice. Three replicates of 500 ng of the DNA were dot blotted onto Hybond-N nylon mem-branes (Amersham International, UK). The wells in the dot blot apparatus (BioRad) and DNA spots were washed with 50ml of 5×SSC. Membranes were air
dried before DNA was crosslinked by UV irradiation and baking for 30 min at 80◦C. To generate the probes,
200 ng of soil microbial community DNA was ini-tially digested with the restriction enzyme Rsa1 (Gib-coBRL) to provide an increased hybridisation signal (Griffiths et al., 1996). DNA probes were fluorescein labelled using a random primer labelling kit (Amer-sham International, UK). The probe generation reac-tion was incubated overnight at 30◦C and yield was
determined according to the manufacturers instruc-tions. Hybridisation reactions were carried out using the hybridisation buffer recommended by the manu-facturer (Amersham International, UK). Membranes were allowed to prehybridise for 1 h at 60◦C. The
hybridisation buffer was then removed and replaced with fresh hybridisation buffer at 0.3 ml cm−2 mem-brane. Heat denatured labelled probe was added to the hybridisation buffer at 10 ng ml−1 and allowed to hybridise at 60◦C for 20–24 h. Membranes were
washed and a luminescent signal generated accord-ing to manufacturers instructions. Intensity of the hy-bridisation signals on the membranes was determined by measuring light output from each dot using a lu-minometer (Dynotech, California). Similarity indices,
S, of the DNA samples were calculated as previously
described (Lee and Fuhrman, 1990; Griffiths et al., 1996). Briefly, S=(Rs−Rb)/(Rc−Rb)×100%, where Rs
is the signal from the sample (target) spot, Rc is the
signal from the control spot (i.e. same DNA as probe) and Rb is the background signal from bank spots.
cal-culated using a bootstrap procedure (Griffiths et al., 1996). If the target and probe DNA have the same genetic composition then the reciprocal cross of the target-probe hybridisation will give the same S value. If one DNA sample is more diverse (i.e. has a greater range of genetic sequence types) than the other, then
S is not equal and the pair of values are asymmetric
(Lee and Fuhrman, 1990; Griffiths et al., 1996). The probe giving the highest S value is the more diverse of the two samples and the ‘true’ degree of similar-ity is denoted by the lower of the two hybridisation values (Lee and Fuhrman, 1990; Ritz and Griffiths, 1994).
The assay was carried out using two classes of DNA sample. One class involved the cross hybridis-ation of DNA extracted from the individual quadrats within each vegetation type at each site; this tested for the degree of similarity in community DNA between quadrats within vegetation types. A second class tested
Table 2
Yields and purities of DNA extracted from grassland soils
Site Grassland Quadrat Yield (mg g−1 dry soil) Abs. ratio 260:280 Abs. ratio 260:230
Garrigill Improved 1 6.30 1.52 1.76
(MG6) 2 13.6 1.32 2.02
3 35.7 1.35 2.21
Semi-improved 1 35.7 1.31 1.85
(U4b) 2 17.1 1.48 2.02
3 21.2 1.46 2.08
Unimproved 1 29.0 1.38 1.96
(U4a) 2 33.6 1.35 2.13
3 47.5 1.42 2.01
Aber Improved 1 19.4 1.71 1.60
(MG6) 2 27.3 1.66 1.50
3 23.8 1.85 1.74
Semi-improved 1 32.8 1.61 1.29
(U4b) 2 26.9 1.38 1.11
3 14.7 1.58 1.16
Unimproved 1 44.1 1.25 0.96
(U4a) 2 34.9 1.51 1.12
3 45.9 1.66 1.28
Sourhope Improved 1 20.23 1.98 1.78
(MG6) 2 19.68 1.96 1.78
3 30.10 1.74 1.50
Semi-improved 1 57.42 1.53 1.19
(U4b) 2 69.82 1.31 1.06
3 25.50 1.66 1.20
Unimproved 1 14.96 1.74 1.44
(U4a) 2 19.58 1.58 1.58
3 49.84 1.60 1.23
for similarity between vegetation types within sites, and was based on aliquots of DNA produced by pool-ing DNA from each of the quadrats within a vegeta-tion type.
2.5. Statistics
Results of the various analyses were considered sta-tistically significant at p<0.05.
3. Results
3.1. Yield and purity of DNA from the soils
repli-cate quadrats were least for the improved grasslands, there was no significant difference in DNA yield between vegetation sequences at Garrigill and also at Sourhope. At Aber however, the mean yield of DNA was significantly greater from the unimproved grassland than from the semi-improved and improved grasslands.
3.2. Thermal denaturation of DNA
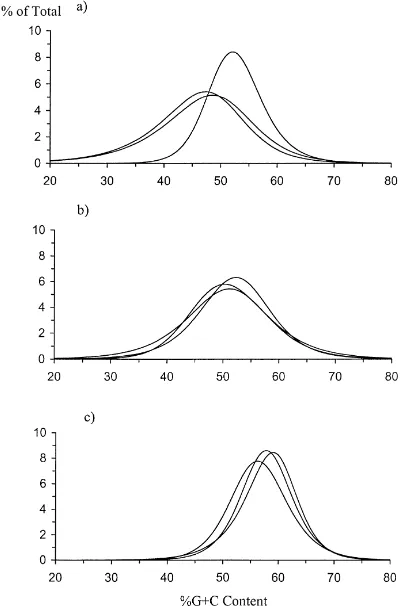
The %G+C distribution profiles for the three grass-lands at Garrigill are shown in Fig. 1. The %G+C distribution profile for the improved grassland at Gar-rigill (Fig. 1) informs us that 9% of the total ex-tracted DNA was a G+C content of about 58%. Sim-ilarly, Fig. 1 also illustrates that 6% of the unim-proved DNA at Garrigill was about 49% G+C and 5.8% of the semi-improved DNA was about a 51% G+C content. Melting profile parameters were anal-ysed by factorial ANOVA with an increasing hierar-chy of replicate melts per DNA sample. This enabled the analysis of replicate quadrats within each grass-land type, grassgrass-land types at a single site, and dif-ferent sites. Lowest error mean square (EMS) values were always obtained for replicate melts, but there was no distinct hierarchy in EMS for the other fac-tors. In some instances there was as much variation between quadrats as between grassland types and be-tween sites. The %G+C distribution profiles of repli-cate quadrats from each of the three grassland types at
Fig. 1. The %G+C distribution profiles for unimproved (· · ·-), semi-improved (– –) and improved (—) grasslands at Garrigill.
Fig. 2. The %G+C distribution profiles for replicate quadrats within (a) unimproved; (b) semi-improved; and (c) improved grass-lands at Garrigill.
Garrigill are given in Fig. 2. Significant differences of curve parameters in grasslands were only detected be-tween sites, and not within sites, in a combined anal-ysis (Table 3). Within-site analanal-ysis indicated signifi-cant differences in the DNA melting curve parame-ters between replicate quadrats within some individual grasslands (Table 3). Within-site analysis of the pa-rameters at the vegetation sequence level also revealed that at Garrigill parameters b and m were significantly greater for the improved than the semi-improved and unimproved grasslands. An increase in the value of
b is indicative of a general narrowing of the range
Table 3
Melting curve parameters and median %G+C composition for the vegetation sequences at Garrigill, Aber and Sourhopea
Site Grassland b m t %G+C
Garrigill Improved 0.66 81.0 1.46 62.3 Semi-improved 0.51 78.6∗
1.44 57.9 Unimproved 0.52 77.5∗
1.24 55.3
Aber Improved 0.45 78.4 1.83 57.3 Semi-improved 0.51 79.8∗ 1.53 59.9 Unimproved 0.51∗ 78.3∗ 2.93∗ 56.9
Sourhope Improved 0.65 79.8 1.86 59.9 Semi-improved 0.57∗ 78.8∗ 1.73∗ 58.0 Unimproved 0.67 80.0 2.47 60.4
LSDb 0.20 3.79 1.28
aLSD values obtained from the combined analysis of all three sites.
bLSD: least significant difference. ∗
Significant differences between replicate quadrats within grassland type.
and unimproved grasslands. No significant differences in the DNA melting curve parameters were detected between the grasslands within the sites at Aber and Sourhope.
3.3. Cross hybridisation of DNA
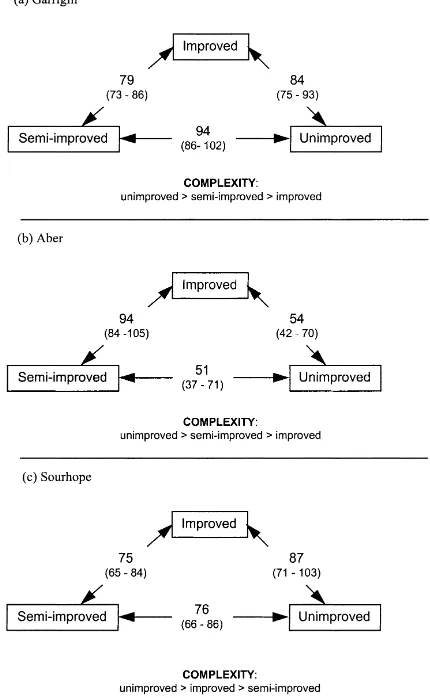
Hybridisation couplets were generally asymmetric, i.e. when probe and target were switched the S values were significantly different. This permits the deter-mination of which sample was the more complex in terms of DNA species content. When the sample used as the probe gives the higher S value in the hybridisa-tion couplet, this is indicative that its DNA is the more complex of the pair, whilst the lower index reflects the relative similarity between the samples. Thus the data are summarised in Figs. 3 and 4 by showing the lowest value of the hybridisation couplets and the ranking of complexity established on the basis described earlier. For pooled DNA samples, representing the average community DNA within each grassland type, the de-gree of similarity was around 80% for all three vegeta-tion types at Garrigill and Sourhope (Fig. 3). However at Aber, greater variation between grassland types was evident, with unimproved and semi-improved types only showing around 50% similarity (Fig. 3). There was also a general trend at the Garrigill
Fig. 3. Percentage similarity indices (S), with 95% confidence in-tervals in brackets, for cross hybridisations of DNA extracted from unimproved, semi-improved and improved vegetation sequences at (a) Garrigill; (b) Aber; and (c) Sourhope.
Fig. 4. Percentage similarity indices (S), with 95% confidence intervals in brackets, for cross hybridisations of DNA extracted from replicate quadrats within (a) unimproved; (b) semi-improved; and (c) improved vegetation sequences at the Aber site.
4. Discussion
The DNA used in this study was obtained by a di-rect extraction procedure, as opposed to the extraction of DNA from micro-organisms separated from soil particles by fractionation techniques. Although DNA extracted by fractionation contains fewer contaminat-ing humic substances, direct extraction is the preferred method in community DNA studies. Direct extraction generally recovers greater quantities of DNA from soil which are required for melting profiles and cross hy-bridisations as used in this study. Indeed, DNA ob-tained by direct extraction is considered to be more representative of the total soil microbial population (Harris, 1994), and it is considered that community
DNA extracted using lytic approaches is predomi-nately bacterial (Torsvik et al., 1995). Some of the DNA purity values in Table 2 indicate that contami-nation occurred; this is inevitable with upland grass-land soils which tend to be highly humified. We have previously shown that microbial DNA obtained from such soils using this extraction protocol is suitable for use in molecular biological studies (Clegg et al., 1997).
BIOLOG (Garland and Mills, 1991) and FAME pro-files (Cavigelli et al., 1995) and also by process-based determinations such as denitrification assays (Parkin et al., 1987). Indeed previous polymerase chain re-action based DGGE profiling of extracted DNA did not reveal spatial arrangements in the microbial com-munity in soil (Duineveld et al., 1998). The spatial variation at the genetic level of microbial communi-ties in this study may have been related to the vari-ation in plant species composition of the individual quadrats.
Although no significant differences in some in-dividual melting curve parameters were detected between grassland types within sites, this is not nec-essarily indicative of the same DNA composition. Melting profiles which are similar indicate that the microbial DNA from the soils is either the same in terms of micro-organisms present and their abun-dance, or that the communities are composed of different organisms, but with similar %G+C con-tent. Conversely, differing melting curves may be indicative of the presence of similar micro-organisms with differences in their relative abundance, or of communities which are composed of different micro-organisms. In such instances cross hybridisa-tion of community DNA is needed as a complementary measure.
Thus, the melting profiles did not discriminate be-tween the three vegetation sequences at Aber, suggest-ing that the DNA composition was similar in %G+C composition, but cross hybridisation revealed that it was different in terms of actual sequence arrangement. This was also the case for the Sourhope site where melting profiles were similar for the three vegetation sequence types, whilst the reciprocal cross hybridisa-tions were different. Cross hybridisation results for the Garrigill site indicated, as did those from the melting profiles, that the DNA from the improved grassland was different from that from the semi-improved and unimproved grassland. As with the results from the melting profiles, the cross hybridisations revealed significant differences in similarity between DNA from replicate quadrats within the three grassland types.
At the Garrigill and Aber sites the ranking of the order of DNA complexity (higher ‘S’ value), viz.; unimproved>semi-improved>improved is con-sistent with that found at another upland site (Clegg
et al., 1998). At Sourhope the unimproved grassland DNA was again the most complex, however, the im-proved DNA was found to be more complex than the semi-improved based on the cross hybridisation data. A problem is that ‘complexity’ is a compound param-eter, incorporating two aspects of community com-position, i.e. richness (number of individual species present) and evenness (the relative proportions of these individuals in making up the whole). The cross hybridisation assay accommodates both these prop-erties in a complex manner and as such provides a broad-scale view of the community structure. For ex-ample, the % similarity indices, from the reciprocal cross hybridisation of DNA from the improved and semi-improved vegetation sequences at Aber indicate that they are 94% similar (Fig. 3). However, this re-ciprocal cross was asymmetric. An interpretation of this is that the numbers of ‘species types’ are roughly the same for the two samples, however, their rela-tive abundance is different. Thus in the unimproved soils from Sourhope, it is possible that there was a greater proportion of one type of DNA prevailing when sampled, since there was a high b value in these samples. However, more detailed and consid-erably more laborious, community structure analyses such as denaturing gradient gel separations and rRNA gene sequence analysis are necessary to verify such inferences.
made in this study with assessments focusing on more specific components with the intention to study the functionality of these groups. This would also allow the establishment of the scales of variation of both plant and microbial community composition, and whether any associated coupling is related to such scales.
Acknowledgements
We thank Alexandra Holmes for technical assis-tance, Jim McNicol for statistical advice and Jane Mawdsley for soil pH values. The vegetation sequence classifications were determined by John Rodwell and Sue Edwards, Lancaster University, UK. This work was funded by the Scottish Office Agriculture, Envi-ronment and Fisheries Department under their Flexi-ble Funding Scheme and is part of the MICRONET Co-ordinated Programme of Research.
References
Cavigelli, M.A., Robertson, G.P., Klug, M.J., 1995. Fatty acid methyl ester (FAME) profiles as measures of soil microbial community structure. Plant Soil 170, 99–113.
Chanway, C.P., Turkington, R., Holl, F.B., 1991. Ecological implications of specificity between plants and rhizosphere micro-organisms. Adv. Ecol. Res. 21, 121–169.
Clegg, C.D., Ritz, K., Griffiths, B.S., 1997. Direct extraction of microbial community DNA from humified upland soils. Lett. Appl. Microbiol. 25, 30–33.
Clegg, C.D., Ritz, K., Griffiths, B.S., 1998. Broad-scale analysis of soil microbial community DNA from upland grasslands. Anton. Leeuw. Int. J. G. 73, 9–14.
Duineveld, B.M., Rosado, A.S., van Elsas, J.D., van Veen, J.A., 1998. Analysis of the dynamics of bacterial communities in the rhizosphere of the chrysanthemum via denaturing gradient gel electrophoresis and substrate utilisation patterns. Appl. Environ. Microb. 64, 4950–4957.
Frostegärd, Ä., Tunlid, A., Bääth, E., 1996. Changes in microbial community structure during long-term incubation in two soils experimentally contaminated with metals. Soil Biol. Biochem. 28, 55–63.
Garland, J.L., 1996. Patterns of potential C source utilisation by rhizosphere communities. Soil Biol. Biochem. 28, 223–230. Garland, J.L., Mills, A.L., 1991. Classification and characterisation
of heterogeneous microbial communities on the basis of patterns of community-level sole-carbon source utilisation. Appl. Environ. Microb. 57, 2351–2359.
Giovannoni, S.J., Britschgi, T.B., Moyer, C.L., Field, K.G., 1990. Genetic diversity in Sargasso sea bacterioplankton. Nature 345, 60–63.
Griffiths, B.S., Ritz, K., Glover, L.A., 1996. Broad-Scale approaches to the determination of soil microbial community structure: application of the community DNA hybridisation technique. Microbiol. Ecol. 31, 269–280.
Griffiths, B.S., Diaz-Ravina, M., Ritz, K., McNicol, J.W., Ebblewhite, N., Bååth, E., 1997. Community DNA hybridisation and %G+C profiles of microbial communities from heavy metal polluted soils. FEMS Microbiol. Ecol. 24, 103–112. Griffiths, B.S., Ritz, K., Ebblewhite, N., Dobson, G., 1999. Soil
microbial community structure: effects of substrate loading rates. Soil Biol. Biochem. 31, 145–153.
Guo, C., Sun, W., Harsh, J.B., Ogram, A., 1997. Hybridisation analysis of microbial DNA from fuel oil-contaminated and non contaminated soil. Microbiol. Ecol. 34, 178–187.
Harris, D., 1994. Analyses of DNA extracted from microbial communities. In: Ritz, K., Dighton, J., Giller, K.E. (Eds.), Beyond the Biomass: Compositional and Functional Analysis of Soil Microbial Communities. Wiley, Chichester, UK, pp. 111–118.
Holben, W.E., Harris, D., 1995. DNA-based monitoring of total bacterial community structure in environmental samples. Mol. Ecol. 4, 627–631.
Kämpfer, P., Erhart, R., Beimfohr, C., Böhringer, J., Wagner, M., Amann, R., 1996. Characterisation of bacterial communities from activated sludge: culture-dependant numerical identification versus in situ identification using group-and genus-specific rRNA-targeted oligonucleotide probes. Microbiol. Ecol. 32, 101–121.
Lee, S., Fuhrman, J.A., 1990. DNA hybridisation to compare species compositions of natural bacterioplankton assemblages. Appl. Environ. Microb. 56, 739–746.
Lemanceau, P., Corberand, T., Gardan, L., Latour, X., Laguerre, G., Boeufgras, J.-M., Alabouvette, C., 1995. Flax (Linum
usitatissinum L.) and tomato (Lycopersicon esculentum Mill.),
on the diversity of soilborne populations of fluorescent pseudomonads. Appl. Environ. Microb. 61, 1004–1012. Lichtenstein, C., Draper, J., 1985. Genetic engineering of plants. In:
Glover, D.M. (Ed.), DNA Cloning, Vol. 2. IRL Press, Oxford, pp. 67–120.
Liu, W.-T., Marsh, T.L., Cheng, H., Forney, L.J., 1997. Characterisation of microbial diversity by determining terminal restriction fragment length polymorphisms of genes encoding 16S rRNA. Appl. Environ. Microbiol. 63, 4516–4522. Mahaffee, W.F., Kloepper, J.W., 1997. Temporal changes in
the bacterial communities of soil rhizosphere and endorhiza associated with field-grown cucumber (Cucumis sativus L.). Microbiol. Ecol. 34, 210–223.
Muyzer, G., de Waal, E.C., Uitterlinden, A.G., 1993. Profiling of complex microbial populations by denaturing gradient gel electrophoresis analysis of polymerase chain reaction-amplified genes coding for 16S rRNA. Appl. Environ. Microbiol. 59, 695–700.
Parkin, T.B., Starr, J.L., Meisinger, J.J., 1987. Influence of sample size on measurement of soil denitrification. Soil Sci. Soc. Am. J. 51, 1492–1501.
Ritz, K., Griffiths, B.S., 1994. Potential application of a community hybridisation technique for assessing changes in the population structure of soil microbial communities. Soil Biol. Biochem. 26, 963–971.
Ritz, K., Griffiths, B.S., Torsvik, V.L., Hendriksen, N.B., 1997. Analysis of soil and bacterioplankton community DNA by melting profiles and reassociation kinetics. FEMS Microbiol. Lett. 149, 151–156.
Rodwell, J.S., 1991. British Plant Communities, Vol. 1–4. Cambridge University Press, Cambridge.
Sambrook, J., Fritsch, E.F., Maniatis, T., 1989. Molecular Cloning: A laboratory Manual, 2nd Edition. Cold Spring Harbor Laboratory Press, Cold Spring Harbor, New York.
Siciliano, S.D., Theoret, J.R., de Freitas, J.R., Huci, P.J., Germida, J.J., 1998. Differences in the microbial communities associated with the roots of different cultivars of canola and wheat. Can. J. Microbiol. 44, 844–851.
Stackebrandt, E., Liesack, W., Goebel, B.M., 1993. Bacterial diversity in a soil sample from a subtropical Australian environment as determined by 16S rDNA analysis. FASEB J. 7, 232–236.
Stahl, D.A., Flesher, B., Mansfield, H.R., Montgomery, L., 1988. Use of phylogenetically based hybridisation probes for studies of ruminal microbial ecology. Appl. Environ. Microb. 54, 1079– 1084.
Torsvik, V., Daae, F.L., Goksøyr, J., 1995. Extraction, purification and analysis of DNA from soil bacteria. In: Trevors, J.T., Van-Elsas, J.D. (Eds.), Nucleic Acids in the Environment: Methods and Applications. Springer, Berlin. pp. 29– 48.
Torsvik, V., Goksøyr, J., Daae, F.L., 1990. High diversity in DNA of soil bacteria. Appl. Environ. Microb. 56, 782–787. Torsvik, V., Sørheim, R., Goksøyr, J., 1996. Total bacterial diversity
in soil and sediment communities — a review. J. Ind. Microbiol. 17, 170–178.
Turkington, R., Holl, F.B., Chanway, C.P., Thompson, J.D., 1988. The influence of microorganisms, particularly Rhizobium, on plant competition in grass–legume communities. In: Davy, A.J., Hutchings, M.J., Watkinson, A.R. (Eds.), Plant Population Ecology. Blackwell Scientific Publications, Boston, Massachusetts, USA, pp. 343–366.