LASER SCANNER AND CAMERA-EQUIPPED UAV ARCHITECTURAL SURVEYS
N. Maiellaro a, *, M. Zonno a, P. Lavalle b
a ITC-CNR, Construction Technology Institute, via Lembo 38 B, 70125 Bari, Italy - (n.maiellaro, m.zonno)@itc.cnr.it b Pavimental S.p.A., Corso del Mezzogiorno 202, 71122 Foggia, Italy - [email protected]
Commission V, WG V/4
KEY WORDS: Laser scanner, UAV, 3D modelling
ABSTRACT:
The paper reports the workflow of 3D modelling and photorealistic texture mapping based on close range imagery acquired through a terrestrial laser scan and a camera mounted on a mini Unmanned Aerial Vehicle (UAV). The 3D models of the same architectural object – a watchtower named “Torre Pelosa” (Bari, Italy) - were compared in order to evaluate strengths and weaknesses of the used instruments and methods. The evaluated parameters where geo-referencing capability, manageability, manoeuvrability, operational constraint, survey completeness and costs. Despite a lower accuracy of the results, the use of a UAV mounted camera is essential to obtain a whole representation of the tower.
* Corresponding author. N. Maiellaro: Introduction and Conclusions; M. Zonno: Results; P. Lavalle: Architectural Surveys 1. INTRODUCTION
This paper is based on the results of a postgraduate thesis at the Polytechnic of Bari in partnership with the Construction Technology Institute of the National Research Council. The aim was to compare textured 3D model of the “Pelosa” tower based on two systems: a laser scan with external camera and a camera mounted on a mini Unmanned Aerial Vehicle (UAV).
The use of an UAV complies with the requirement, as a prerequisite for adequate results, to have camera movement between each photo: fixed camera installation on a moveable crane or a tripod might reduce the number of shots and perspectives but influence negatively the result (Kaiser et al., 2014).
The work has been developed on “Torre Pelosa”, built in the 15th century in order to defend the coast from pirates and raiders infesting the Adriatic Sea. It is a watchtower that still exists at the centre of the main square of Bari suburb.
Because not all points of the building were visible from the ground, aerial images are fundamental for a full building coverage; moreover a foggy weather is optimal to take pictures without shadows, having all distinguishable. Unfortunately, each image set was acquired on a cloud free and windy day, therefore it was difficult to recognize details in the shadow areas as well as it was not possible to fly on roofing.
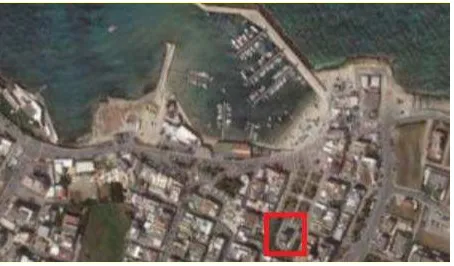
Due to insurance-related claims - the tower is located in an urban area (Figure 1) - the UAV was used in a VTOL (Vertical Take-Off and Landing) mode of operation in a limited time: the risks for personal injury had to be kept as low as possible (Eschmann et al. 2012).
During the fieldwork, using both methods, the complete settlement was documented in half-day; the post-processing was done using RiscanPro, Photoscan and Cloudcompare.
Figure 1: The tower location (Google maps).
2. ARCHITECTURAL SURVEYS
2.1 Laser Scanner Architectural Survey
For the image acquisition using a ground station we used the laser scan a Microgeo's RIEGL VZ-400 which has a close range of 500 meters and gives a full wave form analysis of scans, a scanning angle of 360° horizontal and 100° vertical at 122.000 points/second. The station is equipped with an external Nikon D700 camera (10 megapixel; 20 mm lens) and a GPS for an absolute orientation of the images in a global system.
At first, we placed targets all around the tower and acquired data and photos from eight different stations located around the building Targets are very important during the data acquisition because of their retro-reflective material that mirrors the narrow infrared laser beam (Figure 2).
Figure 2: Laser scanner stations (Google maps).
Figure 3: “Find reflectors” function.
Figure 4: Registration into a PRCS-Project Coordinate System.
Figure 5: 3D Final textured model.
As to the scanner configurations for each scan we had to set up several inputs such as point's range gate, pixel spacing, minimum or maximum reflectance and inclination in order to make a multilevel analysis of the object.
Moreover we had to set up all the camera's settings manually, adjusting aperture and shutter speed for light conditions on site in order to take good quality pictures of the whole Tower for each station.
If this is not possible we could also take pictures with a definite instrument's inclination angle, but in this case we took all the photos with the same inclination angle.
At this point, we started the scan's registration on site. At the end of the first scan registration we hid all the reflection points other than our targets so we created the final scan position (Figure 3). Every scan position was already saved automatically in the Laser's memory.
For the post-processing of data we use RISCANPRO v. 1.6.1, a photogrammetric software which transforms the data acquired during the measurement campaign (such as Scans, Fine scans, digital images, GPS data, coordinates of control points and Tie Points) into a common well-defined coordinate system using transformation matrices.
The registration of each scan position taken on site is based usually on tie point lists. The tie point itself is commonly the centre of the reflective target exposed all over the Tower to the scanner's beam during the image acquisition phase.
In order to register a single scan position into the project coordinate system we choosed one of all the scans and then we registered all the other scan positions onto our reference scan.
The software matches all the corresponding tie points with its algorithm that tries to find corresponding points between the current TP list and the selected coordinate systems of the chosen reference scan. There should be a minimum of 3-5 tie points in common.
If correspondences between points of different scan positions are found, a new tie point in the TPL PRCS (Project Coordinate System) is created.
If the tie point coordinates are available in global coordinates, they should be entered into the global tie point list, TPL GLCS (Global Own Coordinate System) and should be transferred into the TPL PRCS by defining an appropriate transformation matrix (Figure 4).
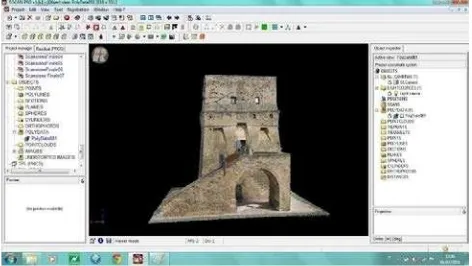
At the end of the registration into a referenced Global System we have a metrical 2D or 3D model of the entire Tower. RISCANPRO is enable to join the scan information with the high-resolution photos taken. It applies the images as a texture to a meshed surface obtaining a textured model (Figure 5).
In the 2D model's visualisation the angular data (polar and azimuth scan angles) is neglected and the measurements are put in a plane rasterization of the image according to the indices within a 3D data set.
2.2 Camera-Equipped UAV Architectural Survey
In our approach the process was entirely data-driven, and structure emerges from the data rather than being dictated by a set of potentially incorrect priors (Farenzana et al. 2008).
For the image acquisition using an aerial station we used the low-cost mini UAV Microgeo’s AeroMax600. It is a quad-copter equipped with a GPS and an INS-Inertial Navigation System that helps the pilot to control the position and can directly react on wind effects by correcting the position and the flight itself, a barometer that allows the UAV to perform altitude stabilization and position control.
We equipped the UAV with a Canon S100 camera (12 megapixel; 24 mm lens) for aerial images, fixing the focus to infinity (manual mode).
The UAV is capable to fly along a flight path pre-defined by waypoints but in this case, the UAV was controlled by a pilot with a remote controller due to a strong sea wind, thanks to a very good visibility.
For the post-processing data fusion we used Agisoft PhotoScan, a software designed for image-based reconstruction and measurement.
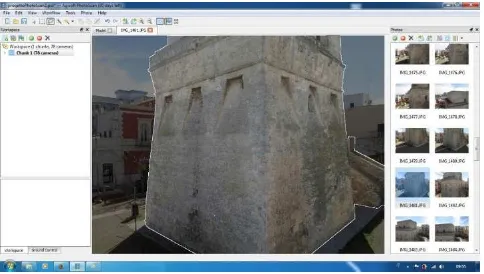
It is an advanced image-based 3D modelling used to create professional quality 3D textured-model from images alignment taken on the UAV's flight providing that the object to be reconstructed is visible on at least two photos (Figure 6).
Agisoft PhotoScan is capable of automatic camera calibration using GCP (Ground Control Points) and the Simultaneous Localization and Mapping (SLAM), largely known as the
problem of Structure From Motion (SFM), in which the camera translation and rotation can be calculated by given consecutive views of a scene referring to a project coordinate system.
Figure 6: Pictures taken on the flight.
At first we had to load the photos for the 3D reconstruction. PhotoScan is able to find the camera position and orientation of each photo and build a sparse point cloud model based on the estimated camera positions and pictures themselves that is of almost the same density as LIDAR point clouds.
At this point we built mesh and obtain a Tower's textured model. PhotoScan supports a coordinate system based on either ground control point called Markers taken by ground control stations such as GPS systems that create a .txt list of the Marker's coordinate.
Setting the coordinate system provides a correct scaling of the model allowing for surface area, volume and high measurements and creates a geo-referenced 3D model as a result (Figure 7).
3. RESULTS
3.1 Comparison between survey methodologies
The survey carried out on “Torre Pelosa” offered the opportunity to compare the ‘range based modelling’ survey technique with Riegl VZ400 laser scanner to the ‘image based modelling’ with Canon S100 12 Megapixel camera (in horizontal attitude) mounted on Microgeo AeroMax600 multi-rotor, availing of a Leica total station for topographic point measurement.
For the survey with laser scanning 8 stations were positioned at a distance of 7 to 10 metres from the object; scans were executed with a 0.040 deg pitch, resulting in a point cloud with a resolution ranging from some millimetres in the lower part to a maximum of about 2 cm on the top.
The drone flight was performed in visual mode moving with regular steps along the building façades, as for a shooting from the ground in manual mode.
The drone was maintained at a distance of 5-6 m for the vertical flight with the camera parallel to façades. In order to cover two façades, 78 frames were recorded.
Contextually, a series of points, corresponding to the targets positioned for laser scanning, were recorded through the total station and subsequently imported in the processing phase. The points that were topographically recorded were used for the model orientation and for the evaluation of the 3D-reconstruction accuracy.
The precision of the methodology was checked by calculating the mean square deviation, i.e. the deviation between the points assigned as markers and the points calculated by the software, indicating that the points were measured with an accuracy of few millimetres.
The shooting of the two façades required more flights, due to environmental conditions – wind in particular - and to the low drone battery life affected both the time committed in survey operations and the quality of acquisitions, that sometimes needed to be replicated.
All flights were performed in manual modality, focusing on the roofing, on the higher parts and on the staircase of the tower where laser scanning had delivered incomplete results.
The roofing also required more flights, due not only to the wind conditions but especially to the pairing of stronglights in some zones and shaded areas, since the bright sunshine made the day not actually suitable (Figure 8).
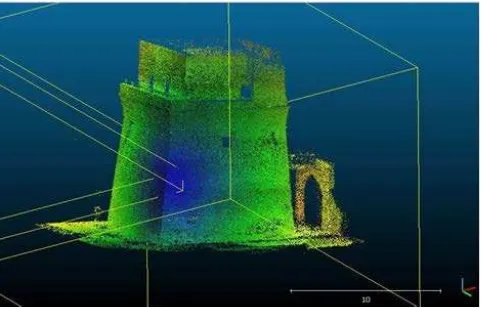
Despite such environmental conditions, the shooting allowed to reach a much wider coverage of the building compared to the one obtained with laser scanning, resulting in a more complete model (Figure 9).
Light and wind conditions have no significant influence (exclusively in the case of untextured point cloud survey) on the laser scanner equipment, that can be used reliably also in the absence of light.
Both techniques required only few hours of field survey, with a careful organization of work and an adequate number of
operators for the simultaneous management of instruments.
The processing of survey data obviously involved more time, both in the case of laser scanning and in the elaboration of images acquired from the drone.
Both software applications, Riscan Pro v.1.6.1 for laser scanning and Agisoft PhotoScan v.1.0.4 for UAV image processing, although with different procedures, delivered satisfyingresults.
Whilea laser scanner with integrated GPS allows for automatic geo-referencing of scans, the multirotor-based survey procedure can only rely on a camera, which entails recording coordinates with the help of a GPS receiver and of the total station and importing them in Agisoft to orient the model in a given reference system.
Figure 8: Shot from drone – effect of bright daylight
Figure 9: Point cloud model from drone shooting
translating the second model on the first one. In this way, all measured points were gathered up and included in a single model.
With Riscan Pro, the joining of scans is automatic and much simpler. At the end of processing with the two applications, it is possible to compare or join point clouds with Riscan Pro or with other dedicated software; starting from the comparison between Image-based and Range-based modelling techniques, our study tried to investigate their combination. This integration is essential to perform the restitution of models with a high level of morphological and chromatic detail.
3.2 Comparison with CloudCompare software
The two point-cloud models obtained with Riscan Pro and Agisoft PhotoScan were analyzed with the help of the OS CloudCompare.
It performs the elaboration of point clouds and meshes; it has been developed advanced algorithms supporting resampling, recording, colour handling, normal calculation, and other functions. In our work, a comparison of the point clouds obtained with the two survey techniques was carried out.
After uploading the ASCII files of the two models with the drag-and-drop function (Figure 10), alignment and overlapping were obtained through the registration of clouds (Figure 11).
Then it is possible to display 3D views of the clouds. CloudCompare associates for each cloud a real scalar value with each point. We can visualize a Scalar Field by means of a colour gradient, applied to the points in the cloud.
Figure 10: CloudCompare, point-cloud models
Figure 11: CloudCompare, registration and alignment of points
Each point of the cloud will be coloured as a function of its value, according to the chosen colour scale.
Several toolbars in CloudCompare can be used to register the cloud, align and show the cloud/cloud distances, also obtaining a colour scalar field as a result of the difference analysis.
This function calculates the magnitude of the gradient of the active scalar field applying a Gaussian filter to the active scalar field to define the size of the sigma kernel of the Gaussian filter.
The colours in the RGB scale of the 3D model show the deviation between the points of the Agisoft Photo Scan cloud, then from drone survey, and those of the RISCAN Pro cloud, resulting from the laser scanner survey.
Figure 12 shows that maximum deviation occurs on the right part of the tower (yellow-red: maximum deviation = 6 cm); the middle part of the building appears as a homogeneous point cloud, with deviation values less than 1 cm.
The maximum deviation arises from the few images in that area: a staircase on arches were the wind was strong, making hard the fly.
The overlapping of the two models shows that both survey procedures delivered precise and similar results (Tucci et al., 2014) and, by performing also a compensation of missing or insufficient data, it also demonstrates how the integration of techniques was, in this case, the most appropriate solution.
4. CONCLUSIONS
In this work we have shown two data acquisition techniques for the documentation of an architectural site. Both, the terrestrial laser scanner and the camera mounted on an UAV, fulfilled our goals. Both models of the tower where compared using CloudCompare (designed to perform comparison between two 3D point clouds or between a point cloud and a triangular mesh); it returns cloud/mesh signed distances computation in RGB scale as a result of the comparison.
Using CloudCompare, we noticed a point deviation in the 3D models less than a centimetre in the corner of the tower.
The comparison between the two survey systems highlighted strengths and weaknesses; for example, the laser scanner through the integrated GPS gives an automatic geo-referencing from the scan, while the UAV survey needs an additional GPS equipment. On the other hand, the manageability and manoeuvrability of the UAV are better in respect to the laser scanner (which is more expensive respect to the UAV).
The resolution of the laser scanner is higher but blunders occurred for roofing and points in recesses; furthermore, although more viewing directions (e.g. oblique or nadir) are possible from an airborne system, it has a lot of operational and security constraints. Ultimately, only the combination of terrestrial and aerial images gave us a complete, high quality digital representation of the building.
Another approach would be to model the building without laser scanner, combining photos from the same camera mounted on a tripod and on a UAV (Püschel et al., 2008), using post-processing tools able to generate - easily - results comparable to semiautomated equivalents like laser scanning (Spring and Peters, 2014). Memento, an Autodesk tool in Alpha stage, could be the right tool: it generates 3D meshes from reality capture input, producing optimized models for Web publishing, virtual and augmented reality, further digital use or 3D printing (Autodesk, 2014).
As a future perspective, the use of images from many uncooperative cameras could be investigated (Cho and Snavely, 2013): despite the formidably difficult problem of social media mining, the availability of many images (at least for main architectural sites) will give the possibility to select those without shades, removing survey costs.
5. ACKNOWLEDGEMENT
We thank the “Soprintendenza per i Beni Architettonici e Paesaggistici per la Provincia di Bari” for the survey permission. Furthermore, we thank MicroGeo for the UAV availability.
REFERENCES
Autodesk, 2014. Project Memento: All About That Space, All About that Space, No Problem
http://labs.blogs.com/its_alive_in_the_lab/2014/12/project- memento-all-about-that-space-all-about-that-space-no-problem.html
Cho P., Snavely N., 2013. 3D Exploitation of 2D Imagery,
Lincoln Laboratory Journal, Vol. 20, n.1, pp.105-137
https://www.ll.mit.edu/publications/journal/pdf/vol20_no1/20_ 1_8_Cho.pdf
Eschmann C., Boller C., Kuo C.-M., Kuo C.-H., 2012. Unmanned Aircraft Systems for Remote Building Inspection and Monitoring, proceedings of the 6th European Workshop on
Structural Health Monitoring. Th.2.B.1
http://www.ndt.net/article/ewshm2012/papers/th2b1.pdf
Püschel H., Sauerbier M., Eisenbeiss H., 2008. A 3d Model of Castle Landenberg (CH) from Combined Photogrammetric Processing of Terrestrial and Uav-Based Images in The International Archives of the Photogrammetry, Remote Sensing
and Spatial Information Sciences. Vol. XXXVII Part B6b.
Beijing, pp. 93-98
www.isprs.org/proceedings/XXXVII/congress/6b_pdf/16.pdf
Spring A.P., Peters C., 2014. Developing a low cost 3D imaging solution for inscribed stone surface analysis, Journal of
Archaeological Science 52 (2014), pp. 97-107
http://sigcis.org/pipermail/members/attachments/20141111/caac
6933/attachment-0071.pdf
Tucci G., Bonora V., Korumaz A. G., Salvadori M., Orlandini S., 2014. Fotogrammetria digitale e sistemi UAV: applicazioni al monitoraggio ambientale, Atti 18a Conferenza Nazionale
ASITA, 14–16 ottobre 2014, Firenze, pp. 1183-1188
http://www.microgeo.it/Droni/pdf/Aeromax%20600%20-2014-UAV-ASITA-Uni%20FI.pdf
Farenzena M., Fusiello A., Gherardi R. 2008. Efficient Visualization of Architectural Models from a Structure and
Motion Pipeline, in EUROGRAPHICS 2008,
www.diegm.uniud.it/fusiello/papers/short2014.pdf
Kaiser A., Neugirg F., Rock G., Müller C., Haas F., Ries J., Schmidt J., 2014. Small-Scale Surface Reconstruction and Volume Calculation of Soil Erosion in Complex Moroccan Gully Morphology Using Structure from Motion, Remote
Sensing 2014, 6(8), pp. 7050-7080