AUTOMATIC ANALYSIS AND CLASSIFICATION OF THE ROOF SURFACES FOR
THE INSTALLATION OF SOLAR PANELS USING A MULTI-DATA SOURCE AND
MULTI-SENSOR AERIAL PLATFORM
L. Lópeza*, S. Lagüelaa, b, Inmaculada Picona, D. González-Aguileraaa Department of Cartographic and Land Engineering, University of Salamanca, Hornos Caleros, 50. 05003 Ávila. Spain
b Applied Geotechnologies Research Group, University of Vigo. Rúa Maxwell s/n, Campus Lagoas-Marcosende, 36310 Vigo, Spain.
Commission V, WG V/4
KEY WORDS:3D reconstruction, aerial trike, photogrammetry, infrared thermography, point cloud, buildings, solar influence, solar panel.
ABSTRACT:
A low-cost multi-sensor aerial platform, aerial trike, equipped with visible and thermographic sensors is used for the acquisition of all the data needed for the automatic analysis and classification of roof surfaces regarding their suitability to harbour solar panels. The geometry of a georeferenced 3D point cloud generated from visible images using photogrammetric and computer vision algorithms, and the temperatures measured on thermographic images are decisive to evaluate the surfaces, slopes, orientations and the existence of obstacles. This way, large areas may be efficiently analysed obtaining as final result the optimal locations for the placement of solar panels as well as the required geometry of the supports for the installation of the panels in those roofs where geometry is not optimal.
1. INTRODUCTION
Several techniques have been applied so far for the calculation of the solar incidence on roofs (Agugiaro et al., 2012; Agugiaro et al., 2011; Hofierka and Suri, 2002; Nguyen and Pearce, 2010) trying to find the most suitable for the installation of solar panels with optimum performance. These techniques generally use simplified models and approximations of the positions and orientations of the roofs, which could imply errors in the calculation of the solar incidence on the surfaces of the roofs causing large variations in their productivity. In order to avoid this, the use of geo-referenced 3D models of roofs will allow the performance of accurate analysis of areas, orientations and slopes of the roofs. Furthermore, if these data is complemented with thermal information, which provides direct knowledge about the temperatures of the roofs and consequently about the influence of the solar radiation on them, the removal of false positive surfaces that could have the ideal geometric conditions to install solar panels will be possible. For instance, those surfaces containing elements that could prevent their installation like skylights or chimneys will be possible.
This work proposes and tests a methodology for capturing data with different devices, useful for the performance of the automatic classification of the roofs with respect to their suitability to harbour solar panels. The methodology consists on the processing of visible and thermographic images acquired from a low-cost aerial trike equipped with a multi-sensor platform (MUSAS-MUltiSpectral Airborne Sensors) towards the generation of 3D point clouds of roofs, followed by their classification into different categories according to their suitability for the installation of solar panels.
The paper has been structured as follows: after this introduction, section 2 includes a detailed explanation of the materials and methods used for the data acquisition and processing for the
*
Corresponding author. E-mail address: [email protected] (L. López).
automatic segmentation and classification of the roof surfaces for the installation of solar panels. Section 3 is devoted to be an explanation of the methodology presented through its application to an urban area selected as case study; finally, section 4 establishes the most relevant conclusions of the proposed approach.
2. MATERIALS AND METHODS
2.1 Equipment
2.1.1 Aerial trike
Parameter Value
Tandem paraglide MACPARA Pasha 4 Emergency system Ballistic parachutes GRS 350 Gimbal Stabilized with 2 degrees of
freedom (MUSAS)
Table 1.Technical specifications of the manned aerial platform, aerial trike.
Sensors are supported by a specific gyrostabilized platform (MUSAS) (Figure 1) allowing a full coverage of the study area with an appropriate ground sample distance (GSD). This device includes two servomotors arranged on the x and y axes to maintain the vertical position of the camera along the flight path with precision. The servomotors are controlled by an Arduino board, which incorporates an IMU with 6 degrees of freedom: 3 accelerometers with a range of ± 3.6 G m s-2, a double-shaft gyroscope (for pitch and roll control) and an additional gyroscope for yaw control (both gyroscopes have a measurement range of ±300º/s). The software developed for the control of the device was based on Quad1_mini V 20 software, with DCM (Direction Cosine Matrix) as the management algorithm for the IMU (Premerlani, 2013 ) This aerial platform is used to obtain good quality georeferenced images from a zenithal point of view, allowing better spatial perception given the absence of obstacles between the camera and the object. The navigation devices allow the geolocation of each datum for the posterior generation of geo-referenced point clouds with real and thermographic texture and the corresponding orthophotos and orthotermograms.
Figure 1: Aerial trike and MUSAS platform used in this study; top-right and bottom-left corner: detail of the gyrostabilized
platform for the installation of sensors.
2.1.2 RGB camera
RGB cameras are used for the acquisition of images towards the reconstruction of 3D point clouds as well as to provide visual information of the state of the roofs. The visible camera selected for this work is a full frame reflex camera Canon 5D mkII. This camera has a CMOS sensor which size is 36x24 mm with a resolution of 21.1 megapixel and is equipped with a 50mm focal length lens. The size of the image captured with this sensor is 5616x3744 pixel with a pixel size of 6.4 µm.
The camera is calibrated prior acquisition in order to allow the correction of the distortion and perspective effects from the data collected and the 3D reconstruction in the photogrammetric process. The calibration of cameras working in the visible band of the electromagnetic spectrum (Table 2) is performed through the acquisition of multiple convergent images of a geometric pattern (known as calibration grid), with different orientations of the camera. The adjustment of the rays ruling the position of the camera and the image in each acquisition allows the determination of the inner orientation parameters of the camera (focal length, format size, principal point, radial lens distortion and decentering lens distortion). The calibration is processed in the commercial photogrammetric station Photomodeler Pro5©, which performs the automatic detection of the targets in each image and computes and adjusts the orientation of each image, resulting in the computation of the calibration parameters of the camera. Table 2. Interior orientation parameters of visible camera Canon
5D mkII, result of its geometric calibration.
2.1.3 Thermographic camera
The thermographic camera selected for this study is the FLIR SC655. This device has been specially developed for scientific applications. It allows the capture and recording of thermal variations in real time, allowing the measurement of heat dissipation or leakage. Its sensor is an Uncooled Focal Plane Array (UFPA). 640x480 size, capturing radiation with 7.5 to 13.0 µm wavelengths and measuring temperatures in a range from -20 ºC to 150ºC. The Instant Field of View (IFOV) of the camera is 0.69 mrad, and its Field of View (FOV) is 25º (Horizontal) and 18.8º (Vertical) with the current lens of 25 mm focal length.
for the detection of objects that are at the same temperature as being at different temperatures if they present different emissivity values. This calibration field consists on a wooden plate with black background (high emissivity) on which foil targets are placed (low emissivity).
Focal length (mm) Value 25.1
Format size (mm) Value 10.9 x 8.2
Principal point (mm)
X value 5.3
Y value 4.1
Radial lens distortion
K1 value (mm-1) 5.281 x 10⁻⁵
K2 value (mm-3) 7.798 x 10⁻⁷ Decentering lens
distortion
P1 value (mm-1) 1.023 x 10⁻⁴
P2 value (mm-1) -3.401 x 10⁻⁵ Table 3. Interior orientation parameters of thermographic
camera FLIR SC655, result of its geometric calibration.
Figure2: Calibration grid for the geometric calibration of thermographic cameras.
2.2 Methodology
2.2.1 Flight planning and data acquisition
Proper flight planning is important to ensure that the data captured allows the performance of the study, optimizing available resources, ensuring a high quality of the images and minimizing capture time. The geomatic information required for the flight planning can be obtained free of charge from the National Center of Geographic information in Spain (CNIG), from its National Aerial Orthoimage Plan (PNOA, 2009) with a GSD of 0.25 m and a Digital Terrain Model (DTM) with a 5m grid resolution. The flight planning was carried out based on the classical aerial photogrammetric principles (Tait, 1994) but adapted to the new algorithms and structure from motion (SfM) strategies (Agarwal et al., 2011), ensuring image acquisition with forward and side overlaps of 70% and 30%, respectively. Given the format difference between the thermographic and RGB sensors, time between shots is different in order to ensure these overlaps (500 ms for the RGB sensor and 160 ms for the thermographic sensor for a flight speed of 50 Km/h).
The gyrostabilized platform ensures the theoretical geometric setup of a photogrammetric aerial image capture in each shot, which stablishes the optical axis of the camera should be nadiral. The theoretical definition of scale in digital aerial photogrammetry is related to the geometric resolution of the pixel size projected over the ground (GSD). This parameter can be calculated by considering the relationship between flight altitude over the ground, the GSD, the focal length of the sensor and the pixel size (eq. 1)
f pixelsize H GSD
(1)
Where = focal length of the sensor = flight altitude over the ground
�� = Ground Sample Distance
��� ���� = pixel size of the sensor
Due to the lower resolution of thermographic images, the flight planning is performed according to the characteristics of the sensor (Figure 3), considering the planning completely valid also for the RGB sensor. The flight altitude over the ground selected was 160m allowing a GSD of 11cm and 2cm for the thermographic and RGB sensors respectively.
Figure 3: Example of flight planning: (Top) Areas captured by each image shot for the thermographic sensor. (Middle) Flight planning for the navigation of the aerial trike. (Bottom) GPS track after the aerial trike flight with the position of each image
2.2.2 3D point cloud reconstruction
The image-based modelling technique based on the combination of photogrammetry and computer vision algorithms allows the reconstruction of dense 3D point clouds. The absolute orientation (position and attitude) of each image is known because the position of the imaging sensors is registered with respect to the GNSS/IMU navigation devices of the aerial trike, and data acquisition is synchronized with the navigation. For this reason, only the dense matching process is required, taking as basis the semi-global matching technique (SGM) (Deseilligny and Clery, 2011; Gehrke et al., 2010; Hirschmuller, 2005). This procedure allows the generation of a dense and scaled 3D model (Figure 4) resulting from the determination of the 3D coordinates of each pixel using homologous points between images. This process is performed using the RGB images because their higher resolution provides a 3D point cloud with higher point density than the point cloud generated from the thermographic images.
On the other hand, the transmission of the thermographic texture to the point cloud is developed through the computation of the spatial resection (Kraus, 1993) of the thermographic images using as reference the 3D point cloud obtained from the RGB images, identifying homologous entities (key points) between each image and the point cloud. The identification of homologous entities entails great complexity since the radiometry of the thermographic images represents a temperature value not directly related to the intensity level represented in the point cloud. For this reason, the identification of the maximum number of significant features possible in each thermographic image is essential to minimize the error in the computation of the external orientation parameters. The result obtained is a 3D dense point cloud with the thermographic information mapped of the study case from a bird’s eye view (Figure 5).
Figure 4: Example of 3D point cloud (2.179.610 points) generated from images captured with the RGB camera. Area:
23040m2. Resolution: 100 points/m2.
Figure 5: Previous 3D point cloud (2.179.610 points) with the thermographic texture mapped on the roofs.
In order to generate additional metric products to support the study from the dataset captured orthoimages which integrated thermographic information were generated. The process to generate these orthothermograms consists on the projection of the texture of the images to the mesh generated from the point cloud. Then the texture of the mesh is projected in a horizontal reference plane using an orthogonal projection, obtaining an image with geometric scale and no distortion, in such way that the measurement of a distance on the image, multiplied by the scale, results in the measurement in the reality.
2.2.3 Automatic planes segmentation
fixed number of times, each time producing either a model which is rejected because the number of points classified as inliers is too limited or a refined model together with a corresponding error value. The process finishes when the mathematical model fits the dataset according to the parameters specified.
Once each roof is clustered in different planes (Figure 7), and the coefficients that describe each surface in a Cartesian coordinate system by the general equation of the plane are known (eq. 2), the geometric evaluation is performed, resulting in the orientation, slope and energy loss values for each surface.
Figure 6: Result of the extraction of each roof using the Euclidean cluster extraction algorithm.
Figure 7: Results of the extraction of each planar surface using the RANSAC algorithm applied in different roofs.
Ax By Cz D (2)
From the components A, B and C of the general equation of the plane that match with the values of the vector normal to the plane (Eq. 3) we can proceed to compute the orientation and slope values. To obtain the orientation of the surface is necessary
calculate the angle between the projection of the vector
v
on thehorizontal plane and the Y Cartesian axis (Eq. 4) evaluating the quadrant to which it belongs to obtain de orientation angle (Eq. 5 to 8) (Figure 8).
( , , ) v A B C (3)
(
A
)
arcTan
B
(4)1st Quadrant:
Or
180º
(5)
2nd Quadrant:
Or
(6)
3rd Quadrant:
Or
(7)
4th Quadrant:
Or
200
(8)
Where:
v
= vector normal to the plane.,
A B
andC
= parameters from the general equation of the plane.
= Angle between the horizontal projection of the normal vector and the Y Cartesian axis.Or
= Orientation of the plane.Figure 8: Absolute orientation of the slope from the angle
between the projection of the vector
v
on the horizontal planeand the Y Cartesian axis.
Figure 9: Inclination of the slope from the values of the normal vector of the plane.
2 2
d
A
B
(9)(
C
)
arcTan
d
(10)90º
Incl
(11)Where:
v
=
vector normal to the plane.,
A B
andC
= parameters from the general equation of the plane.d
= Module of the vector v projected on the horizontal plane (Z = 0).
=
Angle between the horizontal plane (Z = 0) and the normal vector of the surface.Incl
=
Inclination of the plane.2.2.4 Geometric analysis and classification
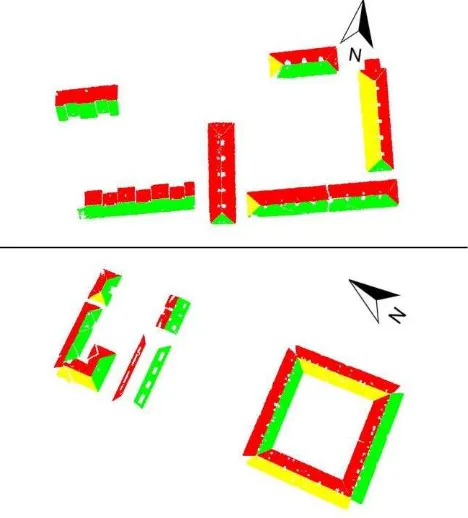
Once the different planes of the roofs are detected and segmented, its area, slope and orientation is analysed in order to perform their geometric classification. The roofs with an area smaller than the necessary for the installation of solar panels and those with North orientation are discarded. The remaining roofs are classified in different groups according to their theoretical productivity due to their inclination and orientation (Figure 10 and 11), taking into account the possibilities of integrating the solar panels in the roof and installing them in configurable supports. The CTE sets the South orientation as the optimum position for these elements, with a slope equal to the latitude where they are installed. However, the limits on the inclination can be computed according to the minimum efficiency allowed for the orientation of the surface using the method explained by the IDAE (Institute for Diversification and Saving of Energy) (Eq. 12 and 13) (IDAE, 12 Jan. 2015). These limits allow the evaluation of the suitability of the surface under study and the
computation of the ideal geometry of the support platforms if needed, taking into account that losses cannot exceed the 20% if solar panels are installed using the overlapping which implies the installation of solar panels directly over the roofs not changing the angle of solar incidence regarding to the slope of the surface where they are installed technique and the 10% using the general method which implies the installation of solar panels in supports to modify the angle of solar incidence regarding to the slope of the surface where they are installed.
Figure 10: Diagram for the estimation of solar losses by orientation and inclination (Latitude 41º) (IDAE). The radial lines set the orientation of the surface. The concentric circles
sets the slope of the surface. The texture found in the intersection of these parameters gives the losses by inclination
and orientation of the roof (Source: IDAE).
Figure 11. Details of the previous point cloud segmented and classified by its suitability to install solar panels. (Green) Surfaces suitable to install solar panels without supports. (Yellow) Surfaces suitable to install solar panels using a support
If > 5
4
2 5 2% 100 1.2 10 10 3.5 10
Losses
If < 5
% 100 1.2 104
10
2Losses
(13)
Where = slope = azimuth
� = latitude.
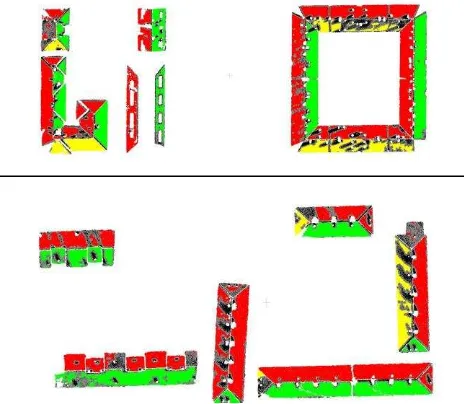
2.2.5 Thermographic refinement of surfaces
Once the geometric classification is performed, the thermographic data allows the location of elements that could be an impediment to the installation of solar panels in order to avoid shadows or obstacles that could reduce their productivity allowing the analysis to find the optimum location within each roof. The existence of obstacles and anomalies in the roofs will involve the existence of different materials with different emissivity values, so the temperature detected by the thermographic images will be different even if the solar radiation received was the same. On the other hand, the existence of obstacles that prevent direct sunlight also will be manifested by changes in the roof surfaces temperatures. This facts will allow the location of the surfaces of the roofs affected by these anomalies performing a statistical study of the mean and the standard deviation of the temperatures. A point will be considered as an obstacle when the difference between its temperature value and the mean temperature of the roof is higher than the standard deviation of the temperatures of the surface that is being analysed. Considering that a shadow produced by an obstacle will move around this following the path of the sun, a perimeter around each obstacle will be marked to facilitate further analysis (Figure 12).
Figure 12. Details of the previous point cloud segmented and classified after the thermographic analysis. (Black) Points removed by the statistical thermographic analysis. (Grey) Perimeter defined by a user parameter (distance) around the obstacles detected to help the optimum location to place the
solar panels.
3. EXPERIMENTAL RESULTS.
The proposed methodology has been validated in an wide urban area in the city of Avila (Lat 40º 38’, Lon 4º 41’), with an extension of 237.250m2 in a rectangular shape of 365m x 650m (Figure 13), chosen by the existence of roofs with different geometric characteristics allowing the test of the methodology. The study area includes 34 roofs which have been automatically segmented into 146 planar surfaces and evaluated according to their orientation, slope, surface and the radiometry of the thermography. The final results are geo-referenced point clouds of the surfaces of the roofs classified by their theoretical productivity regarding solar energy catchment with the elements that could reduce their productivity located and surrounded by an area that could be affected by its influence along the day and a plane text file for each surface with its geometric information (area, slope, orientation ...) and the optimum inclination of the supports if they were necessary (Table 4). This information allows the location of the optimum areas for the installation of solar panels in a wide urban area in a fast an accurate way, without the need to consult the technical documentation of each building.
Thanks to that during all processing the geometric information of the 3D point clouds has been preserved, perform measurements directly on the point clouds of the segmented planes will be possible allowing decision-making processes about issues related with the dimension or type of solar panels that could be installed and calculating the actual productivity of the selected components.
Figure 13. RGB Orthoimage of the study area.
Surface 1 2 3 4
Orientation 166.20º -14.12º -103.86º 75.97º
Slope 19.43º 19.26º 19.07º 19.54º
Energy losses - 2.08% - 21.5%
Suitable NO YES NO YES
Angle of supports
- - - 20.46º
Surface 5 6 7 8
Orientation 165.90º -13.89º 103.99º 75.91º
Slope 19.35º 19.43º 19.06º 13.36º
Energy losses - 2.02% - 21.53%
Suitable NO YES NO YES
Angle of supports
- - - 20.64º
4. CONCLUSIONS
This article presents a methodology for the generation of thermographic point clouds and metric images from a multi-data source and multi-sensor aerial platform, as well as the automatic plane segmentation of the roof surfaces, its classification according to its theoretical productivity derived from its geometric characteristics (orientation, slope and surface) and a final refinement according to the thermographic radiometry that allows the location of anomalies or obstacles that could prevent the installation of solar panels or reduce their productivity. In particular, the hybrid product obtained provides complete thermographic and metric information of the different roof surfaces, which enables a better detection, spatial location and interpretation of the suitability of each surface to harbour solar panels than the traditional methods that use simplified models or in-situ visual inspections of the buildings analysed.
What is more, the methodology proposed is also valid for the processing of datasets captured with different airborne sensors like LIDAR (Laser Imaging Detection and Ranging) or any other RGB and Thermographic sensors transported by any manned or unmanned aerial vehicle.
This project opens new trends for future work both from a sensorial and methodological points of view. Concerning the first, the calibration of the thermographic equipment regarding the positioning device will allow to obtain the external orientations of each thermographic image allowing the automation of the thermographic texture mapping and the removal of the tedious process of identifying homologous entities between thermographies and point clouds. From the software point of view, the integration of the sun path effects to perform a better location of the shadow areas that could reduce the productivity of the solar panels will be the next milestone which will improve considerably the reliability of the decision-making processes from the processing results from this methodology.
REFERENCES
Agarwal, S., Furukawa, Y., Snavely, N., Simon, I., Curless, B., Seitz, S.M., Szeliski, R., 2011. Building rome in a day. Communications of the ACM 54, 105-112.
Agugiaro, G., Nex, F., De Remondino, F., Filippi, R., Droghetti, S., Furlanello, C., 2012. Solar radiation estimation on building roofs and web-based solar cadastre. ISPRS Annals of Photogrammetry, Remote Sensing and Spatial Information Sciences 1, 177-182.
Agugiaro, G., Remondino, F., Stevanato, G., De Filippi, R., Furlanello, C., 2011. Estimation of solar radiation on building roofs in mountainous areas. IAPRS&SIS 38, 155-160.
Deseilligny, M.P., Clery, I., 2011. Apero, an open source bundle adjusment software for automatic calibration and orientation of set of images, Proceedings of the ISPRS Symposium, 3DARCH11, pp. 269-277.
Fischler, M.A., Bolles, R.C., 1981. Random sample consensus: a paradigm for model fitting with applications to image analysis and automated cartography. Communications of the ACM 24, 381-395.
Gallo, O., Manduchi, R., Rafii, A., 2011. CC-RANSAC: Fitting planes in the presence of multiple surfaces in range data. Pattern Recognition Letters 32, 403-410.
Gehrke, S., Morin, K., Downey, M., Boehrer, N., Fuchs, T., 2010. Semi-global matching: An alternative to LIDAR for DSM generation. International Archives of the Photogrammetry, Remote Sensing and Spatial Information Sciences, Calgary, AB, 38 (B1).
Hirschmuller, H., 2005. Accurate and efficient stereo processing by semi-global matching and mutual information, Computer Vision and Pattern Recognition, 2005. CVPR 2005. IEEE Computer Society Conference on. IEEE, pp. 807-814.
Hofierka, J., Suri, M., 2002. The solar radiation model for Open source GIS: implementation and applications, Proceedings of the Open source GIS-GRASS users conference, pp. 1-19.
Hulik, R., Spanel, M., Smrz, P., Materna, Z., 2014. Continuous plane detection in point-cloud data based on 3D Hough Transform. Journal of Visual Communication and Image Representation 25, 86-97.
IDAE, .
<http://www.idae.es/uploads/documentos/documentos_5654_F V_pliego_condiciones_tecnicas_instalaciones_conectadas_a_re d_C20_Julio_2011_3498eaaf.pdf>. (12 Jan. 2015)
Kraus, K., 1993. Advanced Methods and Applications. Vol. 2. Fundamentals and Estándar Processes. Vol. 1. Institute for Photogrammetry Vienna University of Technology. Ferd. Dummler Verlag. Bonn.
Lagüela, S., González-Jorge, H., Armesto, J., Herráez, J., 2012. High performance grid for the metric calibration of thermographic cameras. Measurement Science and Technology 23, 015402.
Nguyen, H.T., Pearce, J.M., 2010. Estimating potential photovoltaic yield with r.sun and the open source Geographical Resources Analysis Support System. Solar Energy 84, 831-843.
Premerlani, W., Bizard, P, 2013 Direction Cosine Matrix IMU: Theory.
<http://gentlenav.googlecode.com/files/DCMDraft2.pdf> Rusu, R.B., Cousins, S., 2011. 3d is here: Point cloud library (pcl), Robotics and Automation (ICRA), 2011 IEEE International Conference on. IEEE, pp. 1-4.