www.elsevier.comrlocaterapplanim
Individual behavioural characteristics in pigs and
their impact on production
E. van Erp-van der Kooij
a,), A.H. Kuijpers
a, J.W. Schrama
b,
E.D. Ekkel
c, M.J.M. Tielen
aa
Department of Farm Animal Health, Faculty of Veterinary Medicine, Utrecht UniÕersity, Yalelaan 7, Utrecht
3584 CL, Netherlands
b
Department of Animal Husbandry, Wageningen Agricultural UniÕersity, Marijkeweg 40, Wageningen,
Netherlands
c
DLO Institute for Animal Science and Health, Edelhertweg 15, Lelystad, Netherlands
Accepted 9 September 1999
Abstract
Two studies have been carried out in pigs to determine the relation between escape behaviour and production parameters and between escape behaviour and other factors. In the first, 823 piglets were tested with the backtest at 10 and 17 days of age. Production parameters, such as average daily weight gain and lean meat percentage, were recorded. In the second, the backtest was performed on 566 piglets at 3, 10 and 17 days of age. Escape behaviour in the backtest
Žbacktest score of the mother was known for 364 piglets. Parameters concerning the health of sow.
and piglets were recorded, as well as the sow’s reaction on piglet removal for testing. Relations between production parameters and backtest scores of the animals were calculated, as well as the
Ž .
influence of birth weight, gender all males were castrated , parents and health parameters on backtest scores. Backtest scores were fairly consistent over successive tests. Males had higher backtest scores than females, and piglets from sows with low backtest scores had low scores themselves. Finally, a higher backtest score gave a higher lean meat percentage and a better carcass grading at slaughter. No relation with daily weight gain was found. It is concluded that there are individual differences between the ways in which pigs cope with a stressful situation, as is measured with the backtest, and that this coping behaviour is consistent. A positive relation exists between backtest scores and lean meat percentage, and a heritability of backtest scores is assumed.q2000 Elsevier Science B.V. All rights reserved.
Keywords: Pigs; Stress, coping; Backtest; Gender; Lean meat percentage
)Corresponding author. Tel.:q31-30-253-1248; fax:q31-30-252-1887; e-mail: [email protected] 0168-1591r00r$ - see front matterq2000 Elsevier Science B.V. All rights reserved.
Ž .
1. Introduction
The way vertebrates react in a stressful situation varies and largely determines their adaptive capacity. Animals will react to a stressor with a series of behavioural, physiological and neuroendocrinological activities regulated by the brain. However, not
Ž
every animal of the same species will react to a stressor in the same way Benus et al., .
1987 .
In mice and rats, evidence has been found for two different ways of dealing with a stressor. The theory is, that each individual has its own coping style, which can be either active or passive. To determine this coping style, animals are tested for behavioural traits like aggression or nest-building behaviour, or reactions in an open field test or during tonic immobility are determined. The distribution of these traits and the results in
Ž
several tests are bimodal and consistent over time McGraw and Klemm, 1973; Benus et .
al., 1991; Sluyter et al., 1995 . Most of these studies are done with SAL and LAL mice, two genetically selected lines of wild house mice. Comparable results are found in
Ž .
poultry Beuving et al., 1989; Jones and Satterlee, 1995 .
In humans, several different coping approaches are recognized. In the first theory, Ž two coping styles were recognized, resulting in type A and type B humans Glass,
.
1977 . Later, some authors defined up to 12 different coping strategies, others only three
Ž .
or four Pines and Kafry, 1982; Simoni and Paterson, 1997 .
In primates, individual differences in behaviour have been found but two or more distinct coping styles have not been established. In experiments with rhesus monkeys, results of behavioural tests are fairly consistent when the same test is done twice at the
Ž
same age, but they are not consistent over time and for different situations Stevenson-.
Hinde et al., 1980 .
Ž .
In pigs, different theories about coping styles exist. Hessing et al. 1993; 1994a suggest that there are two different coping styles in pigs that can be determined in piglets by performing a backtest. In this test, the piglet is put on its back and held by the experimenter, and the number of escape attempts is counted during 1 min. Based on two
Ž .
tests, piglets can be divided into the category of High Resisters HR , with more than Ž .
two escape attempts in each test and Low Resisters LR , with less than two escape attempts in each test. The animals that did not fit in one of those groups, namely those with exactly two escape attempts in both tests or with varying test results, were called
Ž .
Doubtful D . HR and LR pigs displayed consistent differences in behavioural, physio-logical and endocrine responses to stress situations. These responses were associated with different stress pathologies. Moreover, differences in cell-mediated and humoral
Ž
immunity were found between HR and LR pigs Hessing et al., 1994b; Schrama et al.,
. Ž .
1997 . Hessing et al. 1994c also found a relation with production: animals in mixed
Ž .
pens with HR and LR pigs performed better than pigs in pens with only HR or only LR pigs.
Ž .
Lawrence et al. 1991 have found that female pigs responded consistently to a series of non-social tests, but in social tests, not all responses were consistent. Erhard and
Ž . Ž .
Ž .
They found no relations between the backtest modified after Hessing and other behavioural tests and the intra-test consistency was low. Using factor analysis, they did find correlations between several behavioural traits, excluding the backtest. Three personality factors are suggested by these experiments: aggression, sociability and
Ž .
exploration Forkman et al., 1995; Jensen, 1995; Jensen et al., 1995a,b .
The objectives of our studies are threefold. Firstly, we investigated if individual characteristics of pigs, measured with the backtest, are consistent. Secondly, we determined if these individual characteristics were related to sow, boar or gender. Thirdly, we studied the relationship between these individual characteristics and the performance of the pigs. If backtest results in pigs are related to performance, this would mean that a selection of the best performers can be made at an early age. Also, if backtest results are heritable and related to performance, a selection in sows can be made according to their own backtest results.
2. Materials and methods
2.1. Housing and animals
The studies were performed in farrowing and fattening units at the farm ‘The Tolakker’ of the University of Utrecht, the Netherlands. In two studies, 823 and 566 fattening pigs, born from Dutch Landrace)Great Yorkshire sows, were used. The piglets
were born in conventional farrowing pens. A heating lamp and floor heating were used if necessary. An all-in-all-out system was used consequently.
Male pigs were castrated at approximately 5 days of age and tails of all pigs were docked, according to standard Dutch procedures. Iron was given to the piglets by injection at 3 days of age. At weaning, around 28 days of age, the sow was removed from the pen and the piglets remained in the same pen until 9 weeks of age. At that time, the fattening period started. All fattening pens had a partly slatted, concrete floor with floor heating. Feed and water were supplied ad libitum. Pigs were slaughtered at
Ž .
approximately 110 kg liveweight around 6 months of age .
2.2. Backtest
Ž .
A backtest was performed as described by Hessing et al. 1993 . In this backtest, each piglet was put on its back and restrained in this supine position for 1 min. One hand was placed loosely over the head of the pig, the other was placed loosely on the hind legs. Each series of wriggles that the piglet made without a pause was counted as one escape attempt. The total number of escape attempts is called ‘backtest score’. In the first of our studies, all piglets were tested twice during the suckling period, at 10 and 17 days of age. In the second study, piglets were tested at 3, 10 and 17 days of age.
2.3. Data
approximately 9 weeks and at slaughter, lean meat percentage at slaughter and carcass grading. Lean meat was calculated using muscle- and backfat thickness, measured on
Ž . Ž .
carcasses with the Henessy Grading Probe HGP Engel and Walstra, 1993 . Live wŽ
weight just before slaughter was calculated as slaughtered weight 83yslaughtered
. x
weight 0.0025q1.3. Gender, sow and boar identity were recorded. Carcass grading Žmeatiness in the slaughterhouse was recorded using the SEUROP system. With this. system, carcasses are graded according to the muscularity of the slaughtered pig: SsSuperior, EsExcellent, UsVery good, RsGood, OsModerate and PsPoor.
In the second study, data from 566 piglets were collected until weaning. Weight at birth and at weaning were recorded, as well as gender and health of the piglet. Sow identity, sow reaction to piglet removal and medical treatments of the sow were recorded. Sows were backtested before the start of the study, at the age of 10 and 17 days. Sows were divided into three backtest score groups, based on the outcome of two
Ž .
backtests, according to Hessing et al. 1994b :
Ø An animal was classified as LR when the total number of escape attempts was less
Ž .
than four, with a maximum of two attempts per test e.g., 0q0 or 1q2 ;
Ø An animal was classified as HR when the total number of escape attempts was more
Ž .
than four, with a minimum of two attempts per test e.g., 2q3 or 4q4 ;
Ž . Ž .
Ø The other animals were classified Intermediate I e.g., 0q3 or 2q2 .
The reaction of the sow to piglet removal was scored as ‘quiet’ or ‘aggressive’. A
Ž .
sow was ‘aggressive’ when she reacted hostile e.g., making noise, jumping up when one of her piglets was taken out of the pen for testing. A sow that did not react was classified as ‘quiet’.
2.4. Statistical methods
2.4.1. Consistency of backtest scores
The Pearson correlation coefficient is used to determine the consistency of backtest scores in the successive tests.
2.4.2. Backtest scores and related factors
Relations between factors such as birth weight, gender, boar and sow, and backtest scores were calculated for both studies. The effect of test day was also calculated.
2.4.2.1. First study. Preliminary analysis showed no effect of the different pens, so this variable is not used in the models.
Ž .
To determine the effect of test day 10 or 17 days of age on backtest score per test Ž .y , the following model was used:
yi jsmqpiglet numberiqtestdayjq´i j.
To determine the effect of AI or natural service and the effect of boar number on Ž .
backtest scores, the mean backtest score per litter was calculated y . This means that
Ž .
first the mean score per animal was calculated from the results of the two tests and these figures were used to calculate the mean score per litter. The following models were used:
yismqAIiq´i,
yismqboar numberiq´i.
Ž .
To determine the effect of gender, mean backtest score per animal from two tests Ž .y was calculated and the following model was used:
yi jsmqlitteriqgenderjq´i j.
Ž
2.4.2.2. Second study. To determine the effect of litter, gender and test day 3, 10 or 17
. Ž .
days of age on backtest score per test y , the following model was used:
yi jk lsmqlitteriqgenderjq´1 :i jkqtest daylq´2 :i jk l,
Ž .
in which ‘litter’ is the combined effect of sow and boar each sow is used only once ,´1
is the errorterm of litter and gender nested within piglet number and´2 is the errorterm
of the total model.
The relation between sow reaction, sow health and sow backtest scores was calcu-lated using logistic regression. Since sow reaction and sow health were recalcu-lated, we used only sow reaction and sow backtest scores in the final models.
To determine the effect of sow reaction and sow backtest score on backtest score of the piglets, mean backtest score per litter was calculated. This means that first, the mean
Ž .
backtest score per animal was calculated from the results of the three tests , and these figures were used to calculate the mean score per litter. The following model was used:
yi jsmqsow reactioniqsow backtest scorejq´i j.
2.4.3. Relations between backtest scores and production parameters Ž
For the first study, relations between production parameters lean meat percentage, .
carcass grading and daily weight gain and backtest scores were calculated. Since no
Ž .
day-effect was found, the mean number of escape attempts mean of two tests per Ž . animal is used. To determine the effect of mean backtest score on daily weight gain y , the following model was used:
yi jk lsmqlitteriqweightjqgenderkqbacktest scorelq´i jk l,
in which y is daily weight gain in the suckling, growing or fattening period and ‘weight’ is birth weight, weight at weaning or weight at the start of the fattening period. To determine the effect of mean backtest score on meat percentage and carcass
Ž .
grading y , the following model was used:
in which y is lean meat percentage or carcass grading and ‘weight’ is birth weight, weight at weaning or weight at the start of the fattening period.
2.4.4. General
Ž .
For all models, the Shapiro–Wilk statistics W was calculated as a statistical test for normality and the skewness and kurtosis of the rest value of the models were
deter-Ž mined. All calculations were performed using the statistical package, SAS SAS
. Institute, 1989 .
P-values-0.05 were considered to be significant.
3. Results
3.1. General
The rest values of all models had a normal distribution, so no transformation of
y-values was necessary. Skewness and kurtosis were between y2 and 2 and the
Shapiro–Wilk statistics was not significant.
3.2. Backtest
In the first study, a backtest was performed on day 10 for 832 piglets and on day 17
Ž .
for 825 piglets. The average number of escape attempts on day 10 was 1.89 range 0–7 ,
Ž .
on day 17, it was 2.01 range 0–8 . In the second study, the backtest was done three
Ž .
times with 566 piglets. The average number of escape attempts was 3.20 range 0–12
Ž . Ž .
on day 3, 2.57 range 0–8 on day 10 and 2.60 range 0–10 on day 17. The number of
Ž .
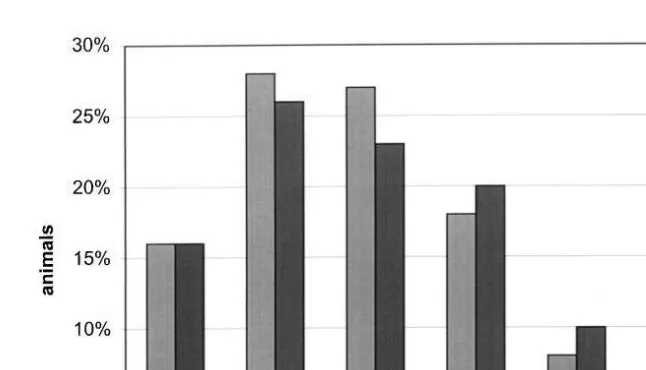
escape attempts for each test had a unimodal distribution Fig. 1a, b . Ž
In the first study, the correlation between the successive backtest results day 10–day
. Ž . Ž
17 was 0.42. In the second study, the correlations were 0.41 day 3–day 10 , 0.39 day
. Ž .
3–day 17 and 0.47 day 10–day 17 . All P-values were 0.0001.
A day-effect was found in the second study for backtest scores between the test on
Ž .
day 3 and the test on day 10 or 17 P-0.0005 . This was caused by the high test scores in the first test, compared to the other two tests. The mean level of escape attempts was higher on day 3 than on day 10 or 17. In both studies, no day-effect was found between
Ž . Ž .
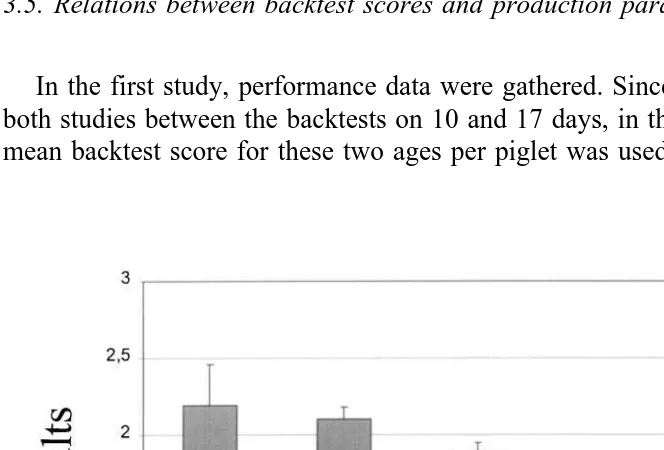
the tests on day 10 and 17 Ps0.49 Figs. 2 and 3 .
3.3. Parameters related to the backtest scores
In both studies, female piglets showed a higher number of escape attempts than
Ž . Ž .
castrated males Figs. 2 and 3 . No interactions between variables such as day)gender
were found.
Ž .
In the first study, relations were found between backtest scores and litter P-0.001 ,
Ž . Ž . Ž .
Ž . Ž .
Fig. 1. a Percentage of animals for each backtest score first study .
Ž . Ž .
Fig. 1. b Percentage of animals for each backtest score second study .
Ž .
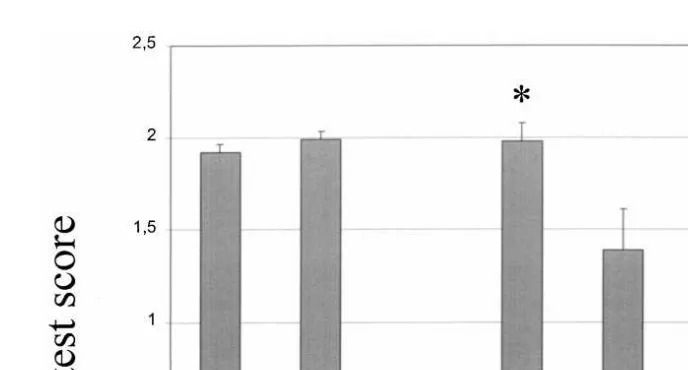
In the second study, the backtest score per piglet was related to litter P-0.01 , sow
Ž . Ž .
backtest type P-0.01 and gender P-0.01 . Sows with lower backtest scores when they were piglets had offspring with lower backtest scores. A trend was found between
Ž . Ž .
backtest score of the piglet and sow reaction P-0.10 Fig. 3 . No relation was found with illness of the piglets.
Ž .
Fig. 2. Backtest scores and related parameters first study : effect of test day, AI and gender.
Ž .
Fig. 3. Backtest scores and related parameters second study : effect of test day, gender, sow backtest type and sow reaction.
3.4. Performance
Table 1
Ž .
Production performance of pigs in the first study ns747 and estimates of backtest score on performance parameters
Mean SEM N Estimate P-value
of backtest
Ž .
Weight kg
At birth 1.474 0.312 747 y0.19 0.25
At weaning 8.6 1.76 747 y0.06 0.05
At 9 weeks 24.3 4.442 746 y0.02 0.08
At slaughter 113.1 6.565 747 0.008 0.27
Ž .
Daily weight gain kgrday
Suckling period 0.265 0.056 747 y0.002 0.14
Weaning period 0.442 0.098 746 y0.002 0.47
Fattening period 0.804 0.088 746 0.001 0.63
Lean meat percentage 54.03 3.42 740 0.33 -0.01
3.5. Relations between backtest scores and production parameters
In the first study, performance data were gathered. Since no day-effect was found in both studies between the backtests on 10 and 17 days, in the following calculations, the mean backtest score for these two ages per piglet was used.
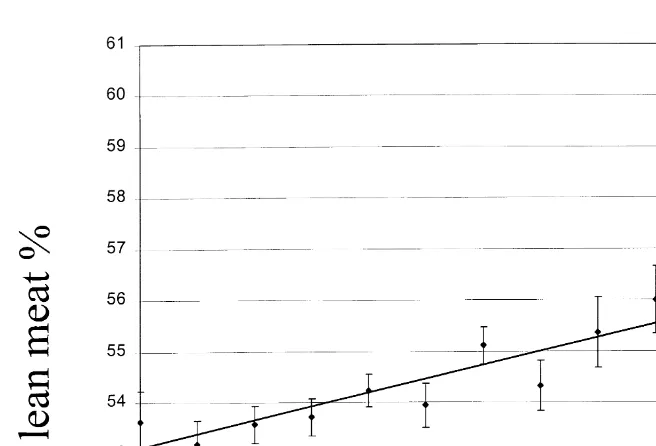
Fig. 5. Relation between backtest score and lean meat percentage.
No relations were found between daily weight gain in the suckling, weaning or
Ž .
fattening period and backtest scores, or between backtest scores and weight Table 1 . Backtest score and lean meat percentage at the slaughterhouse were related positively ŽP-0.01 just as backtest scores and carcass grading at the slaughterhouse P. Ž -0.05 ,. corrected for gender, sow identity, AI and weight. Piglets with higher backtest scores
Ž
had a higher carcass grading and a higher lean meat percentage at slaughter Figs. 4 and .
5 .
4. Discussion
4.1. Backtest
Ž .
The distribution of backtest scores and the number of escape attempts range 0–8
Ž .
were comparable to the results of Hessing et al. 1993 . In his experiments, pigs were divided into active and passive animals according to two backtests, but pigs with intermediate results were disregarded. This can give the impression that there are only two different types of pigs, active and passive, which is not the case. The distribution is unimodal, as can be seen in Fig. 1a and b. In our report, backtest scores of all animals were used and animals were not divided into categories, with an exception for the sow backtest scores since the original backtest scores for those animals were not available.
Ž .
Ž
piglets. In some lines of rodents, the distribution of coping behaviour measured with .
several behavioural tests such as open field tests is bimodal, and therefore, it is stated that there are two different coping strategies. However, in rodents, a diversifying
Ž .
selection has taken place in almost every population, either natural wild populations or
Ž .
artificial in the laboratory populations, e.g., SAL and LAL mice . By selecting for Ž .
aggression or nest-building behaviour, a bimodal distribution of test reactions devel-oped. Selection for certain reactions might also have happened in wild populations,
Ž . Ž
because different strategies active or passive may have been beneficial Benus et al., .
1991; Sluyter et al., 1995 . In contrast to the rodent experiments, no direct artificial selection for behaviour has been performed in the pig population used. Indirectly, selection for a certain coping strategy might take place in domestic pigs if this strategy would somehow be correlated to high production or low disease incidence or mortality. Therefore, a bimodal distribution was not expected but a tendency for change in overall coping strategy would be possible. For example, if an active coping strategy would be more beneficial than a passive one, coping strategies of all animals would change over the years. If the backtest measures an aspect of this coping style, then higher backtest scores would have been found in the population. If selection for backtest types in pigs were possible, a bimodal distribution of backtest types might be created by active selection.
At 3 days of age, the animals resisted more in the backtest than on days 10 and 17. The higher scores at 3 days could well be caused by the relative naıvete of the piglets.
¨
´
At this early age, the animals are not used to seeing or hearing people, let alone to being handled by them. Between 3 and 10 days, many things happen to a piglet, such as handling, tail docking, an iron injection and, for male piglets, castration. In contrast, no
Ž .
major events happen between 10 and 17 days. It is possible that the negative experiences in the first week change the piglets’ reaction in the backtest. This is in line
Ž .
with findings of Erhard et al. 1998 , who found that handling of piglets before performing a TI test influenced test results. Piglets that he tested three times showed an increasing susceptibility for TI. Furthermore, in the first days of life, piglets must fight
Ž
in order to gain milk. In these few days, the teat order is established Gonyou and .
Stookey, 1987 . This might also explain the higher scores for all animals on day 3, while the piglets are fighting for their place at the udder and not on day 10 or 17, when the teat
Ž .
order has been established. This theory is in line with findings of Hessing et al. 1993 , who found a positive relation between aggressive behaviour and backtest scores in piglets.
4.2. Relation between backtest scores and sow, AI and gender
Backtest scores of the piglets were related to the backtest type of the mother. This suggests a heritability of backtest scores. This is in line with findings in mice, where a
Ž
heritability of several behavioural traits is found Benus et al., 1991; Sluyter et al., .
When AI and natural service were compared, a difference in backtest scores of the Ž piglets was found. This could be caused by a difference in handling of the sow AI or
. Ž .
natural service , by a difference in sperm treatment sperm is older and diluted or by a difference in the two boar populations. From our point of view, the latter is the most probable cause for this difference. The natural serving boars used in the study are owned by and raised on the experimental farm, in their own breeding program, while the AI boars are owned by and raised on the AI station. It seems that the boars of the AI station produce offspring with lower backtest scores than the boars of the experimental farm. There was a weak, but non-significant, relation between sow reaction and the piglets’ test scores. Mothers who reacted fiercely when piglets were removed had piglets that resisted less in the backtests. Probably, this ‘aggression’ of the sow is actually good motherly behaviour. Sows which defend their piglets might have piglets that feel they do
Ž .
not have to deal with a stressor themselves their mother will do that for them and those piglets might therefore be less resistant. They use a passive coping strategy in the backtests. Piglets with unattentive mothers might feel ‘left alone’ and therefore try to fight the stressor, thus using an active coping strategy in the backtests. The reaction of the sow may also have influenced the backtest. The piglets are tested next to the farrowing pen so they can hear the sow but not see her. If this would influence the test, then in future studies, the tests should be performed away from the sow. These relations
Ž .
suggest an effect of the environment e.g., the sow on backtest scores.
To distinguish between genetical influences and environmental effects, cross-foster studies should be performed.
No relation was found between backtest scores of the sow and reaction of the sow on piglet removal, but ill or medically treated sows reacted less when piglets were removed for testing. This means that the sow’s motherly behaviour is mainly influenced by her health state.
In both studies, backtest scores of piglets were related to gender. Castrated males resisted less than females. The gender effect became more apparent in the successive tests. However, the expected gender)day effect was not found.
In our study, piglets were not handled before the first test at day 3, which showed no gender effect. After handling the piglets in the first week, the gender effect emerged in
Ž .
the second and third tests. This is in line with findings by Erhard et al. 1998 who reported that after handling, female piglets were more active in a TI test than males but found no gender effect in piglets that were not handled before the tests.
Between days 3 and 10, male piglets were castrated. If this castration caused the gender difference is not clear. The gender difference is also found before castration at day 3, even though not significant. It is possible that castration andror handling of piglets between days 3 and 17 make the gender differences more evident or that these differences develop during the first weeks of life. Another possibility is, that the effect of castration becomes more evident with time due to the decreasing level of hormones Ži.e., testosterone ..
4.3. Relation of backtest scores with production parameters
the backtest had a higher lean meat percentage and a better carcass quality than pigs with lower scores. Lean meat percentage and carcass quality are highly related.
Feeding was ad libitum but only one animal could eat at the same time. If the active animals could get to the feeding place more often, then a higher daily weight gain would
Ž
be expected in the HR animals, which our data did not show. Active animals i.e., with .
high backtest scores possibly used more energy in walking or fighting, and therefore became leaner.
Ž .
According to Hessing et al. 1993 , a high backtest score is related to aggression in pigs. The relation between aggression and production in pigs is described by Hartsock et
Ž .
al. 1977 , who found that more fighting success during the suckling period resulted in a higher protein percentage at slaughter. This might explain the relation between backtest type and lean meat percentage and carcass quality in the present study.
4.4. Consequences of selection
When backtest scores in pigs are related to lean meat percentage, this means that a selection of the best performers can be made at an early age by use of the backtest. If backtest scores are heritable, an even earlier selection can be performed. However, selection for high backtest scores could lead to uniform pens with high resisting animals,
Ž .
which, according to Hessing et al. 1994c , results in less average daily weight gain. However, in the practice of pig production, selection for lean meat percentage does take place directly, which might lead to higher backtest scores in the population. This hypothesis is supported by the fact that we found higher backtest scores in the second study, which took place about 2 years after the first one.
Ž .
If, as according to Hessing et al. 1993 , backtest scores and aggression are related, we are indirectly selecting for aggression in the population.
5. Conclusions
Although there was a consistency in the successive backtests, two different be-havioural strategies in pigs could not be distinguished. In these studies, backtest scores reflect a possibly heritable behavioural trait which might be influenced by the
environ-Ž . Ž .
ment e.g., the sow and by previous experiences e.g., handling . Relations exist between backtest scores and some production parameters.
Acknowledgements
References
Benus, R.F., Koolhaas, J.M., van Oortmerssen, G.A., 1987. Individual differences in behavioural reaction to a changing environment in mice and rats. Behaviour 100, 105–122.
Benus, R.F., Bohus, B., Koolhaas, J.M., van Oortmerssen, G.A., 1991. Heritable variation for aggression as a reflection of individual coping strategies. Experientia 47, 1008–1019.
Beuving, G., Jones, R.B., Blokhuis, H.J., 1989. Adrenocortical and heterophilrlymphocyte responses to challenge in hens showing short or long tonic immobility reactions. Br. Poult. Sci. 30, 175–184. Engel, B., Walstra, P., 1993. Accounting for subpopulations in prediction of the proportion of lean meat in pig
carcasses. Animal Production 57, 147–152.
Erhard, H.W., Mendl, M., 1997. Tonic immobility in pigs: two interpretations — coping strategies or fear. In:
Ž .
Forbes, J.M., Lawrence, T.L.J., Rodway, R.G., Varley, M.A. Eds. , Animal Choices. Occasional Publication No. 20. British Society of Animal Science, Edinburgh.
Erhard, H.W., Mendl, M., 1998. Tonic immobility and emergence time in pigs — more evidence for
Ž .
behavioural strategies. Appl. Anim. Behav. Sci. in press .
Erhard, H.W., Mendl, M., van Schotthorst, L., 1998. Qualitative and quantitative effects of handling on tonic
Ž .
immobility in pigs. In: Veissier, I., Boissy, A. Eds. , Proceedings of the 32nd Congress of the International Society for Applied Ethology, 21–25 July 1998, Clermont-Ferrand, France. INRA, Clermont-Ferrand.
Forkman, B., Furuhaug, I.L., Jensen, P., 1995. Personality, coping patterns, and aggression in piglets. Appl. Anim. Behav. Sci. 45, 31–42.
Glass, D.C., 1977. Stress, behaviour patterns, and coronary disease. Am. Sci. 65, 177–187.
Gonyou, H.W., Stookey, J.M., 1987. Maternal and neonatal behaviour. Vet. Clin. North Am. Food Anim.
Ž .
Pract. 3 2 , 231–249.
Hartsock, T.G., Graves, H.B., Baumgardt, B.R., 1977. Agonistic behavior and the nursing order in suckling piglets: relationships with survival, growth and body composition. J. Anim. Sci. 44, 320–331.
Hessing, M.J.C., Hagelsø, A.M., van Beek, J.A.M., Wiepkema, P.R., Schouten, W.G.P., Krukow, R., 1993. Individual behavioural characteristics in pigs. Appl. Anim. Behav. Sci. 37, 285–295.
Hessing, M.J.C., Hagelsø, A.M., van Beek, J.A.M., Wiepkema, P.R., Schouten, W.G.P., 1994a. Individual behavioural and physiological strategies in pigs. Physiol. Behav. 55, 39–46.
Hessing, M.H.C., Coenen, G.J., Vaiman, M., Renard, Ch., 1994b. Individual cell-mediated and humoral immunity in pigs. Vet. Immunol. Immunopathol. 41, 97–113.
Hessing, M.J.C., Schouten, W.G.P., Wiepkema, P.R., Tielen, M.J.M., 1994c. Implications of individual
Ž .
behavioural characteristics on performance in pigs. Livestock Production Science 40 2 , 187–196. Jensen, P., 1995. Individual variation in the behaviour of pigs — noise or functional coping strategies?. Appl.
Anim. Behav. Sci. 44, 245–255.
Jensen, P., Rushen, J., Forkman, B., 1995a. Behavioural strategies or just individual variation in behaviour? A lack of evidence for active and passive piglets. Appl. Anim. Behav. Sci. 43, 135–139.
Jensen, P., Forkman, B., Thodberg, K., Koster, E., 1995b. Individual variation and consistency in piglet¨
behaviour. Appl. Anim. Behav. Sci. 45, 43–52.
Jones, R.B., Satterlee, D.G., 1995. Threat-induced behavioural inhibition in Japanese quail genetically selected for contrasting adrenocortical response to mechanical restraint. Br. Poult. Sci. 37, 465–470.
Lawrence, A.B., Terlouw, E.M.C., Illius, A.W., 1991. Individual differences in behavioural responses of pigs exposed to non-social and social challenges. Appl. Anim. Behav. Sci. 30, 73–86.
McGraw, C.P., Klemm, W.R., 1973. Genetic differences in susceptibility of rats to the immobility reflex
Ž‘‘animal hypnosis’’ . Behav. Genet. 3, 155–161..
Ž .
Pines, A., Kafry, D., 1982. Coping with burnout. In: Jones, J.W. Ed. , The Burnout Syndrome. London House, Parkridge, IL, pp. 139–150.
SAS Institute, 1989. SASrSTAT User’s Guide, Version 6, 4th edn., Vol. 2. Cary, NC, USA.
Schrama, J.W., Schouten, J.M., Swinkels, J.W.G.M., Gentry, J.L., de Vries Reilingh, G., Parmentier, H.K., 1997. Effect of hemoglobin status on humoral immune response of weanling pigs differing in coping styles. J. Anim. Sci. 75, 2588–2596.
Simoni, P.S., Paterson, J.J., 1997. Hardiness, coping and burnout in the nursing workplace. J. Prof. Nurs. 13
Sluyter, F., Bult, A., Lynch, C.B., van Oortmerssen, G.A., Koolhaas, J.M., 1995. A comparison between house mouse lines selected for attack latency or nest building: evidence for a genetic basis of alternative
Ž .
behavioural strategies. Behav. Genet. 25 3 , 247–252.
Stevenson-Hinde, J., Stillwell-Barnes, R., Zunz, M., 1980. Individual differences in young rhesus monkeys:
Ž .