THE EFFECT OF PANSHARPENING ALGORITHMS ON THE RESULTING
ORTHOIMAGERY
P. Agrafiotis*, A. Georgopoulos and K. Karantzalos
National Technical University of Athens, School of Rural and Surveying Engineering, Department of Topography Zografou Campus, Heroon Polytechniou 9, 15780, Zografou, Athens, Greece
[email protected], [email protected], [email protected]
Commission VII, WG VII/6
KEY WORDS: Orthoimage, Pansharpening, Digital Surface Model (DSM), Accuracy, Pleiades-1B
ABSTRACT:
This paper evaluates the geometric effects of pansharpening algorithms on automatically generated DSMs and thus on the resulting orthoimagery through a quantitative assessment of the accuracy on the end products. The main motivation was based on the fact that for automatically generated Digital Surface Models, an image correlation step is employed for extracting correspondences between the overlapping images. Thus their accuracy and reliability is strictly related to image quality, while pansharpening may result into lower image quality which may affect the DSM generation and the resulting orthoimage accuracy. To this direction, an iterative methodology was applied in order to combine the process described by Agrafiotis and Georgopoulos (2015) with different pansharpening algorithms and check the accuracy of orthoimagery resulting from pansharpened data. Results are thoroughly examined and statistically analysed. The overall evaluation indicated that the pansharpening process didn’t affect the geometric accuracy of the resulting DSM with a 10m interval, as well as the resulting orthoimagery. Although some residuals in the orthoimages were observed, their magnitude cannot adversely affect the accuracy of the final orthoimagery.
1. INTRODUCTION
Satellite optical sensors provide very valuable data about the earth surface through map-making and environmental monitoring. However, these applications are extremely expensive and the scientific community should use this data obtained from available sensors in the best way. A typical example of this is the pansharpening process, i.e. the fusion of multispectral satellite imagery of low spatial and high spectral resolution with the panchromatic imagery of high spatial and low spectral resolution. In recent years, pansharpening has become a task of great importance in the field of data fusion, as demonstrated by the increasing number of scientific contributions to this topic.
Pansharpening addresses the fusion of two optical remote sensing images characterized by different spectral and spatial features. Specifically, a Multi Spectral (MS) image with high spectral but low spatial resolution is considered along with a Panchromatic (PAN) image, which is obtained by sensing a single wide electromagnetic spectrum covering the visible and near infrared (VNIR) frequencies and has complementary characteristics with respect to MS: lower spectral but greater spatial resolution. Due to cost and complexity issues and limited on-board storage capabilities, the multispectral sensor has much smaller aperture than the panchromatic sensor thus reducing the spatial resolution of the sensed multispectral image (Shaw and Burke, 2003).For a typical modern multispectral satellite sensor, this ratio is 1 to 16, i.e., a single multispectral image pixel translates to 4 by 4 panchromatic pixels.
Pansharpening is the fusion of the images captured by the multispectral and panchromatic sensors. The objective of pansharpening algorithms is the generation of a fused product
* Corresponding author.
characterized by the spectral content of the MS image and the spatial details of the PAN image. This means that the pansharpened image has the same number of pixels as the panchromatic image and also the same number of bands as the multispectral image.
In this paper are investigated the geometric effects of pansharpening algorithms on automatically generated DSMs and thus the resulting orthoimagery. This investigation is motivated by the fact that on automatically generated Digital Surface Models, image correlation is used to extract matching pixels in overlapping images. It is therefore inevitable that their accuracy is strictly related to image quality. Since the Pansharpening process sometimes results in low image quality, it may eventually affect the DSM generation and then the resulting orthoimage accuracy.
To this direction, an iterative methodology was applied in order to combine the methodology described in the prior work (Agrafiotis and Georgopoulos, 2015) with different pansharpening algorithms and check the accuracy of orthoimagery resulting from pansharpened data.
2. STUDY AREA AND DATASET 2.1 Antiparos Island
2.2 The Pleiades 1B Imagery
Pleiades-1B satellite sensor was successfully launched on December 2, 2012. Built by AIRBUS Defence & Space, the satellite was launched from a Soyuz launcher at the European Space Centre in French Guiana. Pleiades-1A and 1B satellites are phased 180° apart in the same near-polar sun-synchronous orbit at an altitude of 694 km, enabling daily revisits to any location on the planet. The sensor can reach a ground resolution of 0.7m in panchromatic mode and 2.8m in multi-spectral mode in 2013 in the morning within 22.5 seconds. The average viewing angles of the two selected images are, respectively, 6.30° and 9.47° in across-track direction with respect to the nadir and 1.63° and -12.39° in along-track direction (Figure 1).
Figure 1. Stereo acquisition for 3D applications (Google Earth preview of the footprints and the satellite's position)
2.3 Control Dataset
In order to evaluate the produced orthoimages, accuracy specifications had to be set as a reference for the purpose of inferring about the actual metric efficiency of the product. As control dataset aerial imagery orthophotomosaic (Very Large Scale Orthophotos - VLSO) provided by the Hellenic National Cadastre & Mapping Agency S.A. (NCMA S.A) was used. It had 0.25m GSD and the imagery was taken on August 12th 2012. According to NCMA S.A. the orthophotomosaic of the control dataset was created from scanned in 1700 dpi (1pixel = 15μm) aerial imagery of a scale of 1:15000. The initial aerial images were acquired using a ZEISS RMK TOP 30 film camera having a lens of 153.12mm. To produce this orthoimagery, a DEM was created having 5m grid interval.
3. PRIOR WORK
In a prior work (Agrafiotis and Georgopoulos, 2015) the accuracy and radiometric quality of orthorectified high resolution satellite imagery from Pleiades-1B and GeoEye-1 satellites were investigated through a comparative evaluation of their
quantitative and qualitative properties with and LSO and a VLSO as the benchmark dataset. In addition, the advantages and limits of the Pleiades Imaging for producing Large Scale Orthophotos (LSO) were also investigated. The performed visual assessment of the orthoimagery revealed that Pleiades-1B orthoimagery is especially promising presenting much more information and clearer forms. On the contrary, abrupt changes of brightness and contrast and high radiometric saturation levels were observed on the GeoEye-1 orthophotomosaic. The geometric evaluation reveals that the used LSO and Geoeye-1 orthomosaic suffer from a geometric systematic error in Y axis. Both radiometric and accuracy test results show that Pleiades-1B orthoimage has almost the same absolute accuracy as the orthophotomosaic from aerial imagery (LSO from Hellenic National Cadastre & Mapping Agency S.A.). Hence, it could easily replace aerial imagery, when it comes to orthoimage production. Furthermore, all data are adequate for producing LSO for mapping and GIS, according to JRC (Kapnias et al., 2008) and NSSDA (FGDC, 1998) accuracy standards. The results also serve for a critical approach for the usability and cost efficiency of satellite imagery for the production of LSO.
4. METHODOLOGY
Having already exploited and measured a benchmark dataset, the orthomosaic of N.C.M.A. S.A. of 0.25m GSD (VLSO), was decided to use the same Control Points described in (Agrafiotis and Georgopoulos, 2015) and compare the measurements with measurements on the new Orthoimagery, produced from pansharpened images.
Figure 2: Workflow chart for checking the effects of pansharpening process
•Control and Check point meas.
•RPC Orientation with 1stdegree
polynomial
To this end, the classical photogrammetric workflow available in ERDAS Photogrammetry Tool (former LPS) environment (ERDAS 2014) was followed for the processing of the stereo satellite imagery, DSM generation and orthorectification. In addition to the workflow applied in the prior work, pansharpening procedures were performed between the stages of Image Orientation and Image Matching. There, the pansharpened imagery created using HIS, PCA and Brovey transformations was replacing the PAN imagery, changing the file location. In this way, the initial Image Orientation Parameters remained the same for the whole block in order to produce more objective and reliable results. In this way, the only parameter differentiated, is the source image which may lead to different Image matching for DSM generation.
4.1 Pansharpening Algorithms
In recent years, pansharpening has become a task of great importance in the field of data fusion, as demonstrated by the increasing number of scientific contributions to this topic. It is possible to group them into two main families (Aiazzi et al., 2012):
i. The methods based on the projection of the MS image into a new space and the substitution of a component with a histogram matched version of the PAN image (the so-called Component Substitution (CS) class) and
ii. The approaches based on the extraction of spatial details from the PAN image and their injection into the MS one (this class is called Multi-Resolution Analysis (MRA) because details are usually obtained through a multiscale decomposition of the original image).
There are also hybrid methods based on both MRA and CS. Then there are methods based on varied techniques, such as the P+XS method. Widely known examples of the CS methods are Intensity Hue Saturation (Haydn et al., 1982), Principal Component Analysis (Chavez and Kwarteng, 1989, Shah et al., 2008) and Gram-Schmidt (GS) (Laben and Brower, 2000) techniques. MRA methods are usually based on methods such as the Undecimated Discrete Wavelet Transform (UDWT) or other kinds of pyramidal or multi-scale representations. A more systematic overview of pansharpening methodologies belonging to these two categories can be found in Thomas et al., (2008) and Aiazzi et al., (2012). Additionally, during the last years, remarkable approaches which do not fit in this classifications have been described in the literature. Among those, Bayesian methods based on parameter estimation total variation penalization terms and sparse signal representation are listed (Fasbender et al., 2008; Palsson et al., 2014; Li and Yang, 2011; Zu and Bamler, 2013).
4.1.1 Implemented Algorithms and Results
Initially it was decided to check state of the art pansharpening algorithms such as HCS, IHS and HPF. However, this decision could not be realized since pansharpening procedures in ERDAS Imagine 2014 using the specific Pleiades 1B data produce images of wrong dimensions. To overcome this problem, pansharpening was performed using the Photomod photogrammetric software by Racurs. There, the three commonly used methods are offered, even not belonging to the state of the art: the Brovey transform, the IHS (Intensity, Hue, Saturation) method, and the PCA (Principal Component Analysis) method.
The Brovey transform is based on spectral modelling, while the IHS and PCA methods call upon projection techniques. These
methods are available in most commercial software packages for satellite image processing, which may explain their large use by practitioners (Ranchin and Wald). Details on these methods can be found in e.g., Carper et al. (1990) or Pohl and Van Genderen (1998).
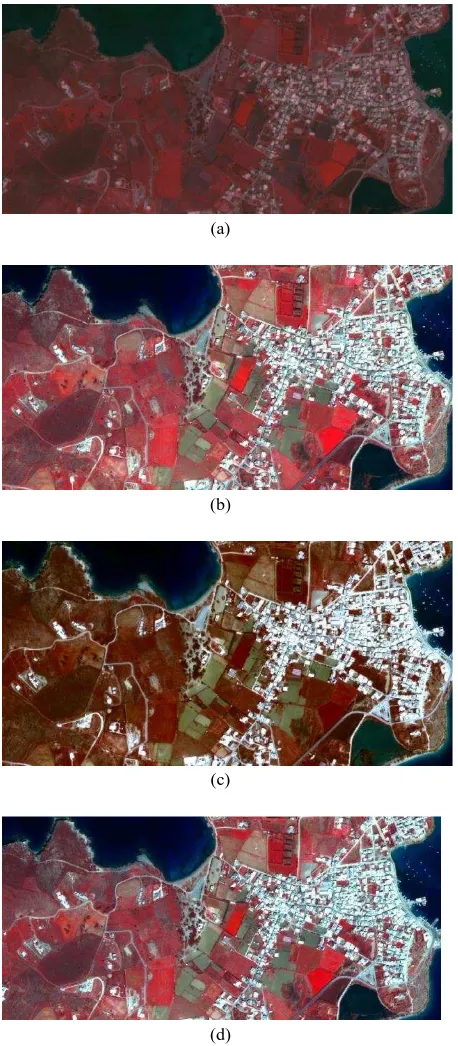
(a)
(b)
(c)
(d)
Figure 3: A zoom of the original MS image (a) and the Pansharpening results from IHS (b), Brovey (c) and PCA (d)
algorithms for 4 Bands.
4.2 Automatic DSM Generation
automatic DSM generation stage or Automatic Terrain Extraction (ATE) is described here in order to better understand how the Pansharpening process may affect the extracted DSM and thus the resulting Orthoimagery.
In the literature several techniques are presented suitable for DSM extraction. Some of them are digital aerial and terrestrial photogrammetry, airborne and terrestrial laser scanning, GPS methodology with its different measurement approaches and active and passive remote sensing, with optical satellite imagery systems (Fraser et al., 2002). In particular, aerial and satellite photogrammetry is a powerful tool for surface model generation extracting high resolution DSMs by means of automated image matching procedures. For these tools, DSM can be either in vector or raster format and its density ranges from 1/3 to 1/10 of density of the original image pixels.
The standard procedures to generate DSMs are based on fundamental steps which consist in internal orientation, external orientation (registration into a defined reference system) and point extraction. For the tests performed in the context of this project, the standard procedures described above are the same for all blocks. The only parameter which is differentiated is the used imagery and thus the extracted points. The seven different DSMs were generated in the ERDAS LPS module Classic ATE (Classic Automatic Terrain Extraction) with stereo image matching, which aims at finding dense and robust correspondences between stereo images and estimate their 3D coordinates in object space. Since the elevation interval was chosen to be 10 meters and the external accuracy of the buildings was not to be checked, there was no need of using the eATE tool of the software which is more time consuming.
The matching procedure in Classic ATE is pyramid based, that is, it starts from high-pyramid levels and continues to low pyramid levels. At each level the search range used stays the same on image space but is actually reduced to half on object space, which means search range goes smaller and smaller by brute-force. This method is proven to be a reliable solution (Xu et al., 2008) since the approach is based on multi-band image matching for increasing the precision of the results. Since this automatic DSM generation approach of the used software is mainly characterised by the feature-based matching technique being hierarchically applied in image pyramids and a robust surface reconstruction with finite elements, it is expected the resulting DSMs from different pansharpened data to be differentiated between them. Remarkable is that all the DSMs resulting from the 4-Band Pansharpened data are displayed by almost the same grey values. However, there values are differentiated by the values consisting the DSMs resulting from the 3-Band data. This is probably occurs due to the existence of the 4th Band, the NIR band.
5. SPATIAL ACCURACY ASSESSMENT OF PANSHARPENING ALGORITHMS
In order to assess and compare the pansharpening algorithms in terms of accuracy, the same 25 checkpoints used in the previous work (Agrafiotis and Georgopoulos, 2015) were measured on the resulting orthoimagery. In more detail, the 25 checkpoints were measured on the orthoimagery created using the IHS, PCA and BROVEY pansharpening algorithms for three (RGB) and four spectral bands (RGB-NIR). The coordinates of these checkpoints were determined (i) on the reference/control data i.e., the aerial orthophoto (VLSO) provided by the Hellenic National Cadastre & Mapping Agency S.A. (NCMA S.A), with 25cm GSD,
acquired during August 2012 and also (ii) on the orthoimagery created using the Panchromatic data.
5.1 Checkpoints Selection and Distribution
According to the NSSDA and JRC Guidelines, accuracy testing should be performed using an independent source of higher positional accuracy. The accuracy of the independent test points should fall within one-third of the intended accuracy (95% confidence level) of the examined dataset. A minimum of 20 well defined test points should be used to evaluate the accuracy of the dataset. The check points will be ideally evenly distributed and located across the image (Figure 4). The selected check point positions may be located with reference to the positions of the GCPs used to correct the imagery in order to ensure that the two sets of points are independent (CPs should not be close to the GCPs).
Figure 4. Checkpoints distribution on the reference/control dataset
The location or the distribution of the checkpoints is also specified in NSSDA and JRC guidelines. These Standards assume that the area to be evaluated is a rectangle and is divided into four quads and a diagonal is to be established across the area. At least 20% of the points should lie in each quarter whereas the optimum distance between points (is related to the diagonal distance of the area (1/10th of the diagonal length).
The results are presented with a statistical analysis and they are evaluated in order to present the effect of the pansharpened imagery on the orthoimage production process. To this direction the Standard Deviation (σ) or sigma are computed as an indicator of how well the measurements fit each other and a measure of precision. In addition, the Root Mean Squares Error (RMSE) is computed for Northing (X) and Easting (Y) coordinates as well as the combined RMSE (XY). It is assumed that errors in the spatial data have random behavior and that systematic errors have been eliminated as best as possible.
� = √∑ ��� �
�= − ℎ � (2)
� = √∑ ���
�
�= − ℎ � (3)
� = √ � − � (4)
where d = the deviation
n = the number of check points
X,Ycheck = the check points coordinates
measured on control dataset and
X,Ydata = the points coordinates measured
on test dataset
5.2 Overall Evaluation
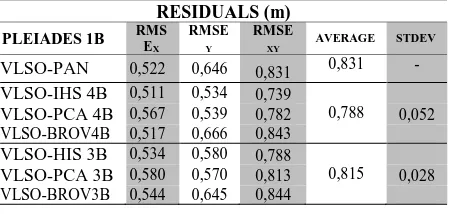
Tables 1 and 2 present the resulting residuals for all performed tests for the Pleiades 1B dataset. More specifically, the residuals of the comparison of the control dataset (VLSO) with (a) the Panchromatic orthoimage (Table 1), (b) the orthoimages resulting from four band pansharpened data (Table 1) and (c) three band pansharpened data (Table 2) are presented. In addition, results of the comparison of the panchromatic orthoimage with the orthoimages from pansharpened data of three and four bands are included.
Since the accuracy comparison between the control dataset (VLSO) and the Pleiades 1B orthoimagery resulting from panchromatic data, has been already presented in Chapter 3, in this subsection the goal is to analyze and interpreter the effect of pansharpening on the resulting orthoimagery.
RESIDUALS (m)
PLEIADES 1B RMSEX RMSEY RMSE XY AVERAGE STDEV
VLSO-PAN 0,522 0,646 0,831 0,831 - VLSO-IHS 4B 0,511 0,534 0,739
VLSO-PCA 4B 0,567 0,539 0,782 0,788 0,052 VLSO-BROV4B 0,517 0,666 0,843
VLSO-HIS 3B 0,534 0,580 0,788
VLSO-PCA 3B 0,580 0,570 0,813 0,815 0,028 VLSO-BROV3B 0,544 0,645 0,844
Table 1: Resulting residuals for the performed experiments on Pleiades 1B when compared with the control dataset
As it can be observed in Table 1, the orthoimagery from Panchromatic and Pansharpened data compared with the control dataset delivered almost the same RMSEXY which equals to 0.810m in average, i.e., 1.60 times the pixel size of the GSD which is 0.50m. As for the Pansharpening algorithms, it seems that systematically, the Brovey fusion presents the largest residual errors, both in the case with the four bands (RGB-NIR) and that with the three (RGB).
However, the reported residuals are within the accuracy limits that are specified by the JRC Guidelines and NSSDA Accuracy Standards. Moreover, it is observed that orthoimageries resulting from four band data have almost the same residual errors as the orthoimageries produced from three band data.
For the comparison between the Panchromatic orthoimage and the orthoimages produced using Pansharpened data (Table 2), it
is obvious that the three band orthoimagery presents better accuracy 25%. This was initially not anticipated. It was expected that the 4 bands would provide more data, thus enhancing the matching results, which sees that it is not the case. However, the residual errors of both datasets are about the size of the GSD and within the accuracy limits for producing LSO. Among the pansharpening algorithms, it appears that the Brovey fusion presents the largest residuals at 75% of the cases (3 out of 4) while the PCA is covering the rest 25%. The IHS pansharpening algorithm residual errors seem to be the most times similar with the average of the residual errors in most of the cases.
RESIDUALS (m)
PLEIADES 1B RMSEX RMSE Y RMSE XY AVERAGE STDEV
PAN-IHS 4B 0,367 0,437 0,571
PAN-PCA 4B 0,487 0,372 0,613 0,567 0,048 PAN-BROV 4B 0,310 0,414 0,517
PAN-IHS 3B 0,335 0,300 0,450
PAN-PCA 3B 0,292 0,292 0,413 0,446 0,031 PAN-BROV 3B 0,270 0,389 0,474
Table 2: Resulting residuals for all experiments on Pleiades 1B panchromatic data compared with the pansharpened data.
The above results suggest that the Pansharpening process doesn’t seem to affect the geometric accuracy of the resulting DSM with a 10m interval and the resulting orthoimagery. Although some residuals in the orthoimages produced by the methods examined are observed, their magnitude cannot adversely affect the overall accuracy of the orthoimagery. For accurate orthoimages, DSMs could be generated either by panchromatic data or by pansharpened data as regards the tested algorithms without compromising the geometric accuracy of the produced orthoimage. This leads the users to choose the appropriate fusion algorithm based only on its radiometric properties and capabilities. The above observations may lead users to acquire the pansharpened products directly and thus saving processing time.
Figure 5: Graphic representation of the resulting residuals in meters
-0.1 0.1 0.3 0.5 0.7 0.9 1.1 1.3 1.5 (m)
6. CONCLUDING REMARKS AND FUTURE WORK In this paper the effects of the IHS, PCA and Brovey pansharpening algorithms on resulting orthoimagery were quantitatively evaluated. In particular, an iterative methodology was applied in order to combine the methodology described in prior work (Agrafiotis and Georgopoulos, 2015). DSMs and Orthoimages were created using: (a) only the Panchromatic and (b) the Pansharpened data for each block. In this way, for each different block, the same control points, check points and tie points were used.
Future work includes testing more state of the art pansharpening algorithms on more Very High Resolution Satellite imagery such as GeoEye-1 and WorldView-2. In addition, these tests will be applied using various software and freeware in order to acquire more reliable and objective results for this investigation.
ACKNOWLEDGEMENTS
The authors would also like to thank Astrium GEO-Information Services which provided the Pléiades triplet for research and investigation purposes. Finally, the contribution of NCMA S.A, through the provision of the orthophoto and DEM, produced by aerial photography is acknowledged. The guidance by PhD Candidate Aristeidis Vaiopoulos in the field of Pansharpening is also acknowledged.
REFERENCES
Agrafiotis, P., & Georgopoulos, A., 2015. Comparative Assessment of Very High Resolution Satellite and Aerial Orthoimagery. The International Archives of Photogrammetry, Remote Sensing and Spatial Information Sciences, 40(3), 1.
Aiazzi, B., Alparone, L., Baronti, S., Garzelli, A., and Selva, M., 2012, “Twenty- five years of pansharpening: A critical review
and new developments,” in Signal and Image Processing for Remote Sensing, C.-H. Chen, Ed., 2nd ed. Boca Raton, FL, USA: CRC Press, pp. 533–548
Carper, W. J., Lillesand, T. M., and Kiefer, P. W., 1990, The use of intensity-hue-saturation transformations for merging spot panchromatic and multispectral image data, Photogramm. Eng. Remote Sens., vol. 56, no. 4, pp. 459–467.
Chavez, P. S., Kwarteng, Jr. and A. W., 1989, “Extracting spectral contrast in Landsat Thematic Mapper image data using
selective principal component analysis,” Photogramm. Eng. Remote Sens., vol. 55, no. 3, pp. 339–348.
Fasbender, D., Radoux, J., and Bogaert, P., 2008, “Bayesian data
fusion for adaptable image pansharpening,” IEEE Trans. Geosci. Remote Sens., vol. 46, no. 6, pp. 1847–1857.
FGDC. 1998. Geospatial Positioning Accuracy Standards Part 3: National Standard for Spatial Data Accuracy, FGDC-STD-007.3-1998 https://www.fgdc.gov/standards/projects/FGDC-standards-projects/accuracy/part3/index_html
Fraser, C.S., E. Baltsavias and A. Gruen (2002): Processing of Ikonos imagery for submetre 3D positioning and building extraction, ISPRS J.Photogramm. Remote Sensing, 56, 177-194
Gleyzes, M. A., Perret, L., and Kubik, P., 2012. Pleiades system architecture and main performances. International Archives of
the Photogrammetry, Remote Sensing and Spatial Information Sciences, 39, B1.
Kapnias, D., Milenov, P., and Kay, S. 2008. Guidelines for Best practice and quality checking of ortho imagery. Joint Research Centre, (3.0).
Laben C. A. and Brower B. V., 2000, “Process for enhancing the spatial resolution of multispectral imagery using pan-sharpening,” U.S. Patent 6 011 875, Eastman Kodak Company, Tech. Rep.
Li, S. and Yang, B., 2011, “A new pan-sharpening method using
a compressed sensing technique,” IEEE Trans. Geosci. Remote Sens., vol. 49, no. 2, pp. 738–746.
Palsson, F., Sveinsson, J. R., and Ulfarsson, M. O., 2014, “A new
pansharpening algorithm based on total variation,” IEEE Geosci. Remote Sens. Lett., vol. 11, no. 1, pp. 318–322.
Pohl ,C.,. Van Genderen, J.L, 1998, “Multisensor image fusion
in remote sensing: concepts, methods and application”,
International Journal of Remote Sensing, vol. 99, no. 5, pp. 823-854.
Ranchin, T., & Wald, L., 2000, Fusion of high spatial and spectral resolution images: the ARSIS concept and its implementation. Photogrammetric Engineering and Remote Sensing, 66(1), 49-61.
Shah, V. P., Younan, N. H., and King, R. L., 2008, “An efficient pan-sharpening method via a combined adaptive-PCA approach
and contourlets,” IEEE Trans. Geosci. Remote Sens., vol. 46, no. 5, pp. 1323–1335
Thomas, C., Ranchin, T., Wald, L., and Chanussot, J., 2008,
“Synthesis of multispectral images to high spatial resolution: A
critical review of fusion methods based on remote sensing
physics,” IEEE Trans. Geosci. Remote Sens., vol. 46, no. 5, pp. 1301–1312.
Xu, F. and Woodhouse, N. and Xu, Z. and Marr, D. and Yang, X. and Wang, Y., 2008. Blunder elimination techniques in adaptive automatic terrain extraction. ISPRS J. Photogramm. Remote Sensing, 29 (3), 21. p.1139-1148.