Codermetrics
Analytics for Improving Software Teams
Codermetrics
by Jonathan Alexander
Copyright © 2011 Jonathan Alexander. All rights reserved. Printed in the United States of America.
Published by O’Reilly Media, Inc., 1005 Gravenstein Highway North, Sebastopol, CA 95472. O’Reilly books may be purchased for educational, business, or sales promotional use. Online editions are also available for most titles (http://my.safaribooksonline.com). For more information, contact our corporate/institutional sales department: (800) 998-9938 or [email protected].
Editors: Andy Oram and Mike Hendrickson
Production Editor: Kristen Borg
Proofreader: O’Reilly Production Services
Indexer: John Bickelhaupt
Cover Designer: Karen Montgomery
Interior Designer: David Futato
Illustrator: Robert Romano
Printing History:
August 2011: First Edition.
Nutshell Handbook, the Nutshell Handbook logo, and the O’Reilly logo are registered trademarks of O’Reilly Media, Inc. Codermetrics, the image of a whitebar surgeonfish, and related trade dress are trademarks of O’Reilly Media, Inc.
Many of the designations used by manufacturers and sellers to distinguish their products are claimed as trademarks. Where those designations appear in this book, and O’Reilly Media, Inc., was aware of a trademark claim, the designations have been printed in caps or initial caps.
Table of Contents
Preface . . . ix
Part I. Concepts
1. Introduction . . . 3
2. Measuring What Coders Do . . . 11
The Purpose of Metrics 11
Metrics Are Not Grades 13
Team Dynamics 13
Connecting Activities to Goals 15
Good Metrics Shed a Light 15
Examining Assumptions 16
Timeout for an Example: The Magic Triangle (Partially) Debunked 18
Patterns, Anomalies, and Outliers 20
Peaks and Valleys 22
Ripple Effects 23
Repeatable Success 24
Understanding the Limits 25
Timeout for an Example: An Unexpected Factor in Success 25
Useful Data 27
Choosing Data 30
Obtaining Data 30
Spotters and Stat Sheets 32
Fairness and Consistency 33
Timeout for an Example: Metrics and the Skeptic 34
3. The Right Data . . . 37
Questions That Metrics Can Help Answer 37
How Much Do Coders Contribute Beyond Their Core Responsibilities? 38
How Well Do Coders Interact With Others? 40
Is the Software Team Succeeding or Failing? 41
Timeout for an Example: An MVP Season 44
The Data for Metrics 45
Data on Coder Skills and Contributions 45
Data on Software Adoption, Issues, and Competition 56
Timeout for An Example: A Tale of Two Teams 62
Part II. Metrics
4. Skill Metrics . . . 69
Input Data 69
Offensive Metrics 70
Defensive Metrics 80
Precision Metrics 86
Skill Metric Scorecards 93
Observations on Coder Types 96
Architects 96
Senior Coders 97
Junior Coders 98
5. Response Metrics . . . 101
Input Data 101
Win Metrics 102
Loss Metrics 109
Momentum Metrics 116
Response Metric Scorecards 126
Observations on Project Types 128
Consumer Software 128
Enterprise Software 129
Developer and IT Tools 130
Cloud Services 131
6. Value Metrics . . . 133
Input Data 133
Contribution Metrics 134
Rating Metrics 143
Value Metric Scorecards 151
Observations on Team Stages 151
Early Stage 151
Mature Stage 155
Part III. Processes
7. Metrics in Use . . . 159
Getting Started 160
Find a Sponsor 160
Create a Focus Group 160
Choose Trial Metrics 161
Conduct a Trial and Review The Findings 163
Introduce Metrics to the Team 165
Create a Metrics Storage System 166
Expand the Metrics Used 167
Establish a Forum for Discourse 168
Timeout for an Example: The Seven Percent Rule 168
Utilizing Metrics in the Development Process 170
Team Meetings 170
Project Post-Mortems 173
Mentoring 175
Establishing Team Goals and Rewards 176
Timeout for an Example: The Turn-Around 178
Using Metrics in Performance Reviews 183
Choosing Appropriate Metrics 183
Self-Evaluations and Peer Feedback 185
Peer Comparison 186
Setting Goals for Improvement 187
Promotions 187
Taking Metrics Further 189
Create a Codermetrics Council 189
Assign Analysis Projects 191
Hire a Stats Guy or Gal 192
Timeout for an Example: The Same But Different 193
8. Building Software Teams . . . 201
Goals and Profiles 201
Set Key Goals 202
Identify Constraints 202
Find Comparable Team Profiles 203
Build a Target Team Profile 208
Roles 211
Playmakers and Scorers 211
Utility Players 213
Role Players 214
Backups 215
Motivators 215
Veterans and Rookies 216
Timeout for an Example: Two All-Nighters 218
Personnel 220
Recruit for Comps 221
Establish a Farm System 224
Make Trades 225
Coach the Skills You Need 226
Timeout for an Example: No Such Thing As a Perfect Team 227
9. Conclusion . . . 229
A. Codermetrics Quick Reference . . . 233
B. Bibliography . . . 237
Preface
Is there a rational way to measure coder skills and contributions and the way that software teams fit together? Could metrics help you improve coder self-awareness, teamwork, mentoring, and goal-setting? Could more detailed data help you make better hiring decisions, help make performance reviews fairer, and help your software teams become more successful?
Whether you are a coder, team leader, or manager, if you are interested in any of these topics or in how metrics can be applied in a variety of other ways for software devel-opment teams, then this book is designed with you in mind. The ideas in this book are a departure from how metrics have been applied to software development in the past. The concepts and techniques presented here are meant to help you think differently about building software teams and to help get you started on your own journey using metrics in new and better ways as part of the software development process.
As a manager of software teams, I myself am on that journey. I believe the techniques in this book have helped “turn around” troubled software teams and have helped good software teams become even better. Gathering metrics on a wider set of activities and outcomes isn’t the only path to success, of course, but it has worked for me, and I believe it can work for you, too.
Organization of This Book
This book is written in three parts, designed to be read in order, although you may find specific parts of the book more useful for later review if you are putting metrics into practice. Part I, “Concepts”, provides a more detailed introduction behind the thinking of codermetrics, the variety of analyses that metrics can enable, and the data that can be measured for coders and software development teams. Part II, “Metrics”, is set up as a kind of metrics reference guide, with each metric explained with examples and notes. Part III, “Processes”, covers techniques to introduce metrics in your teams and put them to use in the development process, as well as how to use metrics to improve and build better software teams.
Part I, “Concepts”, consists of the following chapters:
Chapter 1, Introduction, provides a more detailed explanation of the thoughts, motivations, and goals behind this book.
Chapter 2, Measuring What Coders Do, talks about the general concepts behind metrics, measuring coders, and analyzing teamwork and team performance.
Chapter 3, The Right Data, discusses what constitutes useful data, how to obtain it, and the detailed data elements that will be used for codermetrics.
Part II, “Metrics”, consists of the following chapters:
Chapter 4, Skill Metrics, covers metrics for a wide variety of coder skills and contributions.
Chapter 5, Response Metrics, covers metrics that measure various types of positive and negative user response to software.
Chapter 6, Value Metrics, covers metrics that highlight the value that coders bring to a team.
Part III, “Processes”, consists of the following chapters:
Chapter 7, Metrics in Use, provides a multistep approach to test and introduce metrics in an organization, and offers techniques to use metrics in the development process and performance reviews.
Chapter 8, Building Software Teams, describes how to use metrics to determine team needs, and how to apply them in personnel planning, hiring, and coaching of current team members.
Safari® Books Online
Safari Books Online is an on-demand digital library that lets you easily search over 7,500 technology and creative reference books and videos to find the answers you need quickly.
With a subscription, you can read any page and watch any video from our library online. Read books on your cell phone and mobile devices. Access new titles before they are available for print, and get exclusive access to manuscripts in development and post feedback for the authors. Copy and paste code samples, organize your favorites, down-load chapters, bookmark key sections, create notes, print out pages, and benefit from tons of other time-saving features.
O’Reilly Media has uploaded this book to the Safari Books Online service. To have full digital access to this book and others on similar topics from O’Reilly and other pub-lishers, sign up for free at http://my.safaribooksonline.com.
How to Contact Us
Please address comments and questions concerning this book to the publisher: O’Reilly Media, Inc.
1005 Gravenstein Highway North Sebastopol, CA 95472
800-998-9938 (in the United States or Canada) 707-829-0515 (international or local)
707-829-0104 (fax)
We have a web page for this book, where we list errata, examples, and any additional information. You can access this page at:
http://oreilly.com/catalog/9781449305154/
To comment or ask technical questions about this book, send email to: [email protected]
For more information about our books, courses, conferences, and news, see our website at http://www.oreilly.com.
Find us on Facebook: http://facebook.com/oreilly Follow us on Twitter: http://twitter.com/oreillymedia
Acknowledgments
The ideas in this book were inspired by Michael Lewis’s writing on sabermetrics and sports statistics, which led me to the writing of Bill James. They are the epitome of informed, informative, and entertaining writers. Although they’ll never have a reason to read this book, my initial thanks is to them.
My thanks also goes to all the excellent coders I’ve worked with over the years, and the fine managers and executives. I’ve been very lucky and I can’t really think of a single professional situation where I didn’t learn a tremendous amount. Particular thanks to Wain Kellum, CEO, and the entire team at Vocalocity, who supported my efforts in writing this book.
I want to thank Andy Oram, my editor at O’Reilly, who helped me through this process and to whom a great deal of credit goes for making this far better than it would have been otherwise. It was a pleasure to work with you, Andy. Also, thanks to Mike Hen-drickson at O’Reilly who originally supported and encouraged this idea. And to the entire O’Reilly Media production team, thanks, too.
For the feedback and reviews they provided on this book during the process, I want to thank Brian Jackson at Google, Nagaraj Nadendla at Taleo, and Ben Wu at Zuora. They are all excellent leaders and managers themselves. Thanks guys.
To my dad, thanks for giving me a love of sports, which has become a love for statistics too. To my mom, thanks for encouraging me to write a book.
PART I
Concepts
CHAPTER 1
Introduction
Let’s not be too sure that we haven’t been missing something important.
—Bill James, baseball statistician and author, from his article “Underestimating the Fog” This is a book about coders, software development teams, metrics and patterns. The ideas in this book originated a few years ago when I started to think about the makeup of software teams, both good and bad, and all the subtle contributions and unsung heroes that are a critical part of success. For almost two decades now, I’ve been re-sponsible for building and managing teams of designers, coders, and testers. Over this time I’ve realized that software teams, similar to sports teams, require a variety of play-ers and skills to succeed. I’ve also learned that there are patterns to success and failure that are not necessarily what I assumed before.
Here’s a simple pattern I’ve seen, and maybe you’ve seen it too: every successful soft-ware team I’ve been on has always had at least one person who uncomplainingly does the little things, like creating the installer, improving the build scripts, or fixing other people’s bugs to get features done. The projects never would have been done, or at least not done well, if someone hadn’t taken on these smaller but detail-oriented tasks. Another pattern: many seasoned software teams I’ve seen had one or two coders who were the clear technical leaders, the go-to people, although they may not necessarily have had the titles to match. These go-to coders not only solved problems, but they exerted a strong influence on others, such that the skills of the other coders often evolved rapidly, closer to the level of the technical leaders. As a result, one or two great coders raised the level of the entire team.
had the personality to lighten the load, tell jokes, lift spirits, and make everyone feel better. Thanks to the “joker” on the team, everyone got back to a (mostly) positive mindset, ready to sprint to the finish.
Patterns of success seem obvious once we see them, but to see them we must learn where and how to look. Once I started to think about this, I began to wonder whether we could create a set of metrics that would give us a clear and objective way to identify, analyze, and discuss the successes or failures of our software teams and the full range of coder skills and contributions. Not as a way to rate performance, but as a way to help us better understand and foster the keys to success, and where and how we might improve. In my own teams I began to experiment, and the positive results have me very encouraged that these methods could be useful for others, too.
This book is my attempt to share some of these ideas and practices. To this point, there is very little material written or otherwise available regarding metrics that can be used to analyze coders and software teams. We have thoughtful books on interviewing, skills-testing, project estimation, project management, team management—and on Agile and other methodologies that make the development process more effective. But we have never had much discussion or explored a quantitative and analytical approach to understanding the skills and work of individual coders to improve software teams. Our metrics, to the extent that most software teams use them today, are commonly a simple set of counts that we use in project estimation or in ongoing project manage-ment. We use bug counts, task counts, time increments (hours/days/weeks)—and with Agile, some of us use story points and velocity. There are also more advanced systems and tools for project estimation that make use of sizing metrics such as KLOCs and Function Points.
But the metrics we commonly deal with don’t provide enough insight to answer many key questions that we have, such as:
• How well is our software team succeeding?
• How are individual team members contributing to the team’s success? • What capabilities can be improved to achieve greater success?
I’m a big sports fan, and so in many parts of this book, I’ve chosen to use sports anal-ogies. It’s not necessary, however, for you to like or understand sports to understand the concepts in this book. Like all analogies, the purpose is just to help make the ideas quicker to grasp and easier to remember. Personally, I think using sports analogies to discuss software teams is apt—and fun.
I think of software development as a team sport. Software products are typically not produced by an individual but by a team, and even in the case where one coder works alone, that coder must fill the various roles of a larger team. In sports, we know that successful teams require players that complement each other, and not everyone needs nor should have the same skills. A football team needs players who can block and tackle as well as those that can run, pass, and catch. Not everyone is good at the same thing. In fact, a team where all players have the same strengths, no matter how strong, is in many cases worse than a team where players have different and contrasting skills. In the end, every player on the team matters, and every player must do their part if the team is going to succeed.
My first thoughts about applying quantitative analysis to coders came from the atten-tion that statistical analysis has recently garnered in major organized sports. Computers and software have contributed to enormous changes in how professional sports teams analyze player statistics, and how they determine the player skills that most directly contribute to winning teams. Bill James and other noted analysts have created a disci-pline around statistical analysis of baseball players referred to as “sabermetrics”. And author Michael Lewis has popularized these newer approaches to sports team man-agement in his books Moneyball and The Blind Side, and in his articles in The New York Times Magazine and other publications.
Many of the people who have pioneered these new approaches in sports management have training in more analytical fields, such as Daryl Morey (GM of the NBA Houston Rockets) who majored in computer science at Northwestern, and Paul DePodesta (VP of the MLB New York Mets and former GM of the Los Angeles Dodgers) who majored in economics at Harvard. This “new” approach in sports is often depicted as a reaction to and move away from the more subjective, gut-feel approach of talent evaluation and team-building. Major sports teams are now very big businesses, with huge amounts of money involved. In this new era, managers responsible for these teams spend more time gathering and analyzing metrics, to help them build winning teams in a more rational and predictable way (and as Moneyball illustrates, in a way that can be more cost-effective and profitable, too). This doesn’t eliminate individual intuition and creativity, but augments it with better knowledge. The key steps followed in this new approach are:
• Find a way to measure the differences between winning and losing teams. • Find a way to measure the contributions of individual players to their teams. • Determine key player characteristics that are highly correlated with winning or
The process of finding meaningful metrics and formulas in sports is not static, but continuously evolving. It’s well understood that there are many important but subtle skills that are hard to measure and analyze, such as a defensive football player’s instinct to find the ball carrier or a player’s ability to perform under pressure. Bill James, for example, publishes regular articles and annual books on baseball in which he introdu-ces new metrics and ideas, some of which others adopt and use, some of which others improve, and some of which turn out to be less useful and eventually fade away. And metrics evolve privately as well as publicly. The actual statistics and formulas that sports teams favor are secretly guarded, since sports is, of course, a competitive field. Many analysts who write publicly also work as private consultants for individual teams. Theo Epstein (GM of the MLB Boston Red Sox) and Billy Beane (GM of the MLB Oakland A’s) may share some information with each other, and they may both benefit by the metrics known to the wider community as a whole—but in the end they are trying to win against each other, so there are some elements about their approach that will never be known outside their organizations.
Our field of software development is less public, with different competitive pressures than major sports leagues, and most coders are not in the public eye. We don’t and probably never will have fans poring over our statistics or putting our poster on their wall (now there’s a scary thought). But it seems a little ironic that those of us who work in a field that in many ways enabled deeper statistical analysis in sports (as well as in other industries), have not yet embraced or fully considered the potential benefits of quantitative analysis in our own domain of software development.
Naturally we, like any workers, might be suspicious about whether good metrics can be found and tell an effective story, and we might be worried that statistics can be misused by managers in performance reviews and such. It is the premise of this book, however, that within our discipline there are a variety of skills and results that we can indeed measure, and from which we can obtain meaningful and useful insights about ourselves and our teams. These numbers are not black and white, and individual num-bers never tell the whole story. Knowing Derek Jeter’s batting average or Tim Duncan’s shooting percentage tells you only a very small part of how effective they are as players and teammates. But when we look at a range of statistics, we can begin to identify patterns for individuals and teams, and sometimes what we find is surprising, even revelatory.
As an example, let me tell you about one of the software teams I managed for many years.
This example was at a venture-backed start-up, with a team of six coders and three testers (we are focusing on coders in this book, so I will focus on them in this example). There were three key phases that we went through in the first two years: initial devel-opment of our 1.0 product release, which took nine months; the period after release when we supported the first customers and developed our 1.1, which took six months; and the development of our 2.0 product release, which took another nine months. The team itself had three senior coders, each with more than ten years of experience and excellent domain knowledge, and three junior coders each with excellent educational backgrounds and about two years of commercial coding experience. During this two year period, all the senior coders remained, but two of the junior coders left after the first year and we brought on two more.
Our executives and our investors thought our initial 1.0 release was a great success. We won a major award at a key industry show and received multiple positive product reviews. We had a large amount of reseller interest, and the number of customer eval-uations were double our expectations, so our sales staff was incredibly busy (this was an on-premise enterprise software solution). Revenues in the first quarters after release were also well ahead of plan.
There were plenty of reasons for our software team to feel good, and everyone was patting us on the back. But was our 1.0 release really a success?
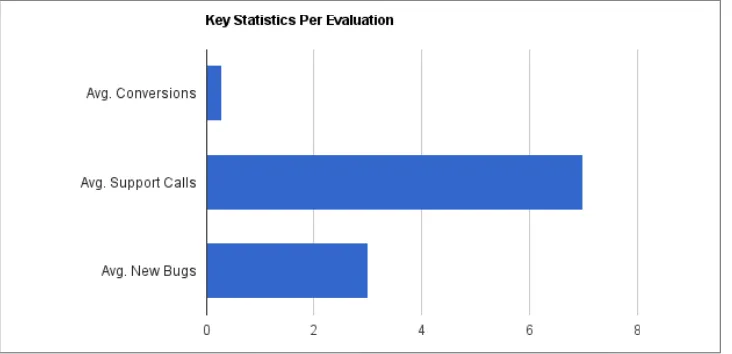
It took us a while to realize it, but a deeper look at the numbers at the time would have revealed some serious problems. The key and troubling facts were this: while we had succeeded in generating public awareness and solid customer interest, every customer trial was generating, on average, seven calls to customer support—despite the fact that each customer received installation and setup assistance. These seven calls were re-sulting in an average support time of three full days to work with the customer and investigate issues, and on average it turned out that every customer was identifying three new bugs in the product that had not been previously found. Coder time to sup-port every customer trial, including the time to assist supsup-port and the time to fix sig-nificant product issues, was measured in weeks, not hours or even days.
Figure 1-1. A look at key metrics of this 1.0 product reveals serious problems
There was another big issue, too. As time went on, certain coders on the team were having trouble getting along. The decreased amount of time spent working on more “exciting” new features, and the increased time spent on less glamorous investigation and bug fixing, combined with the stress related to support in a start-up environment, began to reveal cracks in individuals and in our software team. Personality differences were exacerbated, to the point that certain coders were avoiding each other, and we even had a few incidents of people yelling in the workplace.
The six months following the 1.0 release, during which the team provided support and worked on the 1.1 release, were filled with turmoil and were a near disaster, even though those outside the team still thought everything was fine. Most of each coder’s time went into bug fixing, and we had to delay most of our incremental product improvements. The 1.1 release fixed all the critical bugs—but there were still so many issues remaining that even after the release, the support load and conversion rates did not materially change.
The two coders who left did so of their own accord. While they had been mostly happy during the work on our 1.0 release, they were the ones who disliked the post-release support work the most. They were the ones who most regularly wanted or needed others, specifically the senior coders, to help them if they weren’t familiar with a prob-lem or an area of code. And one of them was the one who had a temper and fought increasingly with other team members over time.
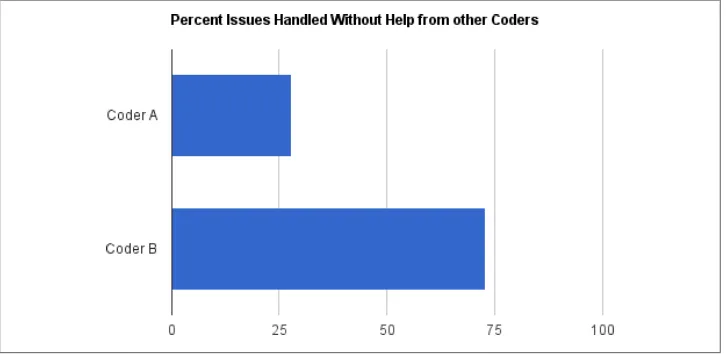
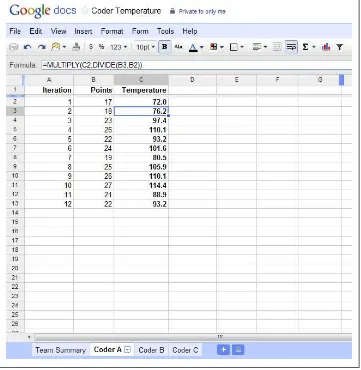
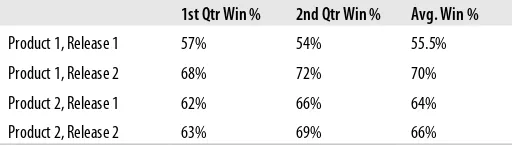
The new coders who joined the team were not measurably different from those who left in terms of education, experience, or aptitude. Where they were different, however, were in two key skill areas that became highly critical and useful following our first product release: the desire and willingness to solve problems independently and the ability to handle somewhat stressful situations calmly, even happily. Figure 1-2 shows how one replacement outperformed their predecessor.
Figure 1-2. A comparison of Coder A to their replacement Coder B shows an important factor in team success
Because the new coders possessed the right skills, they were able to take on and finish more problems themselves. It wasn’t necessarily that we were putting less time into support or fixing specific issues, but we were able to get less people involved and have less interruptions, so that other team members were able to stay focused on other work. In the end, we got lucky. Since we had some personality conflicts with the two coders who left, we consciously favored and selected job candidates who had very different personalities. But we didn’t realize the full benefits this would bring to our overall productivity and team success.
outsiders for all the good things they’ve done. It is easy for a team to develop a false sense of complacency—or in the reverse case, to develop poor morale when they don’t get the praise they feel they deserve. Looking at a full range of product and team metrics can balance the adulation or criticism you receive, and provide much-needed perspec-tive around where you’re really at and what needs to be done. Measuring and discussing skills such as self-reliance and thoroughness can help foster those skills, and help ensure that coders with those skills receive the credit and recognition they deserve for their contributions to the team.
The objective of this book is to present a method and a set of metrics—that is, coder-metrics—that cover a variety of areas related to individual coders and software devel-opment teams. This method is designed to challenge our assumptions, in hopes that we can better discover what is knowable about the patterns that lead to success. To make them easier to understand and remember, the metrics in this book are named after analogous sports statistics. These metrics are designed to give us some terminology to better communicate, and hopefully to make us think generally about how these types of metrics can be useful in our field. In the end, their value can be measured by how well they help us answer the key questions that we face as to what it means to “win” and how we can better ourselves and our teams.
It is my hope that the concepts in this book will lead to further productive dialog be-tween coders, team leaders, and managers, both within and across organizations. There is no doubt that many individual metrics introduced here can and will be improved; and that some of the ideas here will be dismissed, and even better metrics will be found. Personally, I have seen great value within teams in working to define a wider variety of items to measure, in figuring out how to measure and relate individual and team ac-tivities to organization goals, and then in sharing the data and discussing it among the team. Even for those of you who never actively use metrics, I hope that you can find value here and that some of the ideas in this book will positively affect how you think about coders and software development teams. If others begin to consider these con-cepts and perhaps use some of the approaches outlined in this book, working towards a broader and deeper rational analysis of coder contributions and software team-building, then I will feel this book is a success.
CHAPTER 2
Measuring What Coders Do
Never mistake activity for achievement.
—John Wooden, UCLA men’s basketball coach, 1946–1975 What are metrics about? How can they help? How are they used elsewhere and how might they be applicable to coders and software development teams?
This chapter begins to explore the general purpose of metrics, and the qualities that make certain metrics relevant and useful, and others not. I will discuss various patterns and noteworthy information that metrics can help you identify and understand. I’ll also look at various types of data you can use, along with ways you can gather the data and ensure that it is as accurate and consistent as possible. The concepts covered here pro-vide a basic introduction to the key concepts of metrics and will serve as a basis for further discussions through the remainder of this book.
The Purpose of Metrics
There are three reasons to gather and use metrics. Of course there may be more reasons too, but in this book I will focus on three.
The first purpose of metrics is simply to help you track and understand what has hap-pened. The subjective observation of situations, while sometimes insightful, is often colored by personal biases and experiences. It is dominated by the details you notice and are attuned to, and it misses the things you don’t see or recognize.
Alternatively, if you look at a box score of key statistics from a game, you can tell a lot about what happened in the game, whether or not you attended. And if you look at a complete statistical breakdown, with full offensive and defensive statistics and details on all scoring, then provided that you know what the statistics mean you can tell a great deal about the game, the players’ contributions, and the key factors that went into winning or losing.
Statistics, or metrics, are the detailed documentation of what has occurred. They pro-vide a historical record that allows for a more “scientific,” empirical analysis of what players and teams have done, and why they’ve won or lost.
Metrics also preserve the past. Week by week, month by month, time inevitably colors and clouds what you remember and what you think was significant. The more statistical data you have, the less you are likely to forget or distort the past. For example, when I was young my dad took me to many UCLA basketball games. I remember that Brad Holland was one of my favorite players in the late 1970s, and a great scorer, but I can’t remember specific details. If I go to a book or website with player statistics, however, many details come flooding back. The same forgetting can occur for things that hap-pened last year as for those that occurred 30 years ago. Having a statistical record allows us to review and in some sense relive what happened, and balances our selective memories.
The second purpose of metrics is to help people communicate about what has hap-pened. The metrics themselves become part of the terminology, allowing a group of people to discuss situations with some level of confidence that they are talking about the same thing. Defining and naming metrics forces you to clarify the language that you use to communicate. Without such definition and clear terminology, you are more apt to have misunderstandings or, more typically, you may fail to discuss certain issues that might in fact matter a lot.
In baseball, for example, a well-known pitching statistic is Earned Run Average (ERA). The “earned run” refers to a run for the opposing team that did not result from an error, and ERA represents the average number of earned runs a pitcher gives up for every 9 innings pitched (meaning for every complete game). That’s a lot to understand and describe. But if you just say that “the pitcher’s ERA is 4.29”, then for someone familiar with baseball, you have quickly and concisely conveyed a rich set of information. The third purpose of metrics is to help people focus on what they need to improve. Metrics document what you have done and accomplished, and that gives you a point of comparison to what you hope to do and achieve. Without points of reference, it’s very difficult to know where you stand, how far you might have to go, and whether you’ve arrived.
are important factors to success in their sport. They also have years of data to show the range of speed and strength that is required for different positions such as cornerbacks, linebackers, running backs, and linemen. Taking measurements to show where they stand allows players to focus on what they most need to improve.
Metrics Are Not Grades
In grammar school, high school, and college, you receive grades for your work. Grades are supposed to reflect your mastery of a subject and your relative ranking to others in the class. They may be strictly correlated to your performance on objective tests, al-though in most cases either the tests or some other element of the grade involves sub-jective evaluation by the instructor. In your earlier years, grades provide feedback to help identify the need for improvement, but in your later years the grades become increasingly competitive, with ranking and rewards. For reasons both institutional and traditional, for better or worse, the school system is not only responsible for teaching students, but also for ranking them.
If you are going to embrace metrics, it is important to establish and understand that metrics are not grades. Metrics measure specific individual skills and contributions, and as I will examine in this book, there is often no fixed scale of what is “good” or “bad.” Successful teams can and will have many individuals whose personal metrics vary widely. It’s similar to a football team, where linemen are slower than running backs, and great cornerbacks often have less tackles or passes defended because quar-terbacks don’t throw towards them.
The purpose of metrics, as discussed above, is to provide a clearer picture of what happened, to improve communication, and to help you identify and develop useful skills. Later in this chapter and in this book I will explore how metrics may come into play in recruiting, performance reviews, and other aspects of team management. How-ever, in all cases this will only work if the metrics are not seen or used as grades, but as a fair reflection of each coder’s current skills, strengths, and weaknesses.
Team Dynamics
As James Surowiecki points out in his book The Wisdom of Crowds, people mainly expect there to be a true and equitable relationship between accomplishments and rewards. Most people don’t expect to be rewarded equally for unequal accomplish-ments, and in fact most people are content when the reward system is seen as fairest and most in line with their relative contributions. In the sense that metrics provide greater detail and more accuracy in understanding people’s relative skills and contri-butions (and this can help you make sure that people are fairly compensated), the use of metrics can therefore result in increased satisfaction among individuals and teams. People just want to be treated and recognized fairly—ask yourself whether fairness is even possible without a rational, metrics-based approach.
In professional sports, players statistics are scrutinized endlessly, and their annual sal-aries are generally known to the public as well. For leading players, their personal contract negotiations are closely followed and discussed in the media. But while some negotiations are stickier than others, in the end both the players and teams typically seek contracts that are “fair” and in line with their industry standard and other players of similar skills. Many sports contract disputes are now settled in arbitration where an independent party determines the fair salary through a comparison process. Player statistics play a large role in arbitration.
Jed Lowrie, a utility infielder for the Boston Red Sox, does not expect to be paid the same as second-baseman Dustin Pedroia, who is one of the team’s proven stars. While we can assume Lowrie would be happy to receive more money, we also believe he and other players like him are satisfied as long as they feel that their compensation is fair. And, of course, they are still very important to the team’s success. If anything, the use of statistics in salary negotiations makes the process more fair, so that players no longer feel mistreated in the way they did in the past when someone like Dodgers GM Buzzie Bavasi just told Sandy Koufax how much money he would make despite how well he performed, and that was that.
In software development you don’t typically make salaries public, and you certainly don’t have reporters following your salary negotiations. Even if you did, you can assume not all team members would expect the same salary. But you can also assume that everyone would want the system to be as fair and objective as possible.
Connecting Activities to Goals
Coders are players on a software team that itself is part of a bigger team, namely the business or the organization. At least some of the goals of the organization are also the goals of the software team (and therefore the goals of the coders too). The most mean-ingful and useful metrics will allow you to connect and relate coders and teams to their organizational goals.
To do this, you must define those organizational goals that the software team shares and how those goals can be exactly or approximately measured. Then you need to determine the coder and team skills that can be measured, and finally, you must create models or metrics that relate the skills to the goals.
You could say that sports teams have one clear goal, to win games (and in the end, to win championships). They might have other goals, like making money, but clearly winning games is one key goal, and it’s easy to measure and track. The trick is deter-mining which player and team skills are most relevant to winning games. This can only be done by gathering individual statistics and then analyzing the historical record in light of past wins and losses. From there, team managers can spot trends that reveal key insights—for example, that bases on balls are more critical to winning than stolen bases.
The evaluation of the historical record and how the bottom-up metrics connect to the top-down goals is an ongoing process. New insights are discovered over time, and findings evolve as your understanding grows and circumstances change.
Good Metrics Shed a Light
While metrics will not tell you which skills are good or bad, individual metrics them-selves can definitely be good or bad. Bad metrics waste your time with details that aren’t useful or don’t really matter, distracting you from deeper understanding. Good metrics help you pull back the curtain and shed a light on things that matter, particularly things you might have missed, forgotten, or otherwise failed to fully appreciate over time. The problem is that you can’t always tell good metrics from bad until you try to use them. Metrics can turn out to be bad if they are either too hard to gather, or too abstract and confusing. To evaluate whether a metric itself is good or bad, you can ask yourself the following questions:
• Is the metric relatively easy to describe and understand? • Can the metric show me something I don’t already know? • Does the metric clearly relate to a goal I care about?
Individuals and teams will naturally choose the metrics that make the most sense to them and that provide them the most value. Over time there’s no need to hang on to less meaningful, less useful metrics if better ones exist or can be found. You want de-scriptive metrics and metrics covering a wider variety of skills, but too many metrics are just confusing and impractical.
Literally hundreds of statistics have been devised to track all kinds of details on baseball players, including such creatively named gems like Vultured Runs, Ghost Runs, the Component ERA (CERA), and the Defense-Independent Component ERA (DICE). No one regularly uses or understands all of these. Maybe at one time someone thought each of these metrics might be good, but over time some of them have proven to be useless. Each analyst and each team, through a process of trial and error, examines the statistics that are most meaningful for specific player positions and situations, and the good metrics remain in use.
Good metrics do more than track activity. The quote at the beginning of this chapter from John Wooden notes that activity does not equal achievement. Good metrics can be directly related to achievement or outcomes. Tracking how many hours someone worked, for example, is not a useful metric by itself. In basketball, no one keeps sta-tistics on how many times someone dribbles the ball because to do so would just track activity that isn’t related to the outcome of games. But people do keep track when someone loses the ball dribbling (a turnover), since change of possession can be critical to winning or losing games.
In baseball, Saves and Blown Saves are two examples of good stats. When a relief pitcher enters a close game that their team is leading, if they successfully preserve the lead then they are credited with a Save. If they lose the lead then it is a Blown Save. These stats meet the criteria for good metrics presented above: namely, they are relatively easy to understand, they show us something that we otherwise wouldn’t easily track, and they relate directly to key goals for players and teams (wins and losses).
You could imagine a metric similar to baseball saves, but for coders. A coder could get credit for fixing critical issues at the late stages of a project or after release. Having such a metric would allow you to track these special “saves,” which in turn allows you to communicate with each other about it, discuss its value, and possibly identify when the team has missed opportunities for “saves.” You could make sure that a coder with many “saves” is properly recognized and appreciated. Finally, as you begin to under-stand the metrics on good teams, you might begin to identify if your software team is lacking “saves” and needs to improve focus or skills in this area.
Examining Assumptions
pos-may help you find hidden truths. You can gather and use metrics to challenge your assumptions, and if that only ends up proving your assumptions that’s helpful too, because then you really know.
In American football for almost 100 years, it was an accepted coaching philosophy that if your team failed to gain a first down (advancing the ball 10 yards) after three plays, and you were too far away to kick a field goal, then you should punt the ball. That way, if the punt is successful, you back the other team up. If you try to convert the first down and you fail, you would give the other team the ball in a better position to score, so the punt seemed to be the safer approach.
But about 10 years ago, a group of statisticians began to analyze data on fourth-down conversions, punts, and the likelihood of scoring when you have the ball on first-down from different positions on the field. What they determined is that, statistically speak-ing, if a team has short yardage remaining and they have the ball around mid-field, their likelihood to convert on fourth down combined with the resulting opportunity to score makes it a superior choice to go for it on fourth down instead of punting. Open-minded coaches such as the New England Patriots’ Bill Belichick began to put this thinking into effect, and now it has become pretty standard for teams to try and convert fourth down in certain situations, because it directly increases their chance to win. If someone had not taken the time to examine the assumption that punting was the best choice, based on data gathered from previous outcomes, this old-school philosophy might never have changed.
How many assumptions do you have about what it takes to deliver successful software that might similarly turn out to be wrong? As an example, here are some statements about coders and software development that you might consider:
• Adding development time will increase quality and customer satisfaction. • Larger teams are less efficient.
• Difficult tasks will be done better by more experienced coders.
Timeout for an Example: The Magic Triangle (Partially)
Debunked
A lesson from one set of projects provides a thought-provoking example of how metrics can challenge your assumptions. This example involves a team that worked on a rapid product schedule, typical for an early stage start-up, meaning that we were delivering quarterly releases with new features, enhancements, and bug fixes. There were ten coders working on the project.
I had an assumption about the contents of each release. Looking back, I’m not really sure where or when I arrived at the assumption. I guess it just seemed like common sense, but it’s one of those oft-repeated assumptions that you come to believe is based on objective fact and experience, when really it is based on something someone told you.
Given the hard deadlines, I assumed that the more we tried to cram complex features in the release, the less quality we would get. Following this logic, I believed that a quarterly release with more complex features would also have more bugs. My belief was based on a concept that you probably have heard of, the software development “magic triangle.” This adage says that, among the three choices of more features, tighter schedule, and higher quality, you can pick two and the other one has to give. Since we were already committed to a tight schedule with many features, I assumed if we added more features, then lower quality would result. Makes sense, right?
To measure the contents of each release, I rated every coder task (feature, enhancement, or bug fix) on a scale from 1 to 4, from easiest to most complex. The average complexity of a release was determined by the average complexity of the tasks, and the total amount of work was calculated as the sum of all the task complexities. To measure the quality problems of each release, I ranked all the bugs found post-release on the same scale, and performed similar calculations.
Table 2-1. Quality on the most complex releases was better than other releases
Release 3 1.5 274 109 60%
Release 4 2.8 318 69 78%
Release 5 2.4 347 88 75%
Release 6 1.4 261 92 65%
How could that be? First, it should be noted that although we packed more into certain releases, we did plan carefully and did began each release believing we had at least a chance to get all the work done. The releases with more complexity, however, had schedules that were much tighter, with more risk and much less room for error. The second thing to note is that we had an excellent team that worked together very well. The final note is that we did not allow any meaningful feature creep in any of these releases, since we were already working on a tight schedule, so the team knew the complexity target at the beginning of each release.
One explanation would be that our planning was too conservative, so we actually had room to deliver more complexity in the releases. Maybe what we thought was a stretch really wasn’t. But that wouldn’t explain why the quality of the more complex releases was higher. If our less complex releases were too conservatively planned, the quality on those should have been even higher, not lower.
You could theorize other potential explanations. For example, perhaps the quality of certain areas was just improving over time. Suffice to say that there are multiple po-tential explanations, and that more data could be gathered and studied to prove or disprove them. My personal theory, however, based on my intimate working knowl-edge of the team, is that there is another more interesting story here.
Here’s what I believe the data illustrates. Good teams like to be challenged, and when challenged they rise to the occasion. If you give them more to do, if you set the bar higher, they get more focused, more motivated, and they actually do better work. So it is possible to add more work and more complexity to a release with a tight schedule and not give way on quality. In fact, you may even gain quality if your team reacts well under pressure and is well motivated. The concept of the magic triangle does not con-sider this aspect of human behavior. In some sense I think this is reflective of many false assumptions we have in our planning methods, where we base plans and schedules on the belief that coders produce a consistent level of quality all the time.
Because of what I learned, I am no longer quick to dismiss the idea that adding more complexity to an already difficult release—maybe even stretching a team’s previous limits—could be a good thing.
Patterns, Anomalies, and Outliers
The longer you gather and keep metrics, generally speaking, the more useful they become. Analyzing metrics is a process of pattern recognition, which means finding repetitive patterns that provide insight. While a single set of metrics taken from a single time period might reveal interesting information, and possibly allow you to form in-teresting hypotheses, it takes multiple metrics over multiple periods of time to improve your theories, or to convert your theories to knowledge.
While you are looking for patterns, it is important to realize that not all patterns are simplistic. You should be careful to not just focus on the obvious, because the patterns and explanations found in combinations of metrics may far exceed the power and use-fulness of individual metrics. For this reason again, it is useful to have metrics gathered at discrete intervals over longer periods of time, and to have a good variety of metrics to examine together.
Although voluminous, for thought-provoking material on complex pattern recognition and the richness of patterns, it is worth reviewing Stephen Wolfram’s A New Kind of Science. His studies focus on computer models and the natural world, but his point that what appears chaotic or extremely complex may actually be based on discoverable patterns is directly applicable to statistical analysis in any field.
In baseball, one of the most widely used and powerful statistics is OPS, which stands for On Base Percentage plus Slugging Percentage. After decades of close examination by hundreds of statisticians, this formula is now considered one of the best at identifying a batter’s effectiveness and overall value to the offense of a team. OPS is more descriptive than just looking at single statistics such as Home Runs (HR) or Runs Batted In (RBI). Without going into all the details here, suffice to say that the complex formula [OPS = AB(H + BB + HBP) + TB(AB + BB + SF + HBP) / AB(AB + BB + SF + HBP)] was only discovered through a process of complex pattern analysis, utilizing years and years of data.
norm that might recur over time, perhaps even following some “predictable” pattern. Here are definitions:
anomaly (noun): an incongruity or inconsistency, a deviation from the norm
outlier (noun): a person or thing that lies outside, a point widely separated from the main cluster
In his noteworthy book The Black Swan, Nassim Nicholas Taleb explores the power of outliers, as does Malcolm Gladwell in his book Outliers. In both cases, the authors introduce examples where outliers play a significant role in large successes. In
Outliers, we see, however, that when studied more closely there are often explainable patterns behind these seeming exceptional successes. And in The Black Swan, we see that outliers can be viewed as a probable occurrence in complex systems. One fact is clear: to overlook outliers is to limit our understanding about the patterns of success. The first thing we should do when we see particularly unexpected or unusual results is try to determine whether it is an anomaly or an outlier. For example, if a sudden drop-off in Coder A’s results is attributable to the fact that the coder had personal problems during the measured period, then this can be seen as an anomaly. A rule of thumb to approach this is:
• If there is a clear explanation for a one-time occurrence, the result is an anomaly. • If there is no clear explanation for what appears to be a one-time occurrence, the result is an outlier and should be examined more closely and watched over time to determine if it is meaningful or part of a pattern.
From 1993 through 2007, Ivan Rodriguez was a remarkably consistent catcher in Major League Baseball. Signed as a 16-year-old phenom in 1988, he was eventually voted to the All-Star team 14 times. The dips in his statistics over that period can mostly be explained by injuries or being on worse teams (which affected Rodriguez’s opportuni-ties and, therefore, his stats), so these were anomalies.
Mike Piazza was the other great catcher during the same period, with 12 All-Star ap-pearances and similarly consistent statistics. Both Rodriguez and Piazza will undoubt-edly end up in the Baseball Hall of Fame. However, Piazza was also noteworthy in baseball history because he was the 1,390th player drafted in 1988 when the Los Angeles Dodgers picked him in the 62nd round. He was overlooked because he did not fit the pattern that baseball scouts looked for. Although he broke school hitting records in high school, he had an unremarkable college career. He didn’t have the physical appearance of a star, not like Ivan Rodriguez, and his name and ethnic background were unusual for baseball at the time. The bottom line is that these superficial analyses of what makes a great ballplayer were dead wrong. This nearly undrafted player is now a sure Hall-of-Famer and the top home run hitter among catchers all time.
doesn’t fit your expectations or the pattern of great coders you’ve seen before? Do you have objective methods you use to help you understand what skills your team really needs, and to find those coders who can meet or exceed those needs, even though they might not have the background or appearance you typically expect? Metrics are not the entire answer here, but they certainly can be part of the answer.
You tend to see what you are looking for, biased by what you believe and what you think you know. As so many success stories show, surprises that “break the mold,” that almost no one predicted, happen regularly enough to show that such stories will continue to happen time and time again. When these surprises occur, they provide a chance to learn, and maybe to discover that they really weren’t surprises at all. If you had just known more or had a deeper understanding about the patterns of success, then you might have predicted the result and it wouldn’t have been a surprise.
Outliers are the surprises and unexpected results in the data. As you gather metrics and analyze patterns, it behooves you to study outliers carefully.
Peaks and Valleys
As metrics allow you to spot patterns over time, they also reveal peaks and valleys. Like outliers, these can be extremely significant and therefore are worth examining. Sometimes the high points and low points in any particular time range are merely part of the normal variance in activity and achievement, but sometimes they can reveal useful insights. The “local maximum” and “local minimum” values are worth studying to see if they can be explained.
A baseball player who is an average hitter may have one great game every few weeks or every month, and conversely a baseball player who is a great hitter will still have bad games. In many cases, this is just part of the normal ebb and flow in performance and outcomes. But, in some cases, there could be an explanation. Maybe the hitter does particularly well or poorly against a specific pitcher, for example, or in a specific ball-park. If the hitter’s surges or dips in performance are dismissed and not studied, then the instances where explanatory reasons exist will be missed.
When particularly high or low metric values are seen, you should track and examine them, and look for patterns that emerge over time. You are hoping to find the reasons and the causes behind the higher or lower results. Discovering these explanations, ei-ther for individuals or for teams, might help you adjust circumstances to improve the results as you like.
And if a player is having a cold streak, teams try to change the player’s circumstances, possibly with a new assignment or even a few days off, in order to shake the slump. In software development, isn’t it possible that coders have hot streaks and cold streaks, too? If you could spot these more sustained highs and lows, then just like sports teams you might take further advantage of hot streaks or look for ways to shake slumps.
Ripple Effects
Another important pattern that metrics can help you identify is the impact or influence that one person has on other members of the team. A great coder, for example, can “rub off” on others, or may help others more rapidly advance their own skills. These kind of ripple effect patterns are among the hardest to identify and confirm, but when found, can be among the most valuable. The positive or negative effects of individuals on teams are the factors that make a team either greater or less than the sum of its parts. A related pattern you can examine and that is equally important is the result of specific people working together. In this case you are not looking so much at the impact one individual has on others, but whether specific combinations of people are more or less effective. The obvious intention here is to identify relationships that demonstrably flourish or flounder, so you can use that information to successfully align your teams. Basketball and hockey statisticians over the past decade have put much time and effort into analyzing the results when specific players are in the game or out, and the results of specific combinations of players together. The analysis focuses on the team results, offensively and defensively, during the game and at specific points in a game, such as in a basketball game during the all-important final four minutes known as “crunch time.” These statistics are considered very important both in analyzing player effec-tiveness but also in making coaching decisions related to who should play together at specific times.
It’s likely that in any human endeavor involving teams, there are ripple effects related to the specific impact of individuals or combinations of people. And the effects may not be what individuals themselves believe, since their judgment is most times biased by personality traits, meaning with whom they feel most compatible and whom they don’t. But sometimes the most effective combinations of people are not necessarily the ones who like each other the most.
Repeatable Success
While metrics can increase your understanding and provide benefits in many ways, among the top things you are searching for are the patterns of repeatable success. If found, these patterns indicate what your team needs to maximize its chance of success and minimize its chance of failure.
An oft heard quote is that “it’s better to be lucky than good.” In the short term, that might be true. But luck is not some innate factor that remains consistent (although many gamblers wish it was). Highly skilled individuals or teams might appear to be lucky, but it’s their hard work and planning that makes them a consistent success. Someone might get a “lucky break” or go on a “lucky streak.” But over time, luck of this sort evens out—which is to say that over a longer period of time, an individual or team (in any area involving skill and teamwork) will normally achieve the level of suc-cess it deserves.
In sports, you see many instances where players or teams have one-time or short-term success, but that success doesn’t last over the long term. Many teams might have a week or two (or even a month) where they get “hot” and go on a winning streak. But over the course of a season, if those teams don’t really have the elements to win consistently, the hot streaks don’t last and are often offset by “cold” streaks. You also see players whose isolated results benefit from circumstances. A baseball pitcher can win a game when they pitch badly, if their own team scores a lot of runs to win. Should the pitcher get credit for the win? In baseball they do, which is why wins and losses are not a great measurement of a pitcher’s skills or value to their team, and are not a great indicator of repeatable success.
In software, the way you define and measure success needs careful thought. Sometimes, for example, the software team might succeed but the business fails, or the other way around. Success or failure of the business is not necessarily reflective of a software development team. I will discuss this in much more detail later.
Once you have defined success, then the software teams that achieve a consistent level of such success become models you can analyze. You can also analyze those teams that achieve success for a period of time, but aren’t able to maintain that level. Finally, there are teams that never achieve success, and you should look at those, too. Examining all the cases you are exposed to, you can begin to identify the factors and patterns of success, and better understand all the skills and contributions that make for successful teams.
As a simple example, you might see that on more successful projects, your teams had many coders who helped each other—and on less successful projects, your coders interacted less. If this was true, it would be very useful for everyone on the team to understand, in order to improve projects in the future. Metrics are the means to help you identify such patterns and to communicate your findings to others.
Understanding the Limits
The use of metrics and statistical analysis is a practice, a methodology, useful to find patterns, examine assumptions, and increase understanding of the past in hopes that you can improve the future. It is not a science, and clearly the explanatory capability of metrics is abstract and imperfect. Practically speaking, the metrics you gather will never provide a complete picture of all that coders do, or of the complex team dynamics and all the elements that lead to success.
While baseball’s WHIP statistic (walks plus hits per inning pitched) may help identify what makes pitchers effective, it cannot fully describe what made Sandy Koufax unique and special. No stats can fully measure his ability to focus and his desire to compete. And while victories and team stats are clear indicators of winning teams, those and individual stats cannot fully explain why the 1975 Cincinnati Reds stand out in fans’ minds as the greatest team of their era—because of their personalities and charisma. This shouldn’t discourage you or make you believe that metrics aren’t useful, simply because there is so much they don’t capture. Instead you should be encouraged to use metrics for what they can provide, while accepting their limitations. You can continue on in the pursuit of better metrics in the happy knowledge that perfect understanding will never be achieved, and there will always be more you can measure and learn.
Timeout for an Example: An Unexpected Factor in Success
Here is a story about a surprising metric that I’ve come to believe indicates a greater likelihood of success for coders and software teams. This example involves a software development team working inside a large organization, with about 500 total employees of this company located on a single floor, in an open floor plan mostly made up of cubicles.I have always been a big believer in the “closed door” policy. That is to say that I have been an advocate of coders getting extended “quiet” time, without interruptions, so they can remain focused once they get in the flow of their work. For this reason, I am always very careful to avoid lots of meetings in the middle of the day, and, personally, I try not to interrupt coders when they are working. I don’t like to be interrupted myself. My theory used to be that an increase in uninterrupted work time would translate to an increase in productivity and high-quality results.
This is just something I happened to notice, not something I was looking to find. As I said, I was already biased. If I had my preference, every coder would sit in an office and could close their door. As it was, in this company everyone was in a cubicle, and was subject to random walk-by interruptions any minute of the day.
In the middle of one of our release cycles, while the coders were working hard on product enhancements and new features, a few team members began to complain to me that they were being interrupted too much. Support people were asking them about issues, sales engineers were asking about how new features worked, and product man-agers and product marketers were asking for answers to questions from customers, analysts, and the press. I was getting many of these interruptions, too, so I knew what they were talking about. Part of it was a direct output of our product’s success, but that didn’t make it seem less aggravating or counterproductive. Based on the complaints, I started thinking about what we could do. Maybe we could come in one weekend with bricks and cement and just build a big wall.
But then, as time went on, I noticed something else. The coders who were getting interrupted the most, and were complaining, were producing great software: new fea-tures, key improvements, and bug fixes. They were proactively tackling stuff that had sat dormant for a long time before, and there was a noticeable increase in innovation. These were some of our top team members, which was why they were getting inter-rupted more than other coders. But even though they were complaining, their work wasn’t really suffering. Their work, in fact, was better than ever before.
I realized that even though the increased interruptions were annoying the coders, they were actually helping them. It was causing them to think more about the real customer problems, to learn more about what people were interested in, and it made them more sensitive to quality and craftsmanship. The frequent interactions with others outside the development team was healthy and educational. Following interruptions, it would take time to return to the flow of coding, but they might know something that they didn’t before. The result was better software and more innovative solutions. Since that time, once I started looking for it, I have seen this pattern over and over again. I used to think that interruptions were a bad thing, and I tried to shield myself and coders during times of work. Today I still avoid meetings in the middle of the day. But now I actually include “interruptions” as a key metric I like to track. I don’t do it to make sure the coders aren’t getting too many interruptions. I do it to make sure they are getting interrupted enough. Now I want coders to be interrupted. I want them to interact spontaneously with people outside the development team. For coders who are not getting interrupted, once they have sufficient experience, I try to get them in the flow of the interruptions as well. I now prefer departments to be co-located, with open floor plans and open doors.
But perhaps if they receive emails or calls from people inside and outside the software development team, and they deal with those, the interruptions might have the same effect as in-person. In my metrics, I track email and phone call interruptions the same as in-person, but all the coders I’ve worked with are normally co-located, so I don’t have good data on remote workers. What I can say is that I believe email and phone interruptions appear to have much the same effect as in-person for coders who work together in an office, so I believe they would have the same effect for coders working remote.
Having a metric for interruptions helps us track the effects, but also it creates a means to communicate with coders about the value of these interactions. It may not make the moment of interruption less aggravating, but when you understand how interruptions can positively educate team members and positively influence the software, they are easier to put up with.
Useful Data
Later chapters of this book will cover a variety of specific codermetrics. Some of these will be fairly simple, based on atomic data elements such as production bugs, and some will be more complex, based on formulas leveraging and combining multiple elements of data.
Before I delve into specific metrics, however, you might consider all the types of data you could use for coders, and think about the data that might be useful or not. You want to think broadly and contemplate new and interesting data elements that could make for more meaningful metrics. You can also think about how to identify data that would measure how coders and software teams are doing relative to team and organi-zation goals.
Below is a list of example data that I have found to be useful and that will be discussed more in later sections. This list is just meant to be illustrative and, as such, describes the type or category of information, not the specific numeric data (such as counts or averages) that will be discussed later:
• How long a coder has been part of a team • Size, growth, and contraction of a team
• Tasks completed by a coder, categorized by complexity
• Tasks where coders worked together, or where one coder helped another • Tasks that had extreme urgency, such as fixing severe production issues
• Tasks where a coder demonstrated exceptional creativity, innovation, or initiative • Tasks that were delayed, failed, or cancelled