© IDOSI Publications, 2013
DOI: 10.5829/idosi.gv.2013.11.5.8132
Corresponding Author: I. Ketut Puja, Faculty of Veterinary Medicine,
Correlation Analysis of Microsatellite DNA Markers with
Body Size, Lenght and Height of Bali Cattle
I. Ketut Puja, I. Nengah Wandia, I. Nyoman Sulabda and dan Putu Suastika
1 1 2 1
Departement of Veterinary Anatomy, 1
Departemen of Veterinary Physiology, 2
Faculty of Veterinary Medicine, Udayana University, Bali Indonesia
Abstract: Forty one Bali cattle and 3 microsatellite DNA markers(BMS1248, ILSTS066 and IGF-1) were used to study the population genetic variation Bali cattle and the relationships between the gene loci and their body size, lenght and height traits.A GLM procedure was used to analyze the effects of these 3 microsatellites on body weight, length and height. The results showed that a total of 10 different alleles were found and the number of alleles in each locus was 2 to 6. The DNA fragment length for BMS1248 loci, ILSTS066 and IGF-1 were 120-180bp, 120-170 bp and 210-230 bp respectively.Mean values for observed heterozygosity for ILSTS066, BMS1248 and IGF-1 were 0.927, 0,561 and 1 respectively. The PIC value at the BMS1248 loci demonstratedhigh polymorphism in this population with PICvalues 0.6090. The microsatellite loci BMS1248 had a positive correlation with body weight and body lenght. While for ILSTS066 and IGF-1 loci had a negative correlation with body weight, length and height.
Key words: Microsatellite Body size Body height Body lenght Bali cattle
INTRODUCTION diversity allows us to analyze and evaluate in detail and Traditionally, the selection of calves superior to value [4,5].
the properties that have high economic value based on Until now, microsatellites are used to map genetic loci individual performance. Since the 1990s the availability that influence the trait plays a role in animal production of molecular biology techniques has resulted in a [6,7] and is a prerequisite for the identification of new way in the selection of a number of economically candidate genes responsible for a particular trait. important genetic traits. Selection is initially done Microsatellite markers can be used to identify genetic conventionally now have switched to selection based variation at each locus genes and chromosomal regions on the identification of genes that may affect the nature containing QTL important role in the expression of of the economically valuable [1]. Selection is based on economically important traits in cattle [8,9,4]. Mizoshita genomic data provide an advantage in order to improve et al. [10] has been used microsatellite DNA markers the results of selection such as productivity, health for the detection of chromosomal segments containing and fertility [2]. Right now, the selection based on QTL that contribute to the growth and carcass genotype has become a very important tool in the composition in Japanese Black cattle.
QTL affecting growth and carcass [14-16]. In the standard protocol. The gel was visualized and addition,many gene located adjacent to the QTL was documented under a white light gel documentation also considered as a potential candidate genes that system.
contribute to growth.QTL on chromosome no. 5 in cattle
has been known to significantly affect the growth and Statistical Analysis: The exact allele sizes were body conformation.Information about the correlation determined by direct comparison with adjacent PCR bands between microsatelite DNA markers with body size, and 100 bp ladder (Invitrogen, USA). Allele frequencies height and lenght of Bali cattle had never been were estimated from the genotypes. The polymorphism shown. Therefore, the objectives of this research were to information content (PIC) was calculated using the evaluate polymorphism of microsatellite DNAand its individual frequencies in which the alleles occur at each possible association with body weight, height and locus. Allele frequencies, number of alleles and both lenght of Bali cattle, in order to use of marker-assisted observed (HO) and unbiased expected heterozygosities selection methods to improve breeding and to provide (HE)[17] and PIC were calculated using a basis for further progress to accelerate breeding in MICROSATELLITE TOOLKIT V. 3.1[18]. Association
Bali cattle. between genotypes of DNA microsatellite andbody
MATERIALS AND METHODS model (GLM)(SPSS 16.0).
Sample: The study was carried out on a total of RESULTS AND DISCUSSION 41 Bali cattle at breeding instalation Pulukan, Bali.
Blood samples (approximately 5 ml) was collected from In this study, polymorphisms in 41 individuals each animal via the jugular vein. All samples were belonging to Bali cattle breeds was analyzed using 3 stored in EDTA-coated vacutainer tubes (BD Vacutainer microsatellite loci (BMS1248, ILSTS066 and IGF-1). The Systems, Plymouth, UK). The samples were brought to three loci located on chromosome no.5. A total of 10 the laboratory in an ice box and stored at 4°C till further alleles were recorded in Bali cattle and the number of
processing. alleles in each locus was 2 to 6. The BMS1248 had 6
DNA Isolation and PCR Amplification: Genomic DNA ILSTS066 had 2 alleles with fragment lenght was 120-170 was isolated from peripheral blood lymphocytes by the bp and IGF-1 locus had 2 alleles with fragment lenght was DNAzol method (Invitrogen, Carlsbad, CA). The 3 210-230 bp (Table 2). The number of alleles at BMS1248 microsatellite loci related to some body size were selected loci and IGF-1 loci differed from reported by Machado et from chromosome no.5. Genomic DNA were amplified at al. [16] on Canchim beef cattle. The Canchim beef cattle the following 3 microsatellite loci BMS1824, ILSTS006 and had 4 alleles at BMS1248 and 4 alleles at IGF-1 loci. IGF-1 with Polymerase Chain Reaction. The primers PCR Polymorphism Information Content (PIC), expected shown in Table 1. PCR was performed in a 25 µl. A master heterozigosity and observed heterozigosity values for all mix for minimum of 10 samples was prepared and aliquated 3 microsatellite markers analyzed in Bali cattle breeds are 22 µl in each PCR tube. Three µl sample DNA was added shown in Table 2. PIC is a index to indicate the degree of in each tube to make the final volume. The amplified PCR gene variance [19]. The microsatellite locus indicate products were electrophoresed in 6% nondenaturing high polymorphism if PIC = 0.5. In this reasearch the polyacrylamide gel containing acrylamide and bis- PIC value at the BMS1248 loci demonstrated high acrylamideand stained with 0.1% silver nitrate following polymorphism in this population with PIC values 0.6090. weigh, lenght and height was calculated by general linear
alleles with the DNA fragment lenght was 120-180 bp. The
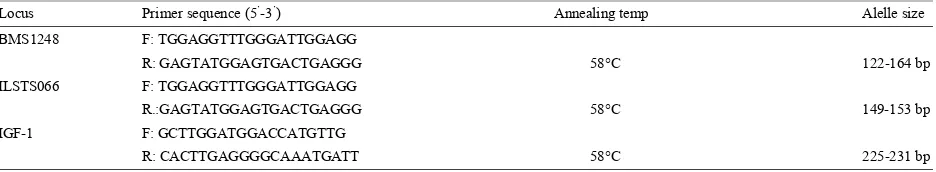
Table 1: Primer microsatellite BMS1248, ILSTS066 and IGF-1 locus
Locus Primer sequence (5 -3 )’ ’ Annealing temp Alelle size
BMS1248 F: TGGAGGTTTGGGATTGGAGG
R: GAGTATGGAGTGACTGAGGG 58°C 122-164 bp
ILSTS066 F: TGGAGGTTTGGGATTGGAGG
R.:GAGTATGGAGTGACTGAGGG 58°C 149-153 bp
IGF-1 F: GCTTGGATGGACCATGTTG
Table 2: Number of allele, size and frequency in Bali cattle
Locus Number of Allele Allele Size Allele Frequency
ILSTS066 2 150 53.66
170 46.34
BMS1248 6 120 1.22
130 8.54
140 3.66
1540 29.27
160 48.78
170 8.54
IGF-1 2 210 50.00
230 50.00
Tabel 3: Expected, observed heterozygositiesand PIC in Bali cattle
Locus Expected Heterozygosities Observed Heterozygosities PIC values
ILSTS066 0.503 0.927 0.3737
BMS1248 0.668 0.561 0.6090
IGF-1 0.506 1 0.375
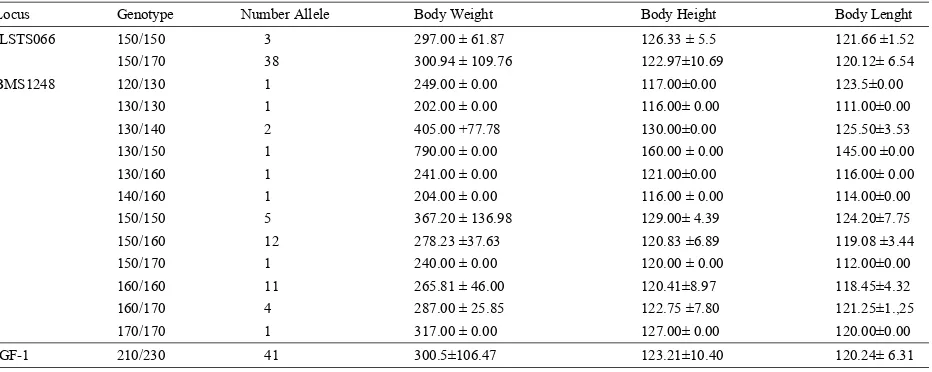
Table 4: Association between microsatellite genotype, in ILSTS066, BMS1248 and IGF-1 locus with body weight, height and lenght of Bali cattle
Locus Genotype Number Allele Body Weight Body Height Body Lenght
ILSTS066 150/150 3 297.00 ± 61.87 126.33 ± 5.5 121.66 ±1.52
150/170 38 300.94 ± 109.76 122.97±10.69 120.12± 6.54
BMS1248 120/130 1 249.00 ± 0.00 117.00±0.00 123.5±0.00
130/130 1 202.00 ± 0.00 116.00± 0.00 111.00±0.00
130/140 2 405.00 +77.78 130.00±0.00 125.50±3.53
130/150 1 790.00 ± 0.00 160.00 ± 0.00 145.00 ±0.00
130/160 1 241.00 ± 0.00 121.00±0.00 116.00± 0.00
140/160 1 204.00 ± 0.00 116.00 ± 0.00 114.00±0.00
150/150 5 367.20 ± 136.98 129.00± 4.39 124.20±7.75
150/160 12 278.23 ±37.63 120.83 ±6.89 119.08 ±3.44
150/170 1 240.00 ± 0.00 120.00 ± 0.00 112.00±0.00
160/160 11 265.81 ± 46.00 120.41±8.97 118.45±4.32
160/170 4 287.00 ± 25.85 122.75 ±7.80 121.25±1.,25
170/170 1 317.00 ± 0.00 127.00± 0.00 120.00±0.00
IGF-1 210/230 41 300.5±106.47 123.21±10.40 120.24± 6.31
This loci can be used to determine an imformative marker. and lenght showed that the cattle possessing genotype Mean values for observed heterozygosity for ILSTS066, of 130/150 on BMS1248 loci had the highest body weight, BMS1248 and IGF-1 were 0.927, 0.561 and 1 respectively height and lenght compared to other genotype with 790 (Table 3). Heterozygosities is generally used to evaluate kg, 160 cmand 145 cm, respectively. While the genotype genetic diversitywithin populations. The results of this 130/130 had lower body weight, height and lenght research indicated that microsatellite loci IGF-1 showed compared to other genotype with 202 kg, 116 cm and 111 greatest variability, the second was ILSTS066 and the cm,respectively. The results showed that for microsatellite lowest was BMS1248. The observed average loci BMS1248 had a positive correlation with body weight heterozygosities for ILSTS066 and IGF-1 were greater than and body lenght and for ILSTS066 and IGF-1 had negative those reported by Machadoet al. [16] for Canchim beef correlation with body size, height and lenght.
cattle, thus reflecting greater genetic variability in Bali
cattle compared to Canchim beef cattle. CONCLUSION
The correlation between the genotypes of DNA
body weight, height and lenght.While Bali cattle 7. Kühn, C., J. Bennewitz, N. Reinsch, N. Xu, possessingtypical genotypes of 130/130 in BMS1248 loci
had lowest body size, height and lenght. The microsatellite loci BMS1248 had a positive correlation with body weight and body lenght. While for ILSTS066 and IGF-1 loci had a negative correlation with body weight, length and height.
ACKNOWLEDGEMENT
This research was supported by grant from Udayana University, Bali Indonesia through PNBP research grant 2013, by contract number: 174.40/UN14.2/PNL.0/03. 00/2013. Special thanks to Drh.Ni wayan Patmawati,M.Si, Drh.Mahmud Siswanto,M.Si and. Drh Ni Nyoman Trinayani M.Si for technical assistance to prepare the sample.
REFERENCES
1. Oikonomou, G., K. Angelopoulou, G. Arsenos, D. Zygoyiannis and G. Banos, 2008. The effects of polymorphisms in the DGAT1, leptin and growth hormone receptor gene loci on body energy, blood metabolic and reproductive traits of Holstein cows.Animal Genetics, 40: 10-17.
2. Villumsen, T.M., L. Janss and M.S. Lund, 2009. The importance of haplotype length and heritability using genomic selection in dairy cattle. J. Anim. Breed, Genet., 126: 3-13.
3. Teneva, A., 2009. Molecular Markers In Animal Genome Analysis. Biotechnology in Animal Husbandry, 25(5-6): 1267-1284.
4. Erhardt, G. and C. Weimann, 2007. Use ofmolecular markers for evaluation of genetic diversity and in animal production. Arch. Latinoam. Prod. Anim., 15(Supl.1): 63-66.
5. Humblot, P., D. Le Bourhis, S. Fritz, J.J. Colleau, C. Gonzalez, G.G. Joly, A. Malafosse, T. Heyman, Y. Amigues, M. Tissier and C. Ponsart, 2010. Reproductive technologies and genomic selection in cattle.Vet. Med. Int. Article ID 192787.
6. Hiendleder, S., H. Thomsen, N. Reinsch, J. Bennewitz, B. Leyhe-Horn, C. Looft, N. Xu, I. Medjugorac, I. Russ, C. Kühn, G.A. Brockmann, J. Blümel, B. Brenig, F. Reinhardt, R. Reents, G. Averdunk, M. Schwerin, M. Förster, E. Kalm and G. Erhardt, 2003. Mapping of QTL for body conformation and behaviour in cattle. J. of Heredity, 94: 496-506.
H. Thomsen, C. Looft, C.A. Brockmann, M. Schwerin, C. Weimann, S. Hiendleder, G. Erhardt, I. Medjugorac, M. Förster, B. Brenig, F. Reinhardt, R. Reents, I. Russ, G. Averdunk, J. Blümel and E. Kalm, 2003. Quantitative trait loci mapping of functional traits in the German Holstein cattle population. J. Dairy Sci., 86: 360-368.
8. Schrooten, C., H. Bovenhuis, W. Coppieters and J.A.M. Van Arendonk, 2000. Whole genome scan to detect quantitative trait loci for conformation and functional traits in dairy cattle. J. Dairy Sci., 83: 795-806.
9. Tambasco, D.D., C.C. Paz, M. Tambasco-Studart, A.P. Pereira, M.M. Alencar, A.R. Freitas, L.L. Coutinho, I.U. Packer and L.C.A. Regitano, 2003. Candidate genes for growth traits in beef cattle crosses Bos taurus x Bos indicus. J. Anim. Breed. Genet., 120: 51-56.
10. Mizoshita, K., T. Watanabe, H. Hayashi, C. Kubota, H. Yamakuchi, J. Todoroki and Y. Sugimoto, 2004. Quantitative trait loci analysis for growth and carcass traits in a half-sib family of purebred Japanese Black (Wagyu) cattle. J. Anim. Sci., K. Oshima, Y. Mizoguchi and M. Komatsu, 2007. Detection and mapping of QTL on bovine chromosomes 2 and 5 segregating for live weight, average daily gain and body measurements in Japanese black cattle. Journal of Cell and Animal Biology, 1(3): 034-043.
13. Kim, J.J., F. Farnir and J.F. Taylor, 2003. Detection of quantitative trait loci forgrowth and beef carcass fatness traits in a cross between Bos taurus (Angus) and Bos indicus (Brahman) cattle. J. Anim. Sci., 81: 1933-1942.
15. Li, C., J. Basarab, W.M. Snelling, B. Benke, 17. Nei, M., 1987. Molecular Evolutionary Genetics. B. Murdoch and S.S. Moore, 2002. The identification Columbia University Press. New York.
of common haplotypes on bovine chromosome 5 18. Park, S.D.E., 2001. Trypanotolerance in west African within commercial lines of Bos taurus and their cattle and the population genetic effects of selection. associations with growth traits. J. Anim. Sci., PhD thesis, University of Dublin, Dublin.
80: 1187-1194. 19. Botstein, D., R.L. White, M. Skolnick and R.W.
16. Machado, M.B.B., M.M. Alencar, A.P. Pereira, Davis, 1980. Construction of a genetic linkage map in H.N. Oliveira, E. Casas, L.L. Coutinho and human using restrictionfragment length L.C.A. Regitano, 2003. QTL affecting body weight in polymorphisms. Am. J. Hum. Genet., 32: 314-331. a candidate region of cattle chromosome 5.Genetics