*Corresponding author:
E-mail: [email protected]
Available online at http://medpet.journal.ipb.ac.id/
Genetic Diversity of Bali Cattle Based on Microsatellite Marker in Indonesian
Breeding Centre
W. A. Septian, Jakaria*, & C. Sumantri
Department of Animal Production and Technology, Faculty of Animal Science, Bogor Agricultural University Jalan Agatis, Kampus IPB Darmaga, Bogor 16680, Indonesia
(Received 31-07-2014; Reviewed 05-09-2014; Accepted 22-12-2014)
ABSTRACT
Genetics characterization in livestock based on microsatellite has been widely implemented including for Bali cattle in three different breeding centres in Indonesia. This study aimed to determine diversity of Bali cattle microsatellites in three breeding centers namely BPTU Bali cattle in Bali, BPT-HMT Serading Sumbawa in West Nusa Tenggara, and Village Breeding Center in South Sulawesi. The number of animals used in this study was 95 head of cattle consisted of 32 heads from BPTU Bali Province, 32 heads from BPT-HMT Serading Sumbawa, and 31 heads from Village Barru Breeding Center Barru distric. Microsatellite loci used to determine the diversity was the locus SPS115, INRA037, MM12, and ETH185 based on flourescently labeled fragment method. Data analysis of microsatellite in Bali cattle at three different locations was performed by using POPGEN 1.2, Cervus, and POPTREE2 programs. The results showed that microsatellite diversity in Bali cattle detected 32 alleles from three different locations, and there were specific alleles at each location. Average values of observed heterozygosity (Ho) and expected heterozygosity (He) were 0.418 and 0.604 respectively, while the average value of polymorphism informative content (PIC) was 0.579. The Hardy-Weinberg equilibrium in general suggested that the loci used in the Bali cattle in three populations were in equilibrium, except INRA037 and ETH185. The genetic diversity between populations of Bali cattle was 0.033 (3%), while the inbreeding coefficient index in all populations was 0.296 (29.6 %). Bali cattle phylogeny tree with three populations showed that the populations of Bali cattle in BPTU Bali and VBC Barru had close genetic distance compared to the population of Bali cattle in BPT-HMT Serading Sumbawa. The results of this study provide information that the characteristics of Bali cattle breeding centers in three locations are different, so we need a directed breeding program in each population.
Key words: Bali cattle, genetics diversity, microsatellite
ABSTRAK
Karakterisasi genetik pada ternak berdasarkan mikrosatelit telah banyak diterapkan termasuk pada sapi Bali di tiga pusat pembibitan di Indonesia. Penelitian ini bertujuan untuk mengevaluasi keragaman mikrosatelit di tiga pusat peternakan BPTU Bali, BPT-HMT Serading Sumbawa di Nusa Tenggara Barat, dan Village Breeding Center Kabupaten Barru di Sulawesi Selatan. Jumlah ternak yang digunakan seba-nyak 95 ekor terdiri atas 32 ekor sapi dari BPTU Provinsi Bali, 32 ekor sapi bali dari BPT-HMT Serading Sumbawa, dan 31 ekor sapi Bali dari Village Breeding Center Kabupaten Barru. Lokus mikrosatelit yang digunakan dalam menentukan keragaman adalah SPS115, INRA037, MM12, dan ETH185 berdasarkan metode fragmen flourescently berlabel. Analisis data mikrosatelit pada sapi Bali di tiga lokasi yang ber-beda dilakukan menggunakan Program POPGEN1.2, Cervus, dan POPTREE2. Hasil penelitian menun -jukkan bahwa keragaman mikrosatelit pada sapi bali menemukan 32 alel dari tiga lokasi yang berbeda dan terdapat alel spesifik di setiap lokasi. Nilai rata-rata yang diamati meliputi nilai heterosigositas (Ho) dan heterozigositas yang diharapkan (He), masing-masing 0,418 dan 0,604, sedangkan nilai rata-rata
poly-morphism informative content (PIC) adalah 0,579. Keseimbangan Hardy-Weinberg menunjukkan bahwa lokus yang digunakan dalam sapi bali di tiga populasi berada dalam kesetimbangan, kecuali lokus INRA037 dan ETH185. Keragaman genetik antara populasi pada sapi Bali adalah 0,033 (3%), sedangkan laju inbreeding adalah 0,296 (29,6%). Pohon filogenetik di tiga populasi menunjukkan bahwa populasi sapi Bali di BPTU Bali dan VBC Barru memiliki jarak genetik yang dekat dibandingkan dengan populasi sapi Bali di BPT-HMT Serading Sumbawa. Hasil penelitian ini memberikan informasi bahwa karakter-istik pusat peternakan sapi bali di tiga pusat peternakan adalah berbeda, sehingga diperlukan program pemuliaan yang terarah di setiap populasi pusat pembibitan sapi bali.
INTRODUCTION
Indonesia has been known as a megabiodiver-sity country which have rich genetic resources includ-ing livestock diversity. Bali cattle is one of indigenous cattle and the domestic descendant of the wild banteng (Bos sondaicus). Population of Bali cattle in 2011 was 4.789.521 and spreaded out in some region in Indonesia (Directorate General of Livestok and Animal Health, 2011). Breeding location of Bali cattle in Indonesia is di-vided into two main breeding centres which are BPTU in Bali Province and BPT-HMT in Sumbawa. An additional breeding center is also provided as Village Breeding Centre (VBC) in South Sulawesi. Genetic information of Bali cattle in national breeding centres was needed to ar-range national breeding programmes and policy of Bali cattle.
Ecological characteristics and global or local en-vironment affect the natural populations of gene flow, whereas human activities have strong influence in cattle genetic change (Stofer et al., 2007; Berthouly et al., 2009). Unmanage crossing of Bali cattle and disorganize distribution of Bali cattle can threat genetic erotion and increasing breeding rate of those genetic resource. This genetic stochasticity or genetic changes can be caused by random genetic drift and high rate of inbreeding. Shaffer (1981) that genetic stochasticity is the genetic lost of some variablity of economic alleles and the increas-ing of disadvantage alleles. Genetic characterizations based on microsatellite were needed to prevent those effects in Bali cattle in breeding centres in Indonesia. Microsatellites for cattle are commonly used for the study of genetic diversity (Xuebin et al., 2005; Qi, 2004; Nguyen et al., 2005).
Microsatellite is an ideal marker because they are highly polymorphic, randomly spread out, co-dominant, and almost evenly distributed throughout the genome (Dani et al., 2008; Stevanovic et al., 2010; Guichoux et al., 2011). Another term of microsatellites are known as simple sequence repeats or short tandem repeats (Kelkar et al., 2010). Microsatellites markers are widely used for such purposes because they are easy to analyze, can identify genetic diversity between and within popula-tions, cheap, fast, and highly accurate (Radko et al., 2005; Kimberly & Robert, 2006; Xiaojuan et al., 2007).
Genetic diversities based on microsatellite marker in exotic cattle have been reported for Europe cattle (Canon et al., 2001), Chinese indigenous cattle (Zhang et al., 2007), Vietnam indigenous cattle (Pham et al., 2013)
and Indonesia (Handiwirawan et al., 2003; Maskur et al., 2007; Kusdiantoro et al., 2009; and Winaya et al., 2010). However, the sample number for Indonesian cattle in those previous research was very limited and the cattles were collected from local farmers. Therefore, the research in breeding center is needed to identify genetic diversity of Bali cattle as a strategic breeding program. The aim of this research is to implement microsatellite marker in Bali cattle population from three differ-ent breeding cdiffer-entre locations based on microsatellite marker.
MATERIALS AND METHODS
Sampling Collection
A number of 95 samples of Bali cattle collected from three different breeding centres were used in this research, 32 were from BPTU Bali Province, 32 from BPT-HMT Sumbawa, and 31 from Village Breeding Centre South Sulawesi.
DNA Extraction and Amplification
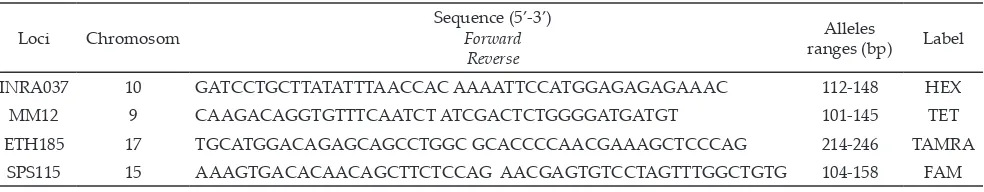
Blood samples were taken from vena jugularis and placed in ependorf tube containing EDTA as anticoagu-lant. Method of DNA extraction is phenol-chloroform (Sambrook et al., 1989). Microsatellite markers according to Table 1 were chosen from the panel of standard-ized markers recommended by the Molecular Genetic Characterization of Animal Resources (FAO, 2011). Microsatellite loci, label, and size range were shown in Table 1. Microsatellite was chosen by recommendation of FAO that has not been used in Bali cattle.
PCR was performed in 30 µL final volume con-tained 0.5 µL forward and reverse primer, 0.5 µL M13 fluorescently (FAM, HEX, TAMRA, TET) and 15 µL green taq master mix PCR kit. PCR condition was per-formed in thermal cycler machine at predenaturation 95 oC for 5 min, denaturation at 95 oC for 45 s, annealing at 60 oC for 45 s, early extention at 72 oC for 1 min, final extention at 72 oC for 5 min, with 35 cycles.
Genotyping
The result of amplification microsatellites was veri-fied by electrophoresis method by using 1.5% agarose gel in 5X TBE buffer. Allelel size in all samples was determined by using labelled fragment fluorescently
Loci Chromosom
Sequence (5’-3’) Forward
Reverse
Alleles
ranges (bp) Label
INRA037 10 GATCCTGCTTATATTTAACCAC AAAATTCCATGGAGAGAGAAAC 112-148 HEX
MM12 9 CAAGACAGGTGTTTCAATCT ATCGACTCTGGGGATGATGT 101-145 TET
ETH185 17 TGCATGGACAGAGCAGCCTGGC GCACCCCAACGAAAGCTCCCAG 214-246 TAMRA
SPS115 15 AAAGTGACACAACAGCTTCTCCAG AACGAGTGTCCTAGTTTGGCTGTG 104-158 FAM
Note: FAO 2011
method in Biosystem Genetic Analyzer. Microsatellite genotyping was interpretated by using GeneMapper.
Statistical Analysis
The results obtained from the genetic analyses, gen-eral population statistics such as genotype frequencies, allele number, effective allele number, allele frequencies, Hardy-Weinberg equilibrium, expected and observed heterozygosity, inbreeding coefficient index between and within population and polymorphism information content were calculated by using GENEPOP 1.2 (Yeh et al., 1999) and Cervus (Kalinoski et al., 2007). Genetic distance and dendogram were analyzed by POPTREE (Takezaki et al., 2010). Dendogram was constructed by UPGMA (Unweighted Pair Group method with Arithmetic Mean) method with 1000 bootstrap.
RESULTS AND DISCUSSION
Loci Polymorphism and Population Genetic Variation
A total of three alleles were found in the INRA037, SPS115, MM12, and ETH185 32 alleles with avarege 8 al-leles per loci. Tolal alal-leles that had been found in SPS115, MM12, INRA037, and ETH185 were 10 alleles, 2 alleles, 14 alleles, and 6 alleles in all populations respectively. The results from those four microsatellite loci analysis showed that genetics diversity of Bali cattle in breeding centers were polymorphic. It means all microsatellite loci have more than one allele.
Polymorfism was confirmed in other breed as number of alleles, such as: INRA037 (10 alleles), SPS115 (14 alleles), MM12 (15 alleles), and ETH185 (17 alleles) in Vietnamese indigenous cattle (Pham et al., 2013). Whrease, Angus breed had 11 alleles in SPS115 and 10 alleles in INRA037, Brangus breed had 8 alleles in SPS115 and 16 alleles in INRA037 (Alba et al., 2010), and Holstein cattle had 8 alleles in SPS115 (Řehout et al., 2006). the SPS115 were found based on the population of Bali cattle in breeding center in Indonesia. They were 6 allele in BPTU Bali, 8 alleles in BPT-HMT and 8 alleles in VBC Barru District. It means the spesific alleles G and H were found only in BPT-HMT Serading, and H and J were found only in VBC Barru based on the SPS115. As for INRA037, specific alleles F, M, and N were detected only in BPTU Bali and specific alleles A was detected only in BPT-HMT Serading. It was found 11 alleles in BPTU Bali population, 10 alleles in BPT-HMT Serading population and VBC Barru population for INRA037. There was no specific allele at MM12 and ETH185 on all Bali cattle population. Four microsatellite loci are effectively used for the evaluation of genetics diversity (Pham et al., 2013) including Bali cattle. Jakaria et al. (2011) stated that 17 microsatellite loci were effective for sheep diversity
detection (Jakaria et al., 2012). However, at this study, the loci MM12 has only two alleles, so loci MM12 is not effective microsatellite loci for detecting genetic diversity in Bali cattle.
SPS115 locus had allele about 259-305 bp sized. Based on FAO 2011, size of allele are about 234-258 bp, so all alleles have the same size. FAO also detected that alelles on locus MM12 had the same size. In this research, the size of alleles on locus MM12 was about 121-123 bp, but based on FAO 2011 was about 101-145 bp. The size of alleles on locus INRA037 was about 132-162 bp, but based on FAO was about 112-148 pb. So, there were five alleles on different locus INRA037, they are I (150 bp), J (152), K (154 bp), L (156 bp), and M (162 bp). The size of alleles on locus ETH185 are about 230-256 bp, but based on FAO (2011) was about 214-246 bp. There was only one allele that exceed, it is alleles F (256 bp). Finnaly, there were 16 alleles on Bali cattle in three different breeding center in Indonesia according to FAO recommendation (2011).
Genetics Diversity Among Populations
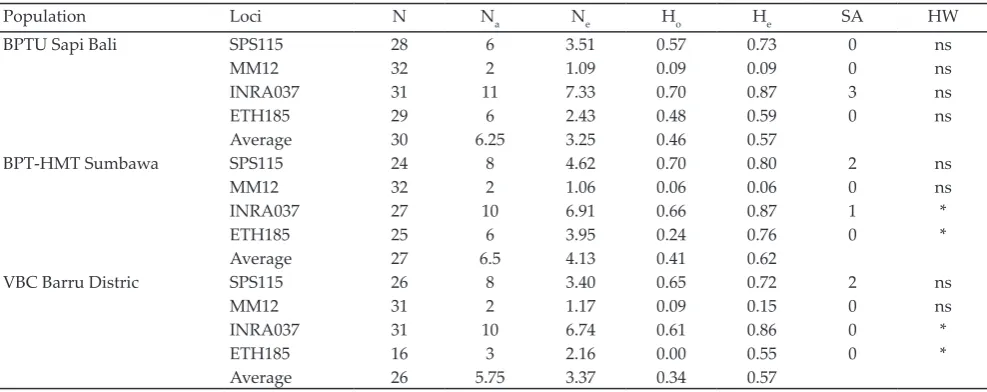
Genetic variation of Bali cattle is presented in Table 3. All population at locus SPS115 and MM12 were in Hardy-Weinberg equilibrium. At locus INRA037 and ETH185, only population in BPTU Bali cattle was in Hardy-Weinberg equilibrium because population of Bali cattle in BPT-HMT Serading VBC Barru were deviated. BPTU Bali cattle population following Hardy-Weinberg equilibrium means the specific conditions. They are no selection, migration, inbreeding and genetic drift. According to Pham et al. (2003), factors that effect Hardy-Weinberg equilibrium were inbreeding, genetic drift, and selection. The population expressed in con-stant Hardy-Weinberg equilibrium from generation to generation if the genotype frequency (p2, 2pq, and q2) and allele frequency (p and q) were resulted from the merger of gametes randomly in large population. Otherwise if accumulation of genotype, population dividing, mutation, selection, migration and mating in same group/population (endogamy) are happened, it can lead unequilibrium of genotype frequency or allele in population (Falconer & Mackay, 1996).
Heterozygosity value is the most accurate pa-rameter for measuring genetic variation, while genetic variation on population is measured by an average of heterozygosity in more than one locus (Nei & Kumar, 2000). Average value of heterozygosity at each breeding center of Bali cattle is in a low range (0.34 to 0.46), that was in accordance with Javanmard et al. (2005) where the value of heterozygosity was less than 0.50.
BPTU Bali cattle was a population which had the highest average of heterozygosity value among other populations (Table 3). Average of heterozygosity value at BPTU Bali cattle population was 0.46 with average of expected heterozygosity value was 0.34. It is be-cause the high variation genetic at locus SPS115 (0.57) and INRA037 (0.70) in BPTU Bali cattle population.
Population of Bali cattle in BPT-HMT Serading and Village Breeding Center Barru had low heterozygosity value at four microsatellite locus because it was under expected value. The highest heterozygosity value was found at locus SPS115 and the lowest was found at locus MM12. Observed heterozygosity value which is lower than expected heterozygosity value indicatates the de-gree of endogamy (mating at the group) influenced from intensive selection process (Machado et al., 2003).
Heterozygosity value was found at Bali cattle in this research. However, it was low category compared to cat-tle in other developing countries, Cina local catcat-tle (He= 0.73) (Zhang et al., 2007) and Ethiophia local cattle (Dadi et al., 2008), and Europhean cattle (0.61 to 0.71) (Canon et al., 2001). However, it was similar to Japanese black cat-tle (He= 0.4) (Kim et al., 2002). Based on that result (Table 3), population of Bali cattle in three breeding centers had low heterozygosity value at four mirosatellite locus. This is due to limited Bali cattle sample number.
The inbreeding rate in all three populations of breeding center of Bali cattle were quite high based on the analysis of four microsatellite loci used. They were 0.296 for Fis and 0.319 for rate inbreeding total (Fit) as presents in Table 4. Average value of observed heterozy-gosity and expected heterozyheterozy-gosity at Bali cattle showed low category with average of variety value 0.33 (Fst). This is because mating system was not directed in every population at breeding centres of Bali cattle. High of inbreeding rate will tend to eliminate genetic variation.
Polymorphism informative content (PIC) (Table 4) were in a ranged 0.095-0.867 with average 0.579. Microsatellite loci INRA037 was microsatellite loci with the highest PIC value (0.867) and the highest number of amplified alleles (13 alleles). Locus SPS115 had PIC value of 0.744, but it is better than locus ETH185 (0.613) and locus MM12 (0.095) (Table 5). It means that INRA037 is most effective locus and MM12 is the least effective locus for Bali cattle identification based on PIC value.
Note: N=Number of samples; Na= Number of alleles observation; Ne= Effective allele; Ho= observed heterozygote; He= expected heterozygote; SA= spesific alleles; HW= Hardy-weinberg equlibrium; ns= not significant; *significant at P<0.05.
Population Loci N Na Ne Ho He SA HW
BPTU Sapi Bali SPS115 28 6 3.51 0.57 0.73 0 ns
MM12 32 2 1.09 0.09 0.09 0 ns
INRA037 31 11 7.33 0.70 0.87 3 ns
ETH185 29 6 2.43 0.48 0.59 0 ns
Average 30 6.25 3.25 0.46 0.57
BPT-HMT Sumbawa SPS115 24 8 4.62 0.70 0.80 2 ns
MM12 32 2 1.06 0.06 0.06 0 ns
INRA037 27 10 6.91 0.66 0.87 1 *
ETH185 25 6 3.95 0.24 0.76 0 *
Average 27 6.5 4.13 0.41 0.62
VBC Barru Distric SPS115 26 8 3.40 0.65 0.72 2 ns
MM12 31 2 1.17 0.09 0.15 0 ns
INRA037 31 10 6.74 0.61 0.86 0 *
ETH185 16 3 2.16 0.00 0.55 0 *
Average 26 5.75 3.37 0.34 0.57
Genetics Relationship
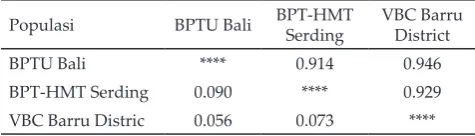
Diagram of the relationship of genetic distance in a population of Bali cattle breeding centers are presented in Figure 1. Four microsatellite loci were able to separate the Bali cattle population in BPTU Bali, BPT-HMT Serading and VBC Barru. Table 5 shows a very high genetic similarity values in three breeding centers of Bali cattle. It represents the similarity of genetic characteristics in the three breeding centers. Although the genetic distance in the three genetic breeding center was very low, it still can be used to characterize the differences among populations. The differences is also depicted on the genetic tree (phylogenetic).
Genetic tree (philogenetic) based on allele frequency at each population showed that the closest on genetic distance of population was found in BPTU Bali cattle and VBC Barru (0.0556), while genetic distance of BPTU Bali cattle and BPT-HMT was the farthest (0.0898). Values of genetic distance at three populations showed the close genetic characteristic relationship between Bali cattle population in BPTU Bali and VBC Barru. It can be explained that those two breeding centers use the same semen from BBIB Singosari bull, where this bull is the the best bull for Bali cattle in BPTU.
CONCLUSION
The highest diversity of microsatellite loci for Bali cattle were for INRA037, SPS115, but ETH 185 loci had low diversity loci. Meanwhile, the lowest diversity was for MM12. The diversity in each population could be used as an evident for the discovery of some specific alleles. There was a genetic distance among Bali cattle population in three breeding center in Indonesia.
ACKNOWLEDGEMENT
characterization of the Hartón del Valle, Angus, Brangus, Holstein, and Senepol cattle breeds in Colombia, using ten
microsatellite markers. Revista Colombiana de Ciencias Pecuarias. 23:283-291.
Berthouly, C., D. Do Ngoc, S. Thévenon, D. Bouchel, T. Nhu Van, C. Danes, V. Grosbois, H. Hoang Thanh, C. Vu Chi,
& J-C. Maillard. 2009. How does farmer connectivity
in-fluence livestock genetic structure? A case-study in a Viet -namese goat population. Mol. Ecol. 18:3980-3991. http:// dx.doi.org/10.1111/j.1365-294X.2009.04342.x
Canon, J. Alexandrino, P. Bessa, I. Carleos, C. Carretero, Y. Dunner, S. Ferran, N. Garcia, D. Jordania, J. Laloe, D.
Pereira, A. Sanchez, & K. Moazami-Goudarzi. 2001.
Genetic diversity measure of local European beef cattle
breeds for conservation purpose. Genet. Sel. 33: 311-332.
http://dx.doi.org/10.1186/1297-9686-33-3-311
Dadi, H., M. Tibbo, Y. Takahashi, K. Nomura, H. Hanada, & T.
Amano. 2008. Microsatellite analysis reveals high genetic
diversity but low genetic structure in Ethiopian indigenous
cattle populations. Anim. Genet. 39:425–431. http://dx.doi.
org/10.1111/j.1365-2052.2008.01748.x
Dani, M. A. C., M. B. Heinneman, & S. U. Dani. 2008. Brazilian
nelore cattle: a melting pot unfolded by moleculer genet
-ics. Genet. Mol. Res. 7:1127-1137.
[DGLAH] Directorate General of Livestok and Animal Health.
2011. Data Collecting Beef Cattle and Buffalo 2011. Minis
-try of Agriculture Republic Indonesia.
Falconer, D. S. & T. F. C. Mackay. 1996. Introduction to
Quanti-tative Genetics. Fourth Ed. Longman Inc., New York.
Note: Nei’s (1972) genetic identity (above diagonal) and genetic distance (below diagonal).
VBC Barru Distric 0.056 0.073 ****
Table 5. Genetic distance of Bali cattle in breeding center popu-lation
Note: N=Number of samples; Na= Number of alleles observation; Ne= Effective allele; Ho= observed heterozygote; He= expected heterozygote; Fis= inbreeding coefficient index; Fst= genetic differentiation index; PIC= Polymorphism Information Content.
Lokus N Na Ne Heterozigositas Fis Fst PIC
Ho He
SPS115 78 10 4.43 0.641 0.779 0.123 0.053 0.744
MM12 95 2 1.11 0.084 0.100 0.151 0.008 0.095
INRA037 89 14 8.29 0.663 0.884 0.226 0.025 0.867
ETH185 70 6 2.84 0.285 0.653 0.614 0.023 0.613
Average 166 8 4.16 0.418 0.604 0.296 0.033 0.579
Table 4. The polymorphism of microsatellite loci in Bali cattle
[FAO] Food and Agriculture Organization of the United Na
-tions. 2011. Molecular Genetic Characterization of Animal
Genetic Resources. FAO Animal Production and Health
Guidelines. No. 9. Rome. pp. 68–69.
Guichoux, E., L. Lagache, S. Wagner, P. Chaumeil, P. Léger, O. Lepais, C. Lepoittevin, T. Malausa, E. Revardel, F. Salin,
& J. R. Petit. 2011. Current trends in microsatellite
geno-typing. Mol. Ecol. 11:591-611. http://dx.doi.org/10.1111/ j.1755-0998.2011.03014.x
Handiwirawan, E., R. R. Noor, Muladno, & L. Schuler. 2003.
The use of HEL9 and INRA035 microsatellite as specific markers for bali cattle. Arch Tierz. Dummerstorf
46:503-512.
Jakaria, M. S. A. Zein, S. Sulandari, Subandriyo, & Muladno.
2012. The use of microsatellite markers to study genetic di-versity in indonesian sheep. JITAA 7:1-9.
Javanmard, A., N. Asadazadeh, M. H. Banabazi, & J.
Tavako-lian. 2005. The allele and genotype frequencies of bovine
pituitary spesific transcription factor and leptin genes in Iranian cattle and buffalo population using PCR-RFLP.
Iran J. Biotech. 3: 104-108.
Kalinowski, S. T., M. L. Taper, & C. M. Tristan. 2007. Revising
how the computer program CERVUS accommodates ge-notyping error increases success in paternity assignment. Mol. Ecol. 16:1099-1106. http://dx.doi.org/10.1111/j.1365-294X.2007.03089.x
Kelkar, Y. D., S. Tyekucheva, F. Chiaromonte, & K. D. Makova.
2008. The genome-wide determinants of human and
chim-panzee microsatellite evolution. Genome. Res. 18:30–38. http://dx.doi.org/10.1101/gr.7113408
Kim, K. S., J. S. Yeo, & C. B. Choi. 2002. Genetic diversity of
north-east Asian cattle based on microsatellite data.
Anim. Genet. 33, 201-204. http://dx.doi.org/10.1046/j.1365-2052.2002.00848.x
Kimberly, A. S. & J. T. Robert. 2006. Microsatellite for ecologist:
a practical guide to using and evaluating microsatellite
markers. Ecol. Lett. 9:615-629. http://dx.doi.org/10.1111/
j.1461-0248.2006.00889.x
Kusdiantoro, M., M. Olsson, H. T. A. van Tol, S. Mikko, B. H. Vlamings, G. Andersson, H. Rodríguez-Martínez, B. Pur-wantara, R. W. Paling, B. Colenbrander, & J. A. Lenstra. 2009. On the origin of Indonesia cattle. Plos One. 4: e5490. http://dx.doi.org/10.1371/journal.pone.0005490
Pham, L. D., D. N. Do, N. T. Binh, L. Q. Nam, N. V. Ba, T. T. T. Thuy, T. X. Hoan, V. C. Cuong, & H. N.
Kadarmi-deen. 2013. Assessment of genetic diversity and
popula-tion structure of Vietnamese indigenous cattle populapopula-tions by microsatellites. Livest. Sci. 155: 17-22. http://dx.doi.
org/10.1016/j.livsci.2013.04.006
Machado, M. A., I. Schuster, M. L. Martinez, & A. L. Campos.
2003. Genetic diversity of four breed using
microsatel-lite marker. Rev Bras. De Zool. 32:93-98. http://dx.doi.
org/10.1590/S1516-35982003000100012
Maskur, Muladno, & B. Tappa. 2007. Identifikasi menggunak
-an marker mikrosatelit d-an hubung-an deng-an sifat ku-an- kuan-titatif pada sapi. Med. Pet. 30: 147-155.
Nei, M. 1972. Genetic distance between populations. Am. Nat.
106: 283-292.
Nei, M. & S. Kumar. 2000. Molecular Evolution and
Phyloge-netics. Oxford Univ Press, New York (US).
Nguyen, T. T., S. Genini, F. Menetrey, M. Malek, P. Vogeli, M.
R. Goe, & G. Stranzinger. 2005. Application of bovine
mi-crosatellite markers for genetic diversity analysis of Swiss
yak (Poephagus grunniens). Anim. Genet. 36:484–489. http://dx.doi.org/10.1111/j.1365-2052.2005.01357.x
Qi, X-B. 2004. Genetic Diversity, Differentiation and Relation
-ship of Domestic yak Populations a Microsatellite and
Mi-tochondrial DNA Study. Lanzhou, P. R. Lanzhou Univer
-sity, China.
Radko, A., A. Zyga, T. Zabek, & E. Slota. 2005. Genetic
vari-ability among Polish Red, Hereford and Holstein-Friesian
cattle raised in Poland based on analysis of microsatellite
DNA sequences. Appl. Genet 2005. 46:89-91.
Řehout, V., E., Hradecka, & J. Čitek. 2006. Evaluation of
par-entage testing in the Czech population of Holstein cattle Czech. J. Anim. Sci. 51: 503–509.
Sambrook, J., F. Fritsch, & T. Miniatis. 1989. Molecular
Clon-ing Laboratory Manual. 3rd Edition. Cold SprClon-ing Harbor Laboratory Press, New York (US)
Shaffer, M. L. 1981. Minimum population sizes for spesies
conservation. BioScience. 31: 131-134. http://dx.doi. org/10.2307/1308256
Stevanovic, J., Z. Stanimirovic, V. Dimitrijevic, & M. Maletic.
2010. Evaluation of 11 microsatellite loci for their use in
paternity testing in Yugoslav Pied cattle (YU Simmental cattle). J. Anim. Sci. 6:221-226.
Storfer, A., M. A. Murphy, J. S. Evans, C. S. Goldberg, S. Rob-inson, S. F. Spear, R. Dezzani, E. Delmelle, L. Vierling,
& L. P. Waits. 2007. Putting the “landscape” in landscape
genetics. Heredity. 98:128-142. http://dx.doi.org/10.1038/ sj.hdy.6800917
Takezaki, N., M. Nei, & K. Tamura. 2010. POPTREE2: Software
for constructing population trees from allele frequency data and computing other population statistics with Win-dows Interface. Mol. Biol. Evol. 27:747-752. http://dx.doi. org/10.1093/molbev/msp312
Winaya, A., Muladno, R. E. Gurnadi, & A. Saefuddin. 2011.
Y chomosome microsatellites variation in bali cattle (Bos sondaicus) population. Anim. Prod 11. 3: 149-154
Xiaojuan, Z., Z. Zhaohui, H. Zhaofeng, T. Pingping, & Z. Run
-lin. 2007. Microsatellite genotpying for four expected
in-bred mouse strain from km mice. J. Genet. Genomics. 34. 3: 214-222. http://dx.doi.org/10.1016/S1673-8527(07)60022-8
Xuebin, Q., H. Jianlin, B. Lkhagva, I. Chekarova, D. Badam -dorj, J. E. Rege, & O. Hanotte. 2005. Genetic diversity
and differentiation of Mongolian and Russian yak popu
-lations. J. Anim. Breed. Genet. 122:117–216. http://dx.doi.
org/10.1111/j.1439-0388.2004.00497.x
Yeh, F. C. 1999. POPGENE version 1.32, the user-friedly sha-ware for population genetic analysis. Molecular Biology and Biotechnology Center. University of Alberta, Canada.
Zhang, G. X., Z. G. Wang, W. S. Chen, C. X. Wu, X. Han, H. Chang, L. S. Zan, R. L. Li, J. H. Wang, W. T. Song, G. F. Xu, H. J. Yang, & Y. F. Luo. 2007. Genetic diversity and
population structure of indigenous yellow cattle breeds of